. 2020 Feb 3;10(6):2832-2848.
doi: 10.7150/thno.37119. eCollection 2020.

Upregulation of neuronal PGC-1α ameliorates cognitive impairment induced by chronic cerebral hypoperfusion

Affiliations

Upregulation of neuronal PGC-1α ameliorates cognitive impairment induced by chronic cerebral hypoperfusion

Bin Han et al. Theranostics. .

Abstract

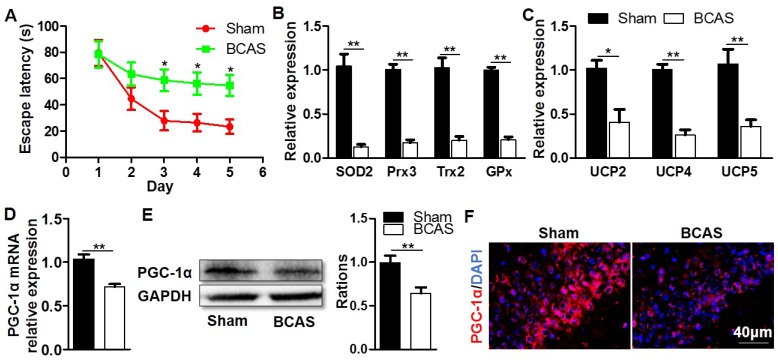
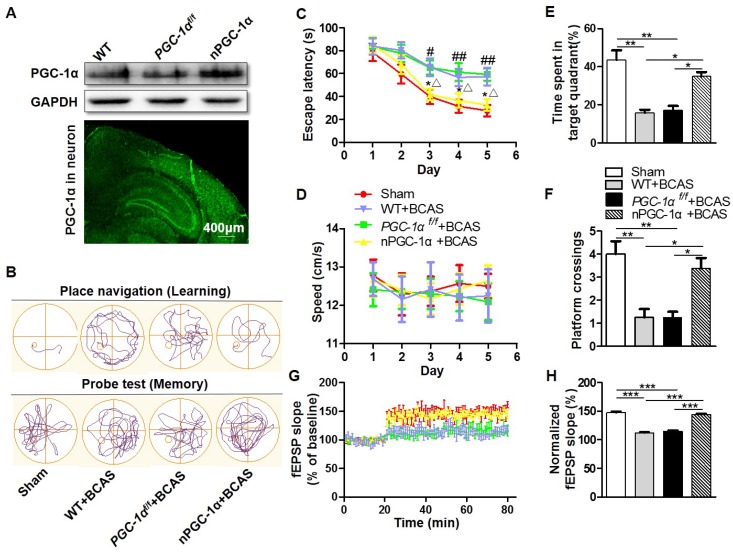
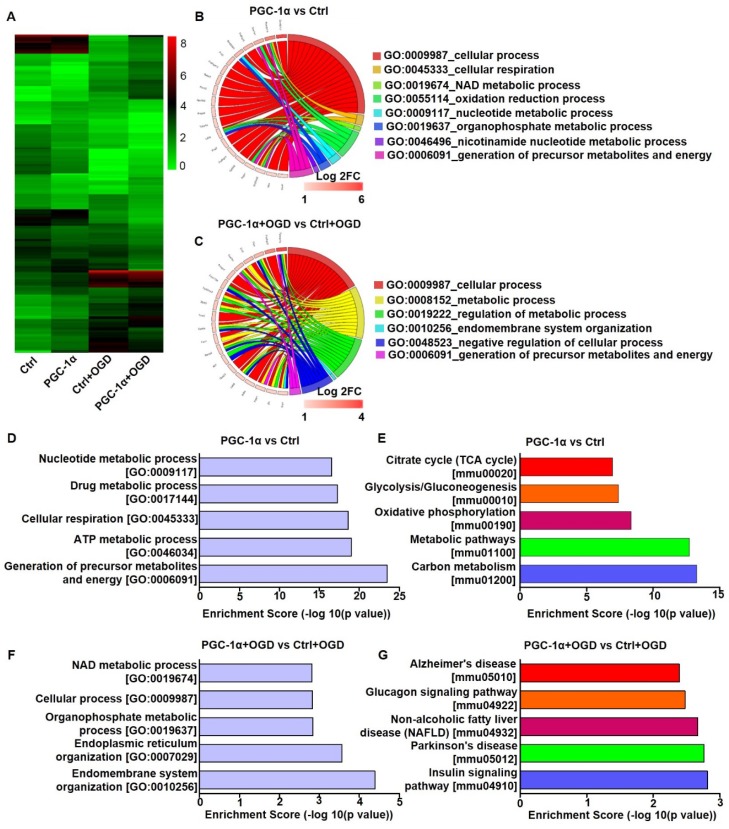
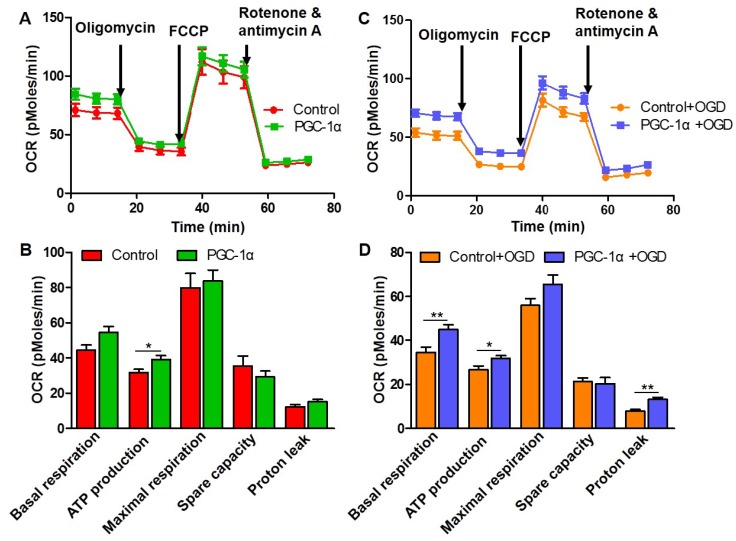
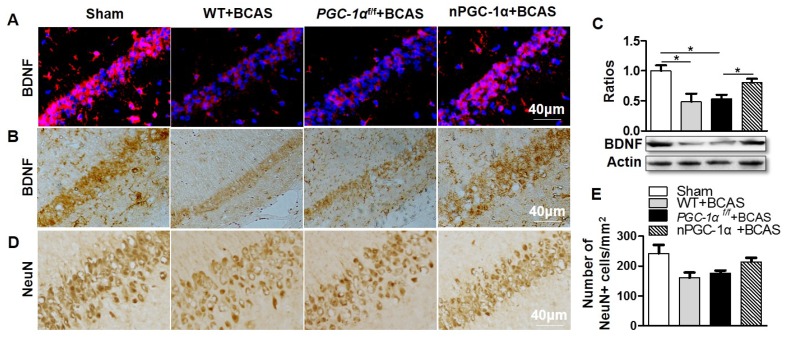
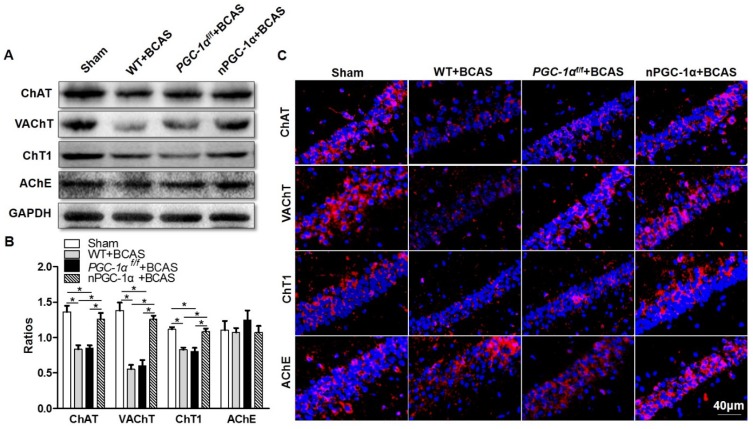
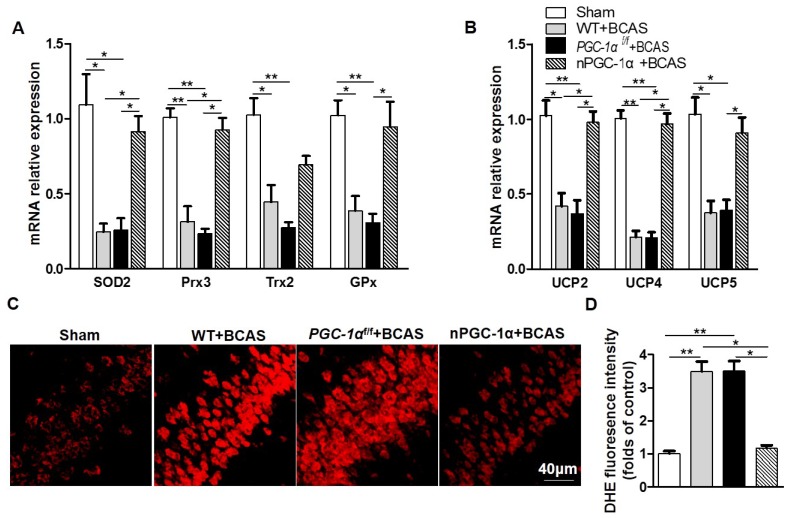
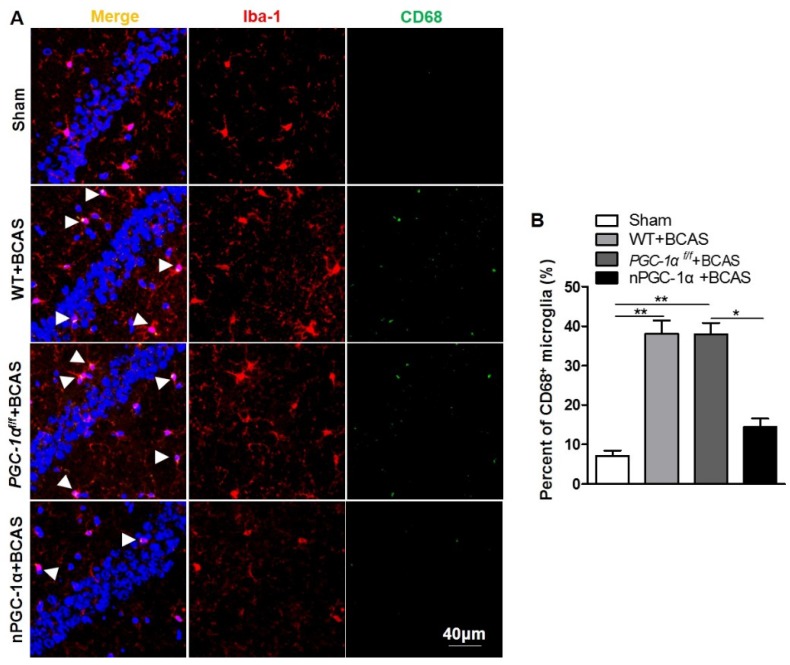
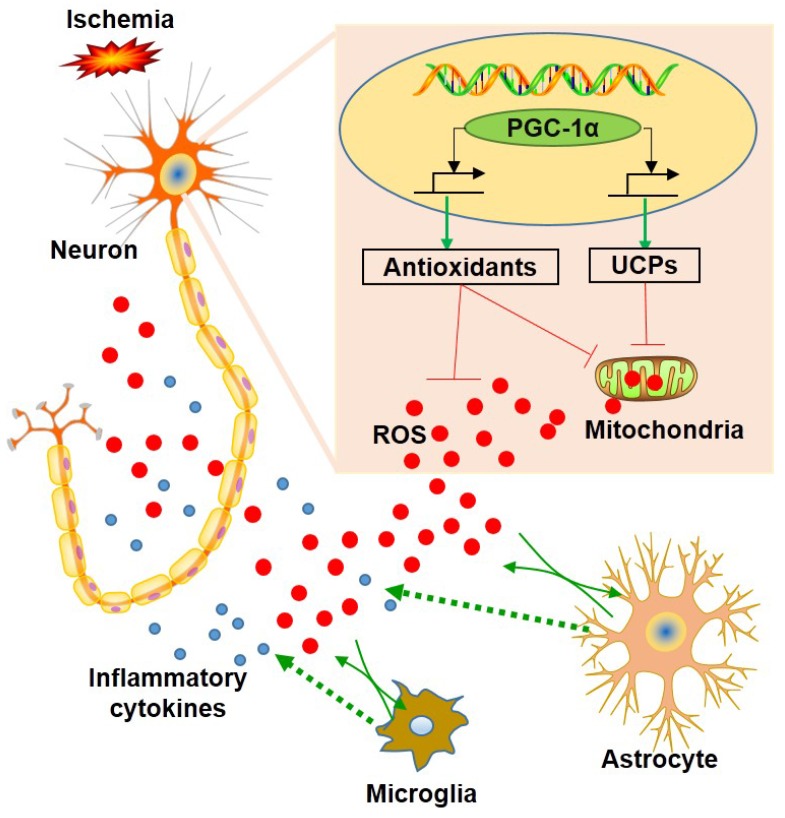
Rationale: Mitochondrial dysfunction and oxidative stress occur in vascular dementia (VaD), but the specific molecular mechanism regulating these events remains unclear. Peroxisome proliferator-activated receptor-γ co-activator-1α (PGC-1α) is a master regulator for mitochondrial function. This study aims to investigate whether PGC-1α is involved in the pathophysiology of VaD. Methods: We firstly generated PGC-1αf/f Eno2-Cre mice to induce neuron-specific overexpression of PGC-1α by crossbreeding PGC-1αf/f mice with Eno2-cre mice. Then, the mice were subjected to bilateral common carotid artery stenosis to induce chronic cerebral hypoperfusion. Neurological function and hippocampal PGC-1α expression was evaluated. Next, RNA-Seq analysis and Seahorse assay were performed on the hippocampal neurons. In addition, mitochondrial antioxidants, uncoupling proteins, ROS production and the activation of glial cells were also measured. Results: Our results showed that hippocampal PGC-1α expression is down-regulated in the mouse VaD model induced by chronic cerebral hypoperfusion. In contrast, neuronal PGC-1α overexpression significantly ameliorated cognitive deficits. RNA-Seq analysis indicated that PGC-1α improved energy metabolism of neurons under hypoxic condition, and Seahorse assay confirmed that PGC-1α increases the metabolic activity of neurons. Further study demonstrated that PGC-1α boosted the expressions of mitochondrial antioxidants and uncoupling proteins (UCPs), including SOD2, Prx3, GPx1, UCP2, UCP4 and UCP5, which in turn reduced reactive oxygen species (ROS) production. Moreover, the activation of microglia and astrocytes was also found to decrease in the hippocampus. All of these changes greatly contributed to protect hippocampal neurons against ischemic insults. Conclusions: PGC-1α could suppress the excessive ROS and neuroinflammation in the hippocampus, opening up a potential therapeutic target for cognitive impairment.

Keywords: PGC-1α; ROS; neuroinflammation; vascular dementia.


Conflict of interest statement

Competing Interests: The authors have declared that no competing interest exists.

Figures

Figure 1
Figure 1
Decreased expression of hippocampal PGC-1α in the mice with chronic cerebral hypoperfusion. Wild-type mice were used to establish the VaD model with the chronic cerebral hypoperfusion induced by BCAS. (A) Evaluation of learning ability for BCAS and sham mice using MWM test. Mean escape latency was longer in the BCAS group at the place navigation stage, revealing the impaired spatial learning ability. (B) qRT-PCR analysis showed a significant reduction in the mRNA expressions of mitochondrial antioxidants in the hippocampus of BCAS group compared to the sham group. (C) The mRNA expressions of hippocampal UCPs were also significantly down-regulated in the BCAS group. The levels of hippocampal PGC-1α mRNA (D) and protein (E) expressions were both significantly down-regulated in the BCAS group. (F) Representative images of immunofluorescent staining clearly showed the decreased PGC-1α expressions in the hippocampal CA1 areas of BCAS mice. *p<0.05, **p<0.01 as determined by two-way ANOVA (A) or Mann-Whitney U test (B-E). n = 6 in each group.
Figure 2
Figure 2
PGC-1α protects against the cognitive impairment caused by chronic cerebral hypoperfusion. (A) Top, Western blots for PGC-1α expressions in the hippocampus from WT, PGC-1αf/fand nPGC-1α mice. Bottom, a representative image for the coronal brain section prepared from nPGC-1α mice showed the neuronal expression of IRES-eGFP. (B) The typical swimming paths of sham-operated, WT+BCAS, PGC-1αf/f +BCAS, and nPGC-1α+BCAS mice in the MWM during learning (top) and memory probe tests (bottom). (C) Escape latencies were much longer in WT+BCAS and PGC-1αf/f +BCAS mice than those in the sham mice or nPGC-1α+BCAS mice. *p<0.05 for the comparison between PGC-1αf/f +BCAS and nPGC-1α+BCAS groups; #p<0.05, ##p<0.01 for the comparison between the sham and PGC-1αf/f +BCAS groups; p<0.05 for the comparison between WT+BCAS and nPGC-1α+BCAS groups, as determined by two-way ANOVA. (D) Mean swimming speed of these 4 groups of mice during spatial training was similar, showing that swim speed may not contribute to the differences in escape latencies. Mean percentage of time spent in target training quadrant (E), and mean number of platform crossings (F) during the probe test. (G) fEPSPs slopes were continuously recorded. (H) Mean fEPSP slope of LTP between 40 min and 60 min after TBS. *p<0.05, **p<0.01, ***p<0.001 as determined by one-way ANOVA. (A, G-H) n = 5 in each group, (B-F) n = 8 in each group.
Figure 3
Figure 3
PGC-1α overexpression alters the gene expression profile of cultured neurons. (A) Cluster analysis for the differentially expressed mRNAs of control, PGC-1α, control+OGD and PGC-1α+OGD groups based on RNA-Seq data. Circle plot showed that the top 20 up-regulated genes were closely related to several biological processes in PGC-1α vs control groups (B) and PGC-1α+OGD vs control+OGD groups (C). (D) Go enrichment analysis for the differentially expressed genes that were up-regulated by PGC-1α. The top 5 enriched biological processes were shown. (E) KEGG pathway analysis for the PGC-1α-upregulated genes after OGD treatment. The top 5 pathways were shown. (F) The bar graph showed the top 5 up-regulated biological processes in the PGC-1α+OGD group compared to the control+OGD group. (G) The top 5 pathways that were up-regulated in the PGC-1α+OGD group compared to the control+OGD group.
Figure 4
Figure 4
PGC-1α increases the mitochondrial respiration in neurons. (A) Seahorse assay for the OCR in HT-22 cells with or without PGC-1α overexpression. (B) Quantification of basal respiration, ATP production, maximal respiration, spare capacity and proton leak. PGC-1α increased the ATP production of neurons. (C) OCR was measured in HT-22 cells after OGD treatment. (D) The 5 key parameters for mitochondrial respiration were calculated from OCR. *p<0.05, **p<0.01 as determined by Mann-Whitney U test. n = 8 in each group.
Figure 5
Figure 5
PGC-1α induces hippocampal BDNF expression after chronic cerebral hypoperfusion. Representative images of brain sections immunostained for BDNF (A, B), and Western blots for BDNF (C) showed that BDNF protein was significantly downregulated in WT+BCAS and PGC-1αf/f +BCAS groups compared to the sham group. By contrast, BDNF was up-regulated in the nPGC-1α+BCAS group. (D, E) Immunostaining in hippocampal CA1 area showed that there was only a downward trend for the numbers of NeuN-positive neurons in the WT+BCAS and PGC-1αf/f +BCAS groups compared to the sham and nPGC-1α+BCAS groups. *p<0.05 as determined by one-way ANOVA. n = 5 in each group.
Figure 6
Figure 6
Neuronal PGC-1α improves the cholinergic dysfunction in the hippocampus. (A, B) Representative images of Western blots demonstrated the decreased ChAT, VAChT and ChT1 in the hippocampus of mice from WT+BCAS and PGC-1αf/f +BCAS groups compared to the sham and nPGC-1α+BCAS groups. There were no significant differences in AChE expression among 4 groups. (C) Representative images of cholinergic immunofluorescence staining showed a similar trend. *p<0.05 as determined by one-way ANOVA. n = 6 in each group.
Figure 7
Figure 7
PGC-1α reduces ROS production. (A) The relative mRNA expressions of mitochondrial antioxidants including SOD2, Prx3, Trx2 and GPx1 were determined by qRT-PCR. (B) The relative mRNA expressions of UCPs including UCP2, UCP4 and UCP5 in the hippocampus from 4 groups were also measured. (C) Representative images of DHE staining reflected the ROS levels in the hippocampus of these 4 groups, indicating that PGC-1α greatly reduced ROS production. (D) DHE fluorescence intensity was quantified, and then expressed as the folds of control. *p<0.05, **p<0.01 as determined by one-way ANOVA. n = 6 in each group.
Figure 8
Figure 8
PGC-1α attenuates the activation of microglia in hippocampus. (A) Immunofluorescent staining of the CD68-positive microglia in the hippocampal CA1 areas of the WT+BCAS, PGC-1αf/f +BCAS, nPGC-1α+BCAS and sham mice after chronic cerebral hypoperfusion. (B) The percent of the CD68-positive microglia. *p<0.05, **p<0.01 as determined by one-way ANOVA. n = 6 in each group.
Figure 9
Figure 9
Schematic representation of the role of neuronal PGC-1α in ischemia. Ischemia induces reactive oxygen species (ROS) production from neurons and glia. In contrast, PGC-1α, a master regulator of mitochondrial function, is involved in mitochondrial biogenesis, and significantly up-regulates the expressions of mitochondrial antioxidants and uncoupling proteins (UCPs), thereby reducing the accumulation of ROS. Subsequently, this condition impedes glial activation, leading to decreased generation for ROS and inflammatory cytokines, and ultimately preventing from the neuronal dysfunction induced by chronic cerebral hypoperfusion.

References

    1. O'Brien JT, Thomas A. Vascular dementia. Lancet. 2015;386:1698–706. - PubMed
    1. Kalaria RN. The pathology and pathophysiology of vascular dementia. Neuropharmacology. 2018;134:226–39. - PubMed
    1. Ni J, Wu Z, Stoka V, Meng J. Increased expression and altered subcellular distribution of cathepsin B in microglia induce cognitive impairment through oxidative stress and inflammatory response in mice. Aging Cell; 2018. e12856. - PMC - PubMed
    1. Shibata M, Ohtani R, Ihara M, Tomimoto H. White matter lesions and glial activation in a novel mouse model of chronic cerebral hypoperfusion. Stroke. 2004;35:2598–603. - PubMed
    1. Farkas E, Donka G, de Vos RA, Mihaly A, Bari F, Luiten PG. Experimental cerebral hypoperfusion induces white matter injury and microglial activation in the rat brain. Acta Neuropathol. 2004;108:57–64. - PubMed

Publication types

Substances