. 2020 Feb 10;10(7):3035-3048.
doi: 10.7150/thno.42559. eCollection 2020.

Inter- and intratumor DNA methylation heterogeneity associated with lymph node metastasis and prognosis of esophageal squamous cell carcinoma

Affiliations

Inter- and intratumor DNA methylation heterogeneity associated with lymph node metastasis and prognosis of esophageal squamous cell carcinoma

Huajing Teng et al. Theranostics. .

Abstract

Background: Esophageal squamous cell carcinoma (ESCC), one of the leading causes of cancer mortality worldwide, is a heterogeneous cancer with diverse clinical manifestations. However, little is known about the epigenetic heterogeneity and its clinical relevance for this prevalent cancer. Methods: We generated 7.56 Tb single-base resolution whole-genome bisulfite sequencing data for 84 ESCC and paired paraneoplastic tissues. The analysis identified inter- and intratumor DNA methylation (DNAm) heterogeneity, epigenome-wide DNAm alterations together with the functional regulators involved in the hyper- or hypomethylated regions, and their association with clinical features. We then validated the correlation between the methylation level of specific regions and clinical outcomes of 96 ESCC patients in an independent cohort. Results: ESCC manifested substantial inter- and intratumor DNAm heterogeneity. The high intratumor DNAm heterogeneity was associated with lymph node metastasis and worse overall survival. Interestingly, hypermethylated regions in ESCC were enriched in promoters of numerous transcription factors, and demethylated noncoding regions related to RXR transcription factor binding appeared to contribute to the development of ESCC. Furthermore, we identified numerous DNAm alterations associated with carcinogenesis and lymph node metastasis of ESCC. We also validated three novel prognostic markers for ESCC, including one each in the promoter of CLK1, the 3' untranslated region of ZEB2, and the intergenic locus surrounded by several lncRNAs. Conclusions: This study presents the first population-level resource for dissecting base-resolution DNAm variation in ESCC and provides novel insights into the ESCC pathogenesis and progression, which might facilitate diagnosis and prognosis for this prevalent malignancy.

Keywords: cancer mortality; epigenetic heterogeneity; personalized medicine; prognostic markers; whole-genome bisulfite sequencing.


Conflict of interest statement

Competing Interests: The authors have declared that no competing interest exists.

Figures

Figure 1
Figure 1
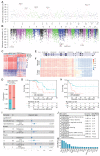
Epigenome-wide changes of DNA methylation in ESCC. (A) Landscape of somatic genetic mutations in 42 ESCC patients. Each row denotes a gene, and each column represents an individual tumor. The uppermost scale indicates the number of identified mutations (y-axis) for each patient (x-axis). The top five rows of the x-axis indicate key clinical parameters for each patient. The right side of the y-axis shows the percentage of samples with mutations for each gene. Mutation type and clinical characteristics are represented by different colors. DNA methylation (B) and global DNA methylation (C) levels between 42 tumors and paired normal tissues. (D) Metaplot of CpG methylation levels across gene bodies. TSS, transcription start site; TES, transcription end site. (E) Multidimensional scaling plot of the tumor and normal tissues based on the methylation levels of all reference genes. (F) Interindividual DNA methylation heterogeneity quantified by the coefficient of variation between 42 tumors and paired normal tissues.
Figure 2
Figure 2
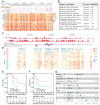
DNA methylation alteration within promoters in ESCC. Genome-wide distribution of significantly hypermethylated (A) and hypomethylated (B) regions in ESCC. (C) Hierarchical clustering for methylation values of aberrantly methylated promoters. (D) Proportion of promoter-associated DMRs to aberrantly hypermethylated (hyper) or hypomethylated (hypo) regions. Example of tumor-specific hypermethylation at the promoter or the intron of CLK1 transcripts (E, F), one of the strongest genome-wide signals on chromosome 2 (A). Kaplan-Meier plot showing overall survival (G) and disease-free survival (H) stratified by ESCC patients of our sequenced (G) and TCGA-ESCA cohort (H) according to methylation levels of the CLK1 promoter locus, respectively. (I) Multivariate Cox regression analysis of methylation levels based on a probe (cg20805479) within the CLK1 promoter locus after controlling for gender and TNM stage. (J) Functional enrichment of genes with differentially hypermethylated promoters in ESCC. (K) Transcription factors binding site enrichment of aberrantly hypermethylated promoter regions.
Figure 3
Figure 3
Hypomethylated changes within noncoding regions in ESCC. (A) Tumor-specific hypomethylation at the CASC9 promoter locus with decreased DNA methylation in the sequenced ESCC tumors and high histone H3K27 acetylation in ESCC cell lines. H3K27ac profiles include a cross-tissue consensus track from the ENCODE database and ChIP-seq data from two ESCC cell lines (TE7, KYSE510) from a previous study . (B) Significant overlap of aberrantly hypomethylated intergenic regions with public annotation data of cancer cell lines, based on LOLA Core enrichment analysis . Tumor-specific hypomethylation at the intergenic locus (Chr14: 86,799,804-86,800,434) with decreased DNA methylation in the sequenced ESCC tumors (D) and high histone H3K27 acetylation in ESCC and ENCODE cell lines (C). Kaplan-Meier plots showing overall survival (E) and disease-free survival (F) stratified for the sequenced ESCC patients (E) and the TCGA-ESCA cohort (F) according to methylation levels of the intergenic locus (Chr14: 86,799,804-86,800,434). (G) Multivariate Cox regression analysis based on methylation levels of a probe (cg19958593) within the intergenic locus (Chr14: 86,799,804-86,800,434) after controlling for gender and TNM stage.
Figure 4
Figure 4
DNA methylation changes associated with LNM in ESCC patients. (A) Interindividual DNA methylation heterogeneity quantified by the coefficient of variation (CV) between patients with or without LNM. The coefficient of variation across each genome was calculated as a measure of heterogeneity between samples. (B) Kaplan-Meier plot showing overall survival stratified by subjects from the sequenced ESCC patients according to the interindividual DNA methylation heterogeneity level. (C) Distribution of differentially methylated regions between tissues of patients with or without LNM. Red and blue dots correspond to aberrantly hypomethylated and hypermethylated regions, respectively. (D) LNM-specific hypomethylation at the 3' untranslated region of ZEB2 in patients with LNM. Kaplan-Meier plots showing overall survival (E) and disease-free survival (F) stratified according to the methylation level of 3' untranslated region of ZEB2 in the sequenced ESCC patients (E) and TCGA-ESCA cohort (F). (G) Multivariate Cox regression analysis based on the methylation level of a probe (cg14827198) within the 3' untranslated region of ZEB2 after controlling for gender and TNM stage.
Figure 5
Figure 5
DNA methylation patterns identify widespread intratumor heterogeneity in patients with LNM. Distribution of sample-wise discordantly methylated read (PDR) scores (A), epipolymorphism (B), and entropy (C) between patients with or without LNM. (D) Kaplan-Meier plots showing overall survival stratified according to PDR score in subjects from the sequenced patients. Density scatterplot showing the relationship between epipolymorphism and entropy (E), entropy and PDR (F), and epipolymorphism and PDR (G) for 5-kb tiling regions.
Figure 6
Figure 6
Intratumor DNA methylation heterogeneity within copy number alteration (CNAs) regions of ESCC patients. (A) Regions of recurrent focal amplifications (left) and focal deletions (right) are plotted by the false discovery rate (x-axis) for each chromosome (y-axis). Distribution of entropy (B), epipolymorphism (C), and discordantly methylated read (PDR) scores (D) across the genome of ESCC patients between CNA and non-CNA regions

References

    1. Bray F, Ferlay J, Soerjomataram I, Siegel RL, Torre LA, Jemal A. Global cancer statistics 2018: GLOBOCAN estimates of incidence and mortality worldwide for 36 cancers in 185 countries. CA Cancer J Clin. 2018;68:394–424. - PubMed
    1. Enzinger PC, Mayer RJ. Esophageal cancer. N Engl J Med. 2003;349:2241–52. - PubMed
    1. Rustgi AK, El-Serag HB. Esophageal carcinoma. N Engl J Med. 2014;371:2499–509. - PubMed
    1. Zhang L, Zhou Y, Cheng C, Cui H, Cheng L, Kong P. et al. Genomic analyses reveal mutational signatures and frequently altered genes in esophageal squamous cell carcinoma. Am J Hum Genet. 2015;96:597–611. - PMC - PubMed
    1. Arnold M, Soerjomataram I, Ferlay J, Forman D. Global incidence of oesophageal cancer by histological subtype in 2012. Gut. 2015;64:381–7. - PubMed

Publication types