. 2020 Feb 10;10(7):3308-3324.
doi: 10.7150/thno.43189. eCollection 2020.

Alginate oligosaccharides improve germ cell development and testicular microenvironment to rescue busulfan disrupted spermatogenesis

Affiliations

Alginate oligosaccharides improve germ cell development and testicular microenvironment to rescue busulfan disrupted spermatogenesis

Yong Zhao et al. Theranostics. .

Abstract

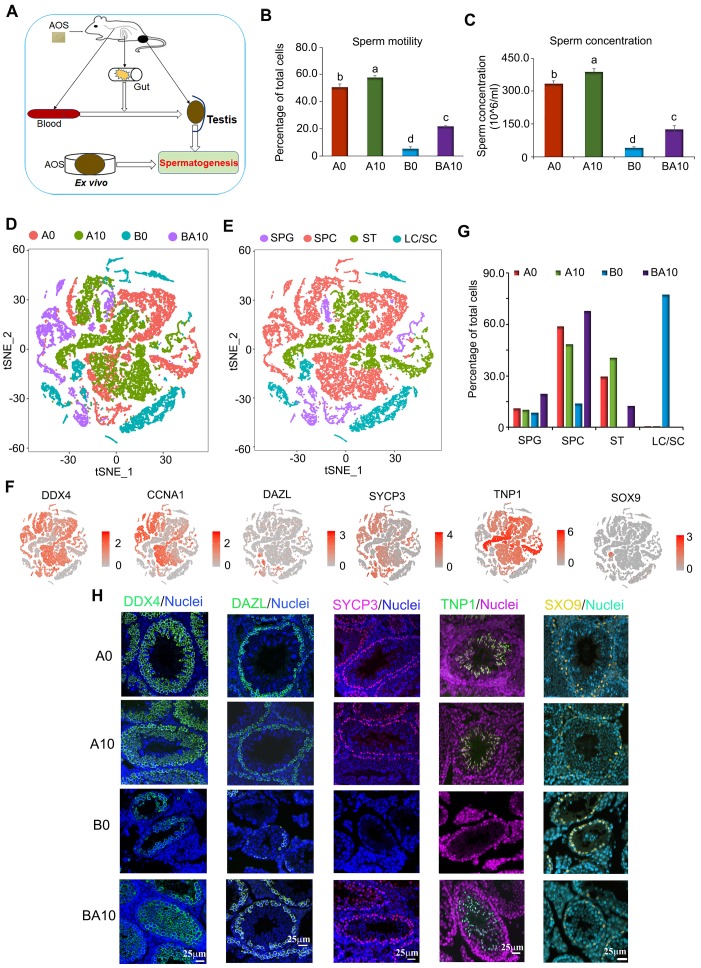
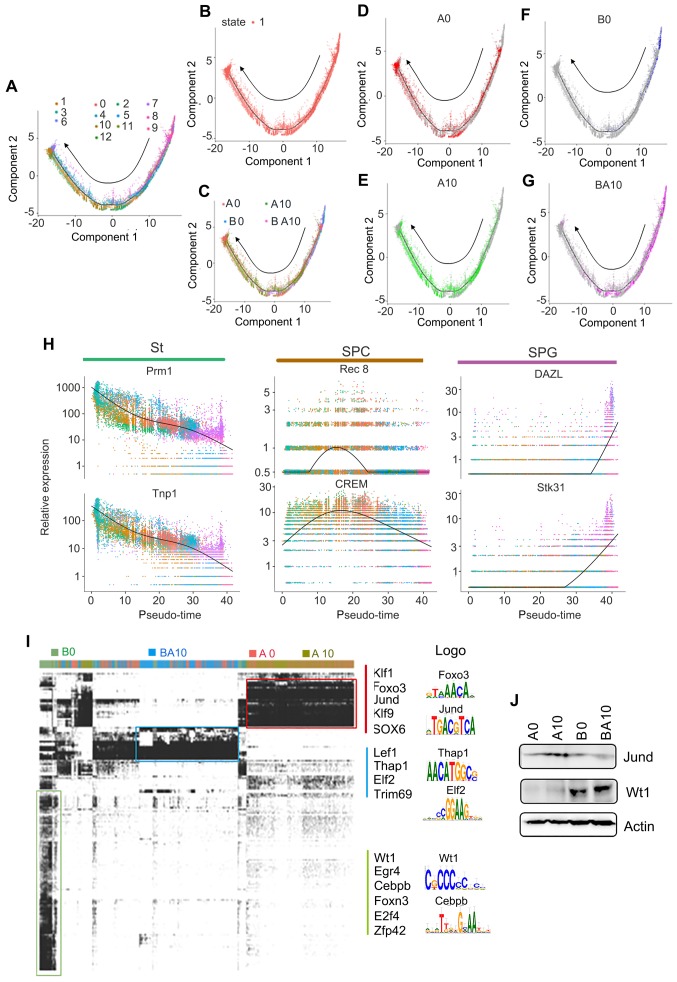
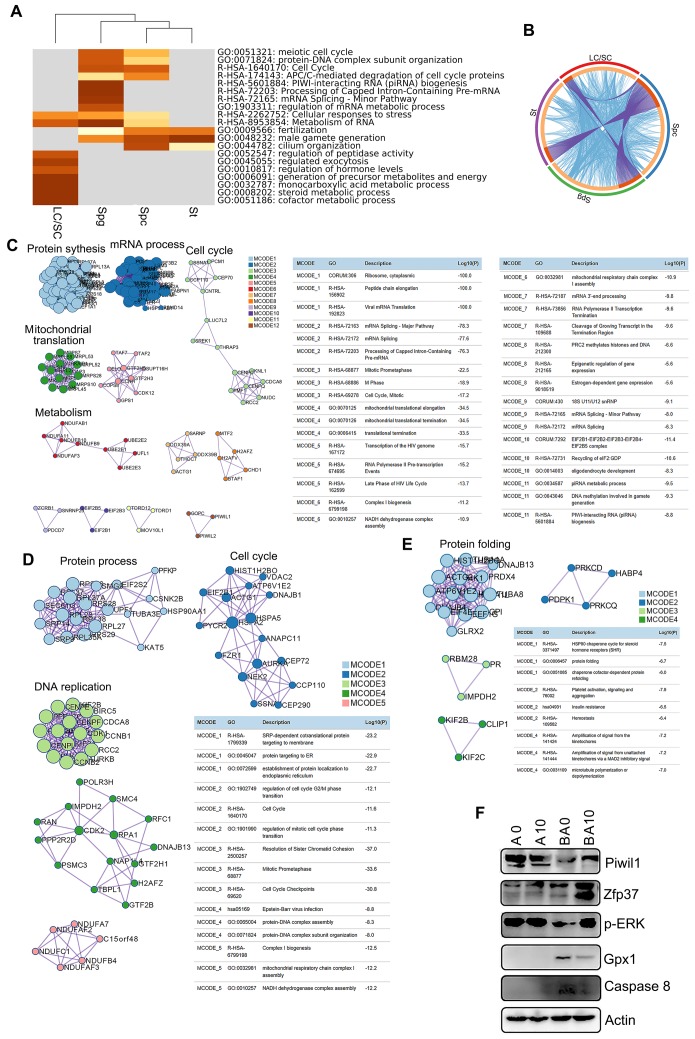
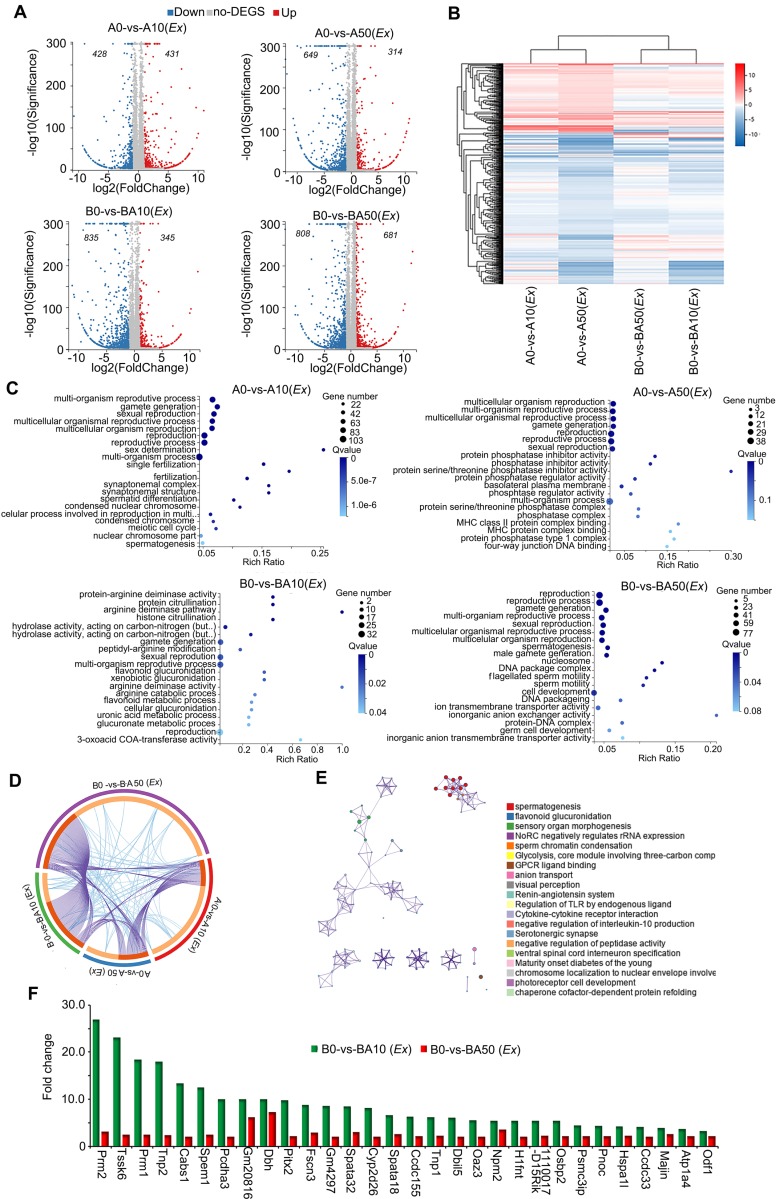
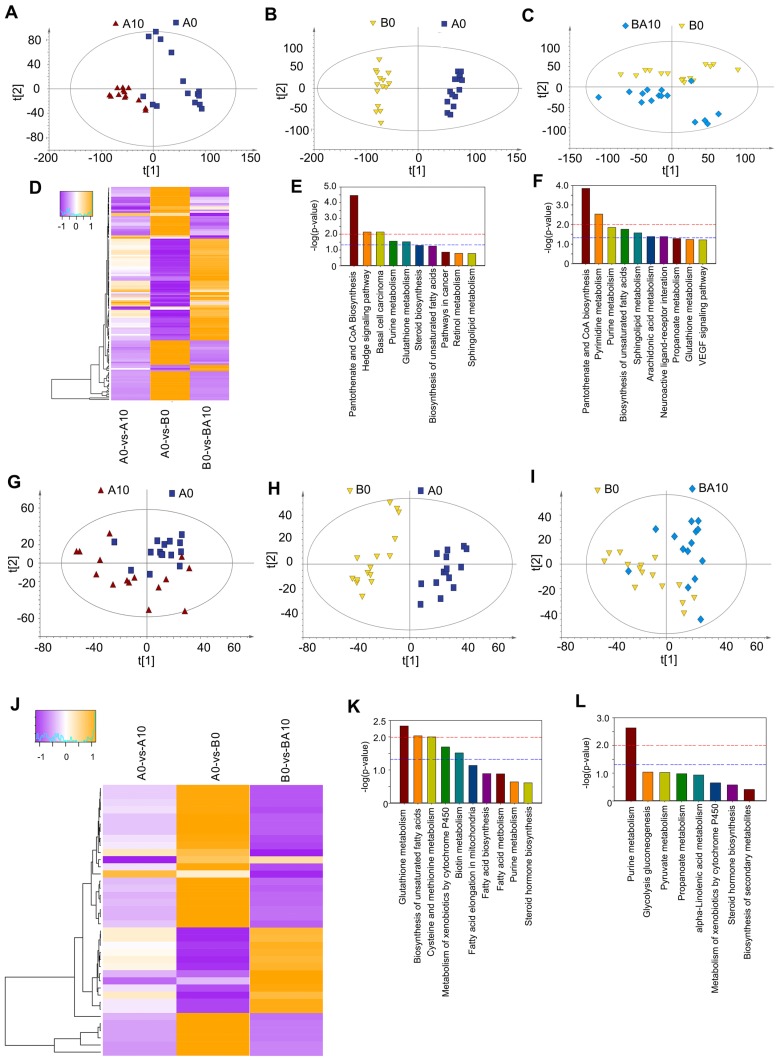
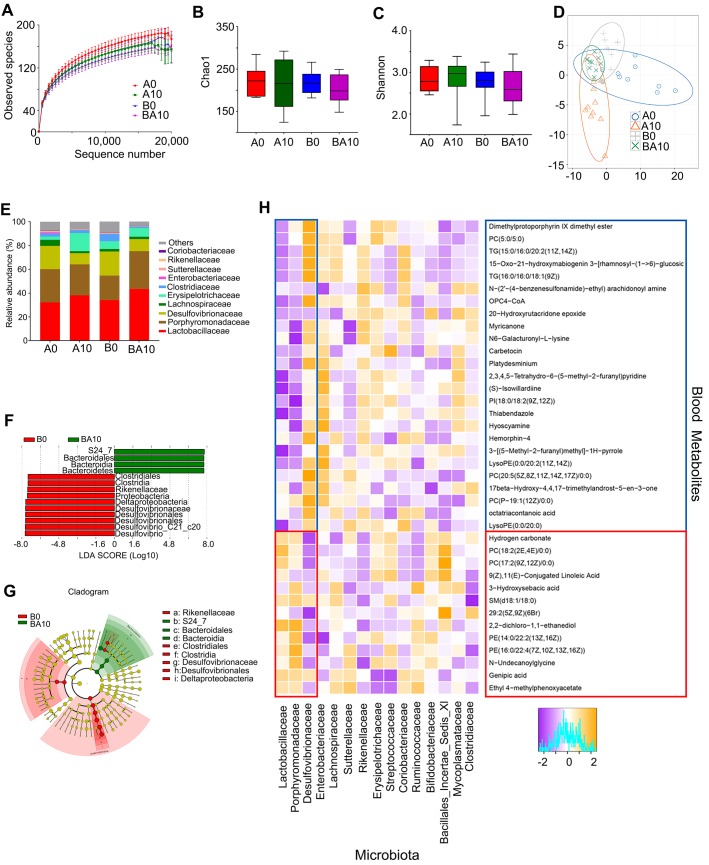
Rationale: Busulfan is currently an indispensable anti-cancer drug, particularly for children, but the side effects on male reproduction are so serious that critical drug management is needed to minimize any negative impact. Meanwhile, alginate oligosaccharides (AOS) are natural products with many consequent advantages, that have attracted a great deal of pharmaceutical attention. In the current investigation, we performed single-cell RNA sequencing on murine testes treated with busulfan and/or AOS to define the mitigating effects of AOS on spermatogenesis at the single cell level. Methods: Testicular cells (in vivo) were examined by single cell RNA sequencing analysis, histopathological analysis, immunofluorescence staining, and Western blotting. Testes samples (ex vivo) underwent RNA sequencing analysis. Blood and testicular metabolomes were determined by liquid chromatography-mass spectrometry (LC/MS). Results: We found that AOS increased murine sperm concentration and motility, and rescued busulfan disrupted spermatogenesis through improving (i) the proportion of germ cells, (ii) gene expression important for spermatogenesis, and (iii) transcriptional factors in vivo. Furthermore, AOS promoted the ex vivo expression of genes important for spermatogenesis. Finally, our results showed that AOS improved blood and testis metabolomes as well as the gut microbiota to support the recovery of spermatogenesis. Conclusions: AOS could be used to improve fertility in patients undergoing chemotherapy and to combat other factors that induce infertility in humans.

Keywords: AOS; Metabolome; Microbiota; Single cell RNA sequencing; Spermatogenesis.


Conflict of interest statement

Competing Interests: The authors have declared that no competing interest exists.

Figures

Figure 1
Figure 1
Mouse sperm motility, concentration, and scRNA-seq analysis. (A) Study design. (B) Mouse sperm motility. The y-axis represents the percentage of cells. The X-axis represents the treatment (n = 30/group). a,b,c Means not sharing a common superscript are different (p < 0.05). (C) Mouse sperm concentration. The y-axis represents the concentration. The x-axis represents the treatment (n = 30/group). a,b,c Means not sharing a common superscript are different (p < 0.05). (D) scRNA-seq cell map based on tSNE for the four treatment groups. (E) Cell clusters in scRNA-seq analysis. (F) Marker genes for each cluster. (G) The proportion of cells in each cluster in every sample. (H) IHF for some of the marker genes.
Figure 2
Figure 2
Pseudotime analysis and transcriptional factor screening for scRNA-seq data. (A) Trajectory reconstruction of SPGs, SPCs, and STs based on cell clusters. (B) State status in pseudotime analysis. (C) Trajectory plot based on different treatment samples. (D) Trajectory plot for AOS 0. (E) Trajectory plot for AOS 10. (F) Trajectory plot for B+A 0. (G) Trajectory plot for B+A 10. (H) Marker gene expression patterns in Monocle analysis. (I) SCENIC results from the murine testis samples. Different transcriptional factors in different samples AOS 0, AOS 10, B+A 0, and B+A 10. (J) WB data for some of the transcriptional factors.
Figure 3
Figure 3
Enrichment analysis and protein-protein interaction networks for scRNA-seq data. (A) Enrichment analysis for SPGs, SPCs, STs, and LCs/SCs using the online tool in Metascape. (B) Circos plots showing interaction between these clusters of cells. The shared marker genes are linked by purple lines, and similar terms are linked by blue lines. (C) Protein-protein interaction networks of marker genes in the SPG cluster. (D) Protein-protein interaction networks of marker genes in the SPC cluster. (E) Protein-protein interaction networks of marker genes in the ST cluster. (F) WB of some proteins important for spermatogenesis and maintaining cell function in mouse testis samples.
Figure 4
Figure 4
RNA-seq data for ex vivo experiments. (A) Volcano map summary of RNA-seq data in ex vivo experiments. The four comparisons: AOS 0 vs. AOS 10 (ex vivo); AOS 0 vs. AOS 50 (ex vivo); B+A 0 vs. B+A 10 (ex vivo); and B+A 0 vs. B+A 50 (ex vivo). (B) Heatmap summary of the differentially expressed genes in the four comparisons in the ex vivo experiment. (C) GO enrichment of up-regulated genes in the four comparisons in the ex vivo experiment. (D) Circos plots showing interactions between the four comparisons in multiple enrichment analysis in the ex vivo experiment. (E) Enrichment network of shared marker genes in the comparisons in the ex vivo experiment. Each term is indicated by a circular node that is colored according to comparison; nodes that share the same cluster ID are typically close to each other. (F) Gene expression comparison of RNA-seq data in the ex vivo experiments and the 10x scRNA-seq data in the in vivo experiments.
Figure 5
Figure 5
Plasma and testis metabolome changes. (A) PCA of mouse testis metabolites in the AOS 0 and AOS 10 groups. (B) PCA of mouse testis metabolites in the AOS 0 and B+A 0 groups. (C) PCA of mouse testis metabolites in the B+A 0 and B+A 10 groups. (D) Heatmap of changed testis metabolites. (E) Enriched pathways of changed testis metabolites in AOS 0 vs. AOS 10. (F) Enriched pathways of changed testis metabolites in B+A 0 vs. B+A 10. (G) PCA of mouse plasma metabolites in the AOS 0 and AOS 10 groups. (H) PCA of mouse plasma metabolites in the AOS 0 and B+A 0 groups. (I) PCA of mouse plasma metabolites in the B+A 0 and B+A 10 groups. (J) Heatmap of changed plasma metabolites. (K) Enriched pathways of changed plasma metabolites in AOS 0 vs. AOS 10. (L) Enriched pathways of changed plasma metabolites in B+A 0 vs. B+A 10.
Figure 6
Figure 6
Small intestinal microbiota changes and correlation of changed intestinal microbiota and changed plasma metabolites. The alpha index of the small intestine microbiota: (A) Rarefaction curve; (B) Chao1 index; (C) Shannon index. (D) The PLS-DA of the microflora in different treatments. (E) Differences of bacterial abundance at the family level. (F) LDA distribution. (G) Cladogram. Linear discriminate analysis effect size (LEfSe) was performed to determine the difference in abundance; the threshold of LDA score was 4.0. (n = 10 samples/group)

References

    1. Wang M, Liu X, Chang G, Chen Y, An G, Yan L. et al. Single-cell RNA sequencing analysis reveals sequential cell fate transition during human spermatogenesis. Cell Stem Cell. 2018;23:599–614. - PubMed
    1. Sohni A, Tan K, Song HW, Burow D, de Rooij DG, Laurent L. et al. The neonatal and adult human testis defined at the single-cell level. Cell Rep. 2019;26:1501–17.e4. - PMC - PubMed
    1. Zhou Q, Wang M, Yuan Y, Wang X, Fu R, Wan H. et al. Complete meiosis from embryonic stem cell-derived germ cells in vitro. Cell Stem Cell. 2016;18:330–40. - PubMed
    1. Levine H, Jørgensen N, Martino-Andrade A, Mendiola J. Weksler-Derri D, Mindlis I, et al. Temporal trends in sperm count: a systematic review and meta-regression analysis. Hum Reprod Update. 2017;23(6):646–59. - PMC - PubMed
    1. Jung SW, Kim HJ, Lee BH, Choi SH, Kim HS, Choi YK. et al. Effects of Korean red ginseng extract on busulfan-induced dysfunction of the male reproductive system. J Ginseng Res. 2015;39(3):243–9. - PMC - PubMed

Publication types

MeSH terms