. 2020 Feb 10;10(7):3351-3365.
doi: 10.7150/thno.41219. eCollection 2020.

ATRX/EZH2 complex epigenetically regulates FADD/PARP1 axis, contributing to TMZ resistance in glioma

Affiliations

ATRX/EZH2 complex epigenetically regulates FADD/PARP1 axis, contributing to TMZ resistance in glioma

Bo Han et al. Theranostics. .

Abstract

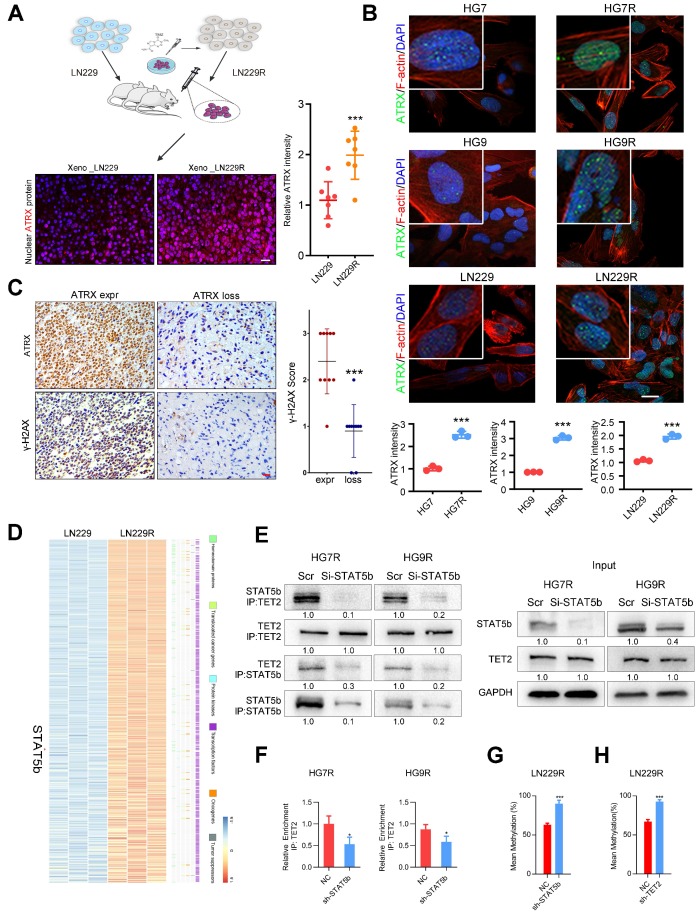
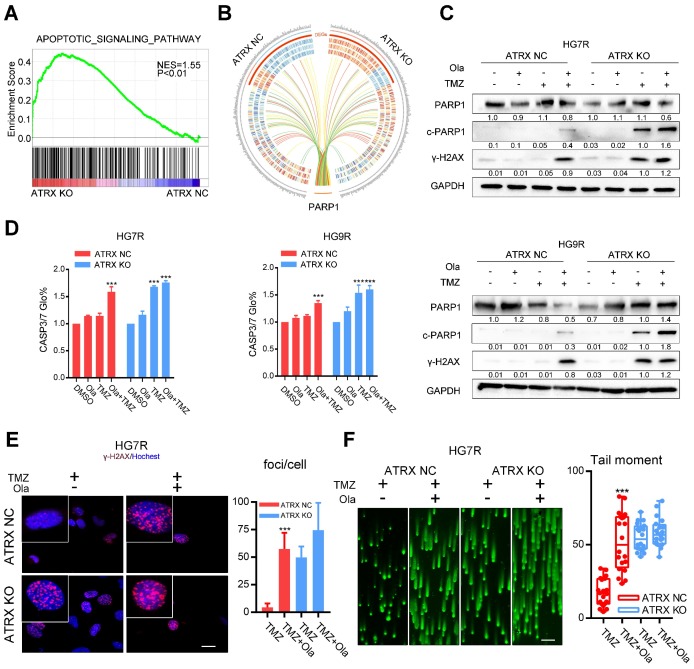
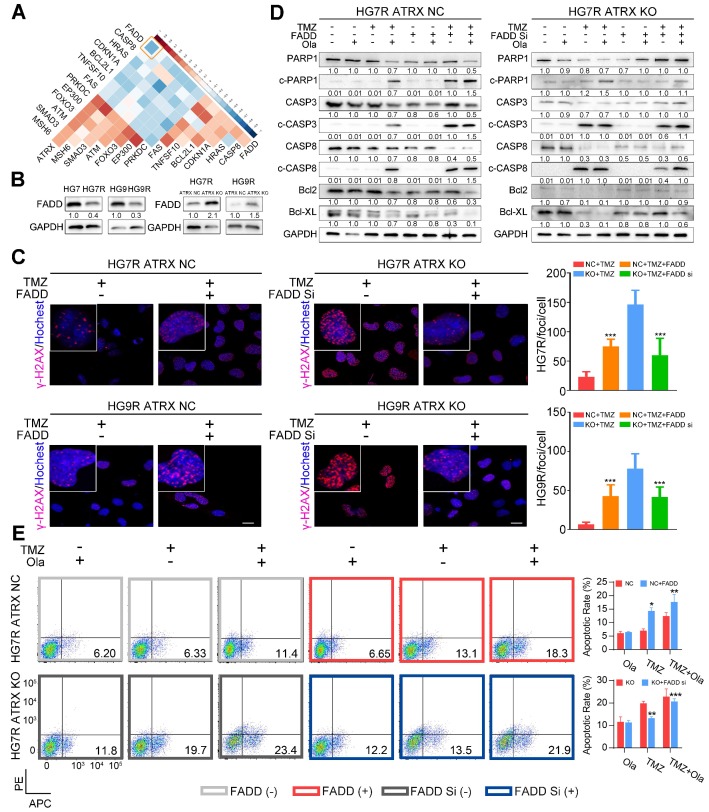
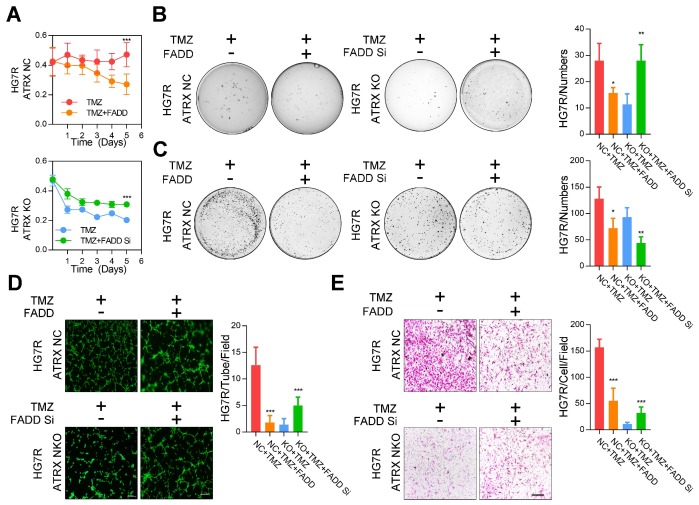
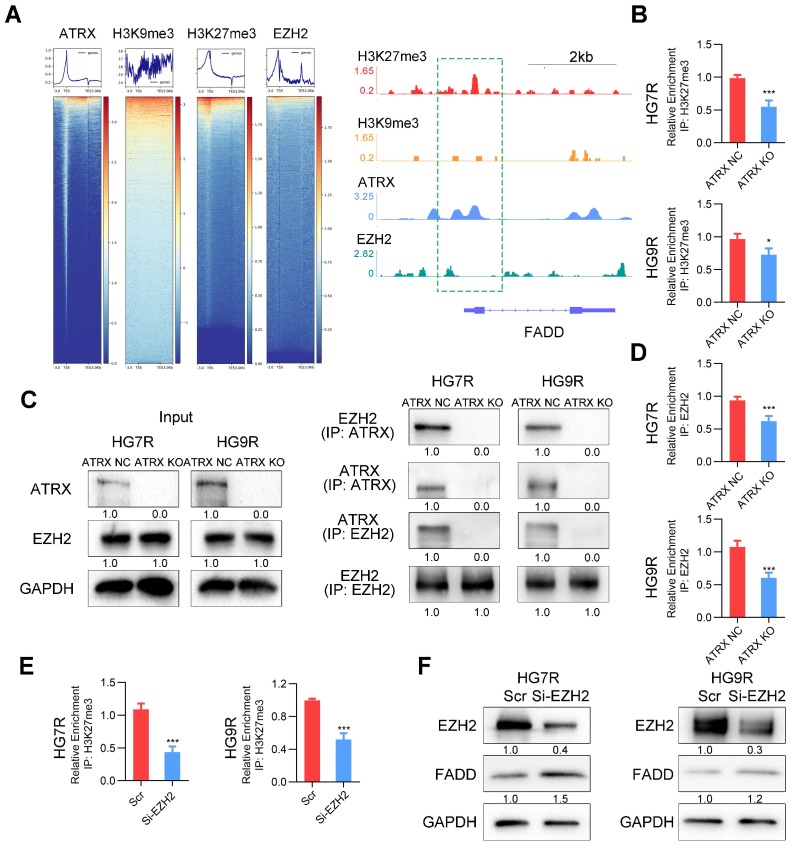
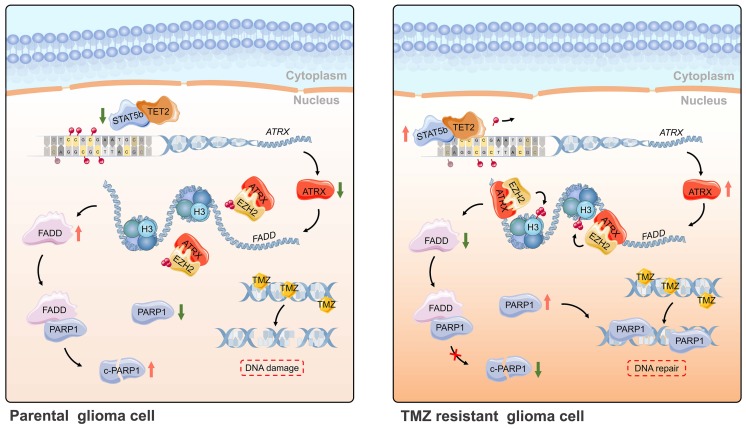
Rationale: Glioma is the most common primary malignant brain tumor in adults. Chemoresistance of temozolomide (TMZ), the first-line chemotherapeutic agent, is a major issue in the management of patients with glioma. Alterations of alpha thalassemia/mental retardation syndrome X-linked (ATRX) gene constitute one of the most prevalent genetic abnormalities in gliomas. Therefore, elucidation of the role of ATRX contributing to TMZ resistance in glioma is urgently needed. Methods: We performed the bioinformatics analysis of gene expression, and DNA methylation profiling, as well as RNA and ChIP-seq data sets. CRISPR-Cas9 gene editing system was used to achieve the ATRX knockout in TMZ resistant cells. In vitro and in vivo experiments were carried out to investigate the role of ATRX contributing to TMZ resistance in glioma. Results: We found that ATRX expression was upregulated via DNA demethylation mediated by STAT5b/TET2 complex and strengthened DNA damage repair by stabilizing PARP1 protein in TMZ resistant cells. ATRX elicited PARP1 stabilization by the down-regulating of FADD expression via the H3K27me3 enrichment, which was dependent on ATRX/EZH2 complex in TMZ resistant cells. Magnetic resonance imaging (MRI) revealed that the PARP inhibitor together with TMZ inhibited glioma growth in ATRX wild type TMZ resistant intracranial xenograft models. Conclusions: The present study further illustrated the novel mechanism of the ATRX/PARP1 axis contributing to TMZ resistance. Our results provided substantial new evidence that PARP inhibitor might be a potential adjuvant agent in overcoming ATRX mediated TMZ resistance in glioma.

Keywords: ATRX; EZH2; PARP1; TMZ resistance; glioma.


Conflict of interest statement

Competing Interests: The authors have declared that no competing interest exists.

Figures

Figure 1
Figure 1
ATRX expression is increased via DNA demethylation mediated by STAT5b/TET2 complex. (A) ATRX expression of xenograft gliomas formed by LN229R and LN229 cells. Scale: 20 μm. Schematic used elements from Servier Medical Art: https://smart.servier.com. (B) ATRX expression in HG7, HG9, LN229, HG7R, HG9R and LN229R detected by IF. Scale: 20 μm. (C) Expression of γ-H2AX in ATRX express and ATRX loss glioma tissues. Scale: 20 μm. ***P < 0.001, Chi-squared test. (D) Heatmap with the differentially expressed genes annotated with six gene families. (E) Co-IP assay of STAT5b and TET2 in HG7R and HG9R cells treated with STAT5b knockdown. (F) ChIP-PCR assay showing the TET2 enrichment in ATRX promoter regions of HG7R and HG9R cells treated with STAT5b siRNAs. Error bars indicate mean ± SD. (G-H) The average levels of methylation in ATRX promoter between STAT5b/TET2 knockdown LN229R group and NC group. ***P < 0.001, Student's t-test.
Figure 2
Figure 2
Olaparib increases DNA damage induced by TMZ by inhibiting the ATRX mediated PARP1 stabilization. (A) GSEA of the apoptotic signaling pathway was performed in ATRX NC and ATRX KO cells. (B) Differentially expressed genes of the apoptotic signaling pathway between ATRX NC and ATRX KO cells and their interaction with PARP1. (C) Western blotting of PARP1, c-PARP1 and γ-H2AX of ATRX NC and ATRX KO cells treated with 200 μM TMZ and/or 1 μM olaparib. TMZ and olaparib were added to culture medium for 72 hours. (D) CASP3/7 activity of ATRX NC and ATRX KO cells treated with TMZ and/or olaparib. TMZ and olaparib were added to culture medium for 72 hours. (E) TMZ and olaparib were added to culture medium at final concentrations of 200 μM and 1 μM, respectively, for 72 hours. γ-H2AX is shown in red and nucleus in blue. Bar plots showed the statistics of immunofluorescence assays in HG7R. Scales: 20 μm. (F) Comet assays measuring the DNA damage status in ATRX NC and ATRX KO cells treated with TMZ or combination of TMZ and olaparib in HG7R. Scales: 100 μm. Error bars indicate mean ± SD. *** P < 0.001, Student's t-test.
Figure 3
Figure 3
FADD mediated by ATRX inhibits PARP1 stabilization and strengthen DNA damage and apoptosis induced by TMZ. (A) Correlations among ATRX and thirteen apoptotic molecules interacting with PARP1 in TCGA dataset. (B) Expression level of FADD in HG7, HG7R, HG9, HG9R, ATRX NC and ATRX KO cells. (C) IF assays showing γ-H2AX levels (γ-H2AX in red and nucleus in blue) of ATRX NC and ATRX KO cells with FADD overexpression or knockdown. Scale: 20 μm. The statistic of IF assays are shown in bar plots. (D) Expression levels of PARP1, cPARP1, CASP8, cCASP8, CASP3, cCASP3, BCL-XL and BCL2 detected by Western blot in ATRX NC and ATRX KO cells with FADD overexpression or knockdown treated with 200 μM TMZ and/or 1 μM olaparib. (E) Apoptosis of HG7R NC and HG7R KO cells with FADD overexpression or knockdown treated with 200 μM TMZ and/or 1μM olaparib for 72 hours. Error bars indicated mean ± SD. *P < 0.05, **P < 0.01, ***P < 0.001, Student's t-test.
Figure 4
Figure 4
The proliferative, invasive ability and vascular mimicry of ATRX NC and ATRX KO HG7R cells with FADD overexpression or knockdown treated with TMZ. (A) CCK-8 assays in ATRX NC and ATRX KO HG7R cells with FADD overexpression or knockdown treated with 200μM TMZ. (B-C) Soft agar colony formation assays, colony formation assays in ATRX NC and ATRX KO HG7R cells with FADD overexpression or knockdown treated with 200μM TMZ. (D) Vascular mimicry assays in ATRX NC and ATRX KO HG7R cells with FADD overexpression or knockdown treated with 200μM TMZ. (E) Transwell assays of ATRX NC and ATRX KO HG7R cells with FADD overexpression or knockdown accompanied by TMZ. Cells were treated with TMZ at a final concentration of 200 μM. Scale: 200 μm. The statistics was showed in bar plots. Error bars indicated mean ± SD. * P < 0.05, ** P < 0.01, *** P < 0.001; Student's t-test.
Figure 5
Figure 5
FADD is suppressed by H3K27me3 ATRX/EZH2 complex mediated H3K27me3 enrichment in HG7R and HG9R cells. (A) Heatmap showing the read counts within a region spanning ± 3 kb around TSS. The IGV browser image of H3K27me3, H3K9me3, ATRX and EZH2 enrichment in FADD promoter region. (B) ChIP-PCR analysis of FADD promoter regions with antibodies targeting H3K27me3 in ATRX NC and KO cells. (C) Co-IP assay of the interaction between ATRX and EZH2 in ATRX NC and KO cells. (D) ChIP-PCR analysis of FADD promoter regions with antibodies targeting EZH2 in ATRX NC and KO cells. (E) ChIP-PCR analysis of FADD promoter regions with antibodies targeting H3K27me3 in HG7R and HG9R cells with EZH2 knockdown (EZH2 si3 was used in the assay). (F) FADD expression was detected by Western blotting in HG7R and HG9R cells treated with EZH2 knockdown.
Figure 6
Figure 6
Concomitant PARPi with TMZ inhibits glioma growth in TMZ resistant xenograft models. (A-B) The MRI images of ATRX NC and ATRX KO xenograft gliomas treated with control, TMZ or a combination of TMZ and olaparib (n = 7 per group). (C-D) Tumor volumes and the survival curves of nude mice in different groups. *** P < 0.001 and “ns” means not significant; Student's t-test. (E) The FADD, c-CASP3 and c-PARP1 levels of xenograft gliomas in different groups detected by IHC assays. Scale: 40 μm. The γ-H2AX expression level detected by IF. Scale: 40 μm. (F) IHC staining quantification of FADD, c-CASP3, c-PARP and γ-H2AX. *** P < 0.001 “ns” not significant, Chi-squared test.
Figure 7
Figure 7
Schematic of epigenetic modulation of ATRX by STAT5b/TET2 complex regulating the FADD/PARP1 axis and contributing to TMZ resistance in glioma. Schematic used elements from Servier Medical Art: https://smart.servier.com.

References

    1. Tan SK, Pastori C, Penas C, Komotar RJ, Ivan ME, Wahlestedt C. et al. Serum long noncoding RNA HOTAIR as a novel diagnostic and prognostic biomarker in glioblastoma multiforme. Mol Cancer. 2018;17:74. - PMC - PubMed
    1. Jiang T, Mao Y, Ma W, Mao Q, You Y, Yang X. et al. CGCG clinical practice guidelines for the management of adult diffuse gliomas. Cancer Lett. 2016;375:263–73. - PubMed
    1. Wang Q, Cai J, Fang C, Yang C, Zhou J, Tan Y. et al. Mesenchymal glioblastoma constitutes a major ceRNA signature in the TGF-beta pathway. Theranostics. 2018;8:4733–49. - PMC - PubMed
    1. Perry JR, Belanger K, Mason WP, Fulton D, Kavan P, Easaw J. et al. Phase II trial of continuous dose-intense temozolomide in recurrent malignant glioma: RESCUE study. J Clin Oncol. 2010;28:2051–7. - PubMed
    1. Osuka S, Van Meir EG. Overcoming therapeutic resistance in glioblastoma: the way forward. J Clin Invest. 2017;127:415–26. - PMC - PubMed

Publication types

MeSH terms