

Global Trends and Forecast of the Burden of Adverse Effects of Medical Treatment: Epidemiological Analysis Based on the Global Burden of Disease Study
- PMID: 32195068
- PMCID: PMC7071843
- DOI: 10.7759/cureus.7250
Global Trends and Forecast of the Burden of Adverse Effects of Medical Treatment: Epidemiological Analysis Based on the Global Burden of Disease Study
Abstract
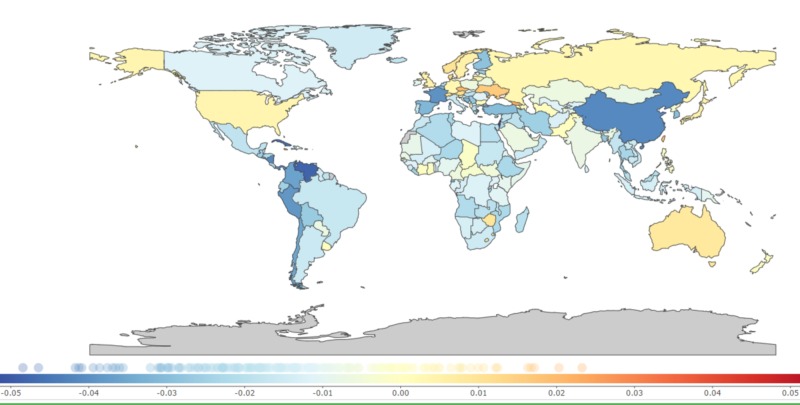
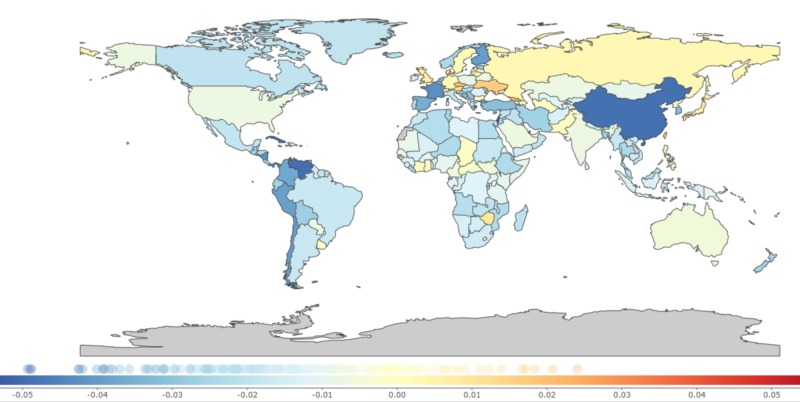
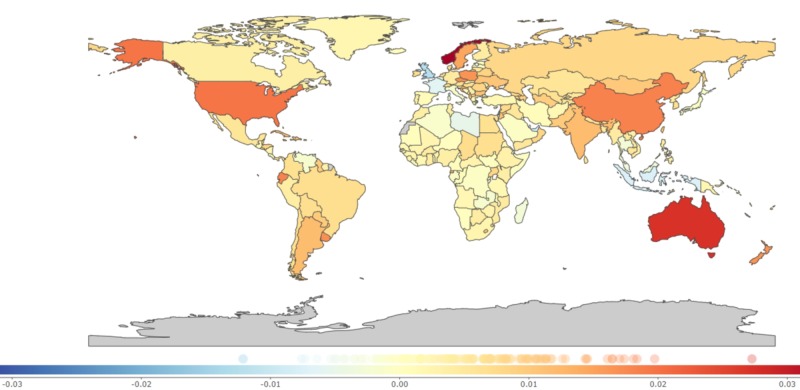
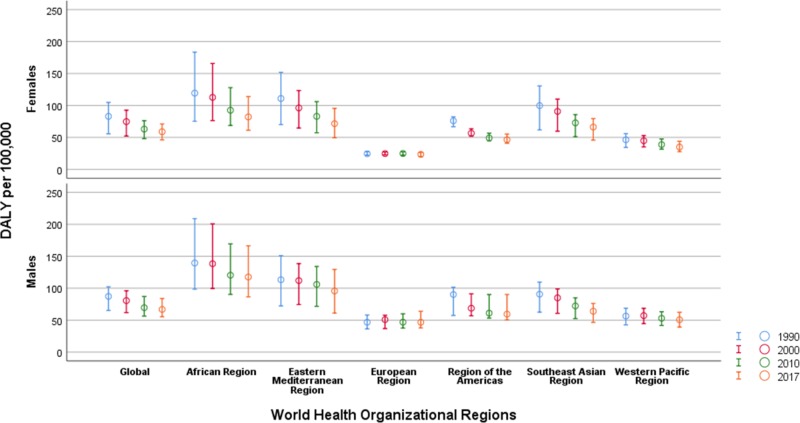
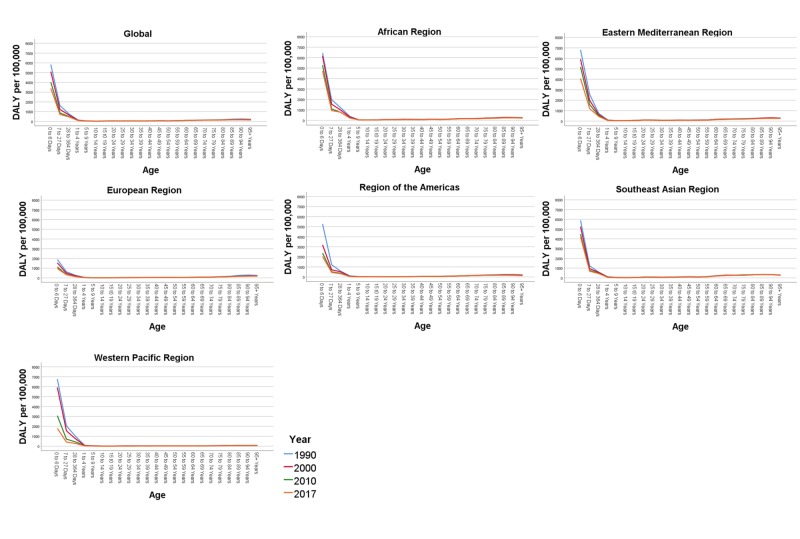
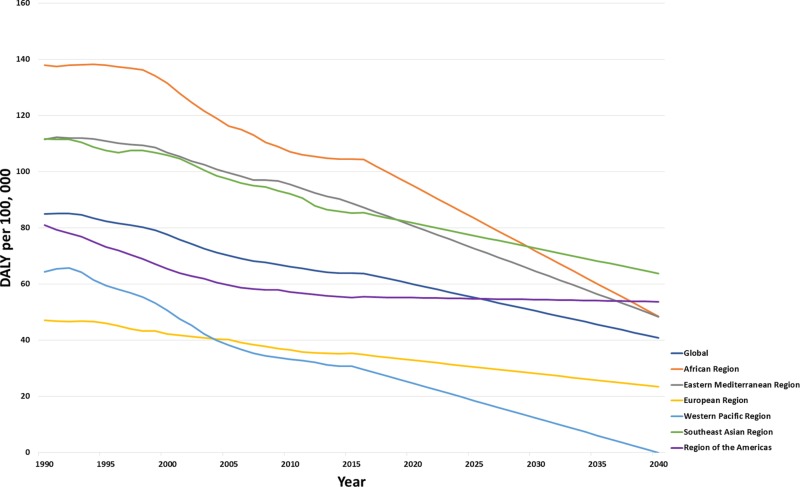
Aim To quantify and update the years of life lost (YLL), years lived with disability (YLD) and disability-adjusted life years (DALY) due to the adverse effects of medical treatment (AEMT) between 1990 and 2017. Subject and methods We analyzed the latest dataset from the Global Burden of Disease (GBD) 2017 study. We described the burden of AEMT based on the number of DALY. We additionally evaluated the global age and sex-specific DALY and compared the age-standardized rates of DALY across the World Health Organization (WHO) regions from 1990 to 2017. Results Worldwide, the total DALYs due to AEMT were 84.93 [95% uncertainty interval (UI), 62.52 to 102.21] in 1990 and 62.79 (52.09 to 75.45) in 2017 per 100,000 population. The global percentage of change in DALY showed a negative trend of -26.06 % (-41.52 to -10.59) across all WHO regions between 1990 and 2017. The YLD has increased during the period from 1997 to 2017 by 29.47% (17.87 to 41.06). In 2017, men were affected more than women with a DALY of 66.78 in comparison to 58.91 DALY in women. DALY rates per 100,000 were highest across all the WHO regions in the first years of life. The predicted DALY rates were 59.92 (57.52 to 62.32) in the year 2020, 50.36 (32.03 to 68.70) in 2030, and 40.8 (-1.33 to 82.93) in 2040. Conclusion Using the GBD 2017 study data, we found a decrease in the DALY rate due to AEMT between 1990 and 2017 with a varying range of DALY between different WHO regions. DALY also differed by age and sex. The forecasting analyses showed a decrease in DALY due to AEMTs with a significant drop in the European region when compared to the African and American regions. However, the increasing trend for YLD signifies an increasing burden of people living with poor health due to AEMT. Our study proposes to identify disability due to AEMT as a significant public health crisis and calls for policymakers to create a robust revised policy.
Keywords: adverse events; complication of treatment; daly; disability; global burden; health care system; health policy; patient safety; yld; yll.
Copyright © 2020, Khan et al.
Conflict of interest statement
The authors have declared that no competing interests exist.
Figures
Similar articles
-
Global Incidence and Mortality Trends due to Adverse Effects of Medical Treatment, 1990-2017: A Systematic Analysis from the Global Burden of Diseases, Injuries and Risk Factors Study.Cureus. 2020 Mar 14;12(3):e7265. doi: 10.7759/cureus.7265. Cureus. 2020. PMID: 32195071 Free PMC article.
-
Global trends and partial forecast of adverse effects of medical treatment from 1990 to 2019: an epidemiological analysis based on the global burden of disease study 2019.BMC Public Health. 2024 Jan 25;24(1):295. doi: 10.1186/s12889-023-17560-0. BMC Public Health. 2024. PMID: 38273270 Free PMC article.
-
Burden of chronic kidney disease and its risk-attributable burden in 137 low-and middle-income countries, 1990-2019: results from the global burden of disease study 2019.BMC Nephrol. 2022 Jan 5;23(1):17. doi: 10.1186/s12882-021-02597-3. BMC Nephrol. 2022. PMID: 34986789 Free PMC article.
-
Global and regional burden of death and disability from peripheral artery disease: 21 world regions, 1990 to 2010.Glob Heart. 2014 Mar;9(1):145-158.e21. doi: 10.1016/j.gheart.2013.12.008. Glob Heart. 2014. PMID: 25432124 Review.
-
Global "burden of disease"-study for psychiatric disorders.Psychiatr Prax. 2001 Jul;28 Suppl 1:S7-11. doi: 10.1055/s-2001-15381. Psychiatr Prax. 2001. PMID: 11533901 Review.
Cited by
-
Methodological considerations in injury burden of disease studies across Europe: a systematic literature review.BMC Public Health. 2022 Aug 17;22(1):1564. doi: 10.1186/s12889-022-13925-z. BMC Public Health. 2022. PMID: 35978333 Free PMC article.
-
Implementation challenges to patient safety in Guatemala: a mixed methods evaluation.BMJ Qual Saf. 2022 May;31(5):353-363. doi: 10.1136/bmjqs-2020-012552. Epub 2021 May 26. BMJ Qual Saf. 2022. PMID: 34039747 Free PMC article.
-
A systematic review of whole disease models for informing healthcare resource allocation decisions.PLoS One. 2023 Sep 14;18(9):e0291366. doi: 10.1371/journal.pone.0291366. eCollection 2023. PLoS One. 2023. PMID: 37708188 Free PMC article.
-
Comprehensive Measurement of the Burden of Disease due to Adverse Events: A New Analysis of the Cross-Sectional Patient Safety Incident Inquiry.J Korean Med Sci. 2023 Nov 6;38(43):e337. doi: 10.3346/jkms.2023.38.e337. J Korean Med Sci. 2023. PMID: 37935164 Free PMC article.
-
Effects of a Rice Bran Dietary Intervention on the Composition of the Intestinal Microbiota of Adults with a High Risk of Colorectal Cancer: A Pilot Randomised-Controlled Trial.Nutrients. 2021 Feb 6;13(2):526. doi: 10.3390/nu13020526. Nutrients. 2021. PMID: 33561964 Free PMC article. Clinical Trial.
References
-
- Institute of Medicine (US) Committee on Quality of Health Care in America. Institute of Medicine (US) Committee on Quality of Health Care in America. https://www-ncbi-nlm-nih-gov.uaeu.idm.oclc.org/books/NBK225187/ Washington (DC): National Academies Press (US); 2000. To Err is Human: Building a Safer Health System; p. 1. - PubMed
-
- “To err is human”: a report from the Institute of Medicine. Havens DH, Boroughs L. J Pediatr Health Care. 2000;14:77–80. - PubMed
-
- Institute of Medicine report: crossing the quality chasm: a new health care system for the 21st century. Wolfe A. Policy Politics Nurs Pract. 2001;2:233–235.
-
- Medical error—the third leading cause of death in the US. Makary MA, Daniel M. BMJ. 2016;353:0. - PubMed
LinkOut - more resources
Full Text Sources