. 2020 Mar 3:8:127.
doi: 10.3389/fcell.2020.00127. eCollection 2020.

Moderate Fluid Shear Stress Regulates Heme Oxygenase-1 Expression to Promote Autophagy and ECM Homeostasis in the Nucleus Pulposus Cells

Affiliations

Moderate Fluid Shear Stress Regulates Heme Oxygenase-1 Expression to Promote Autophagy and ECM Homeostasis in the Nucleus Pulposus Cells

Sheng Chen et al. Front Cell Dev Biol. .

Abstract

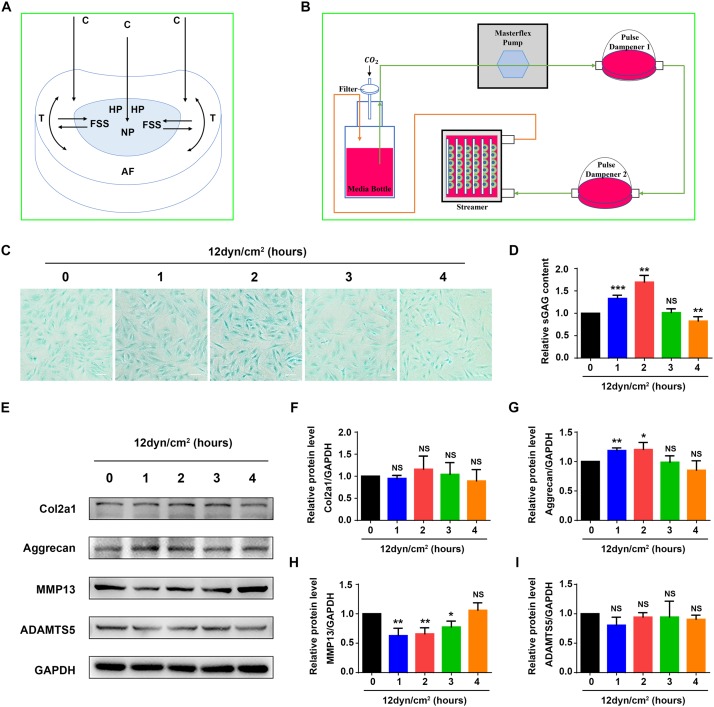
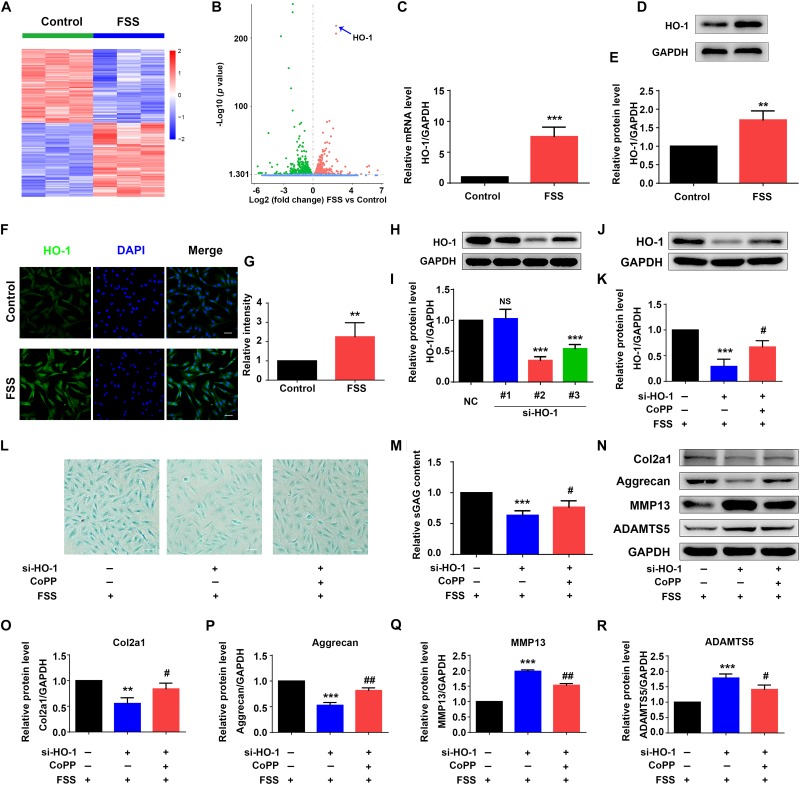
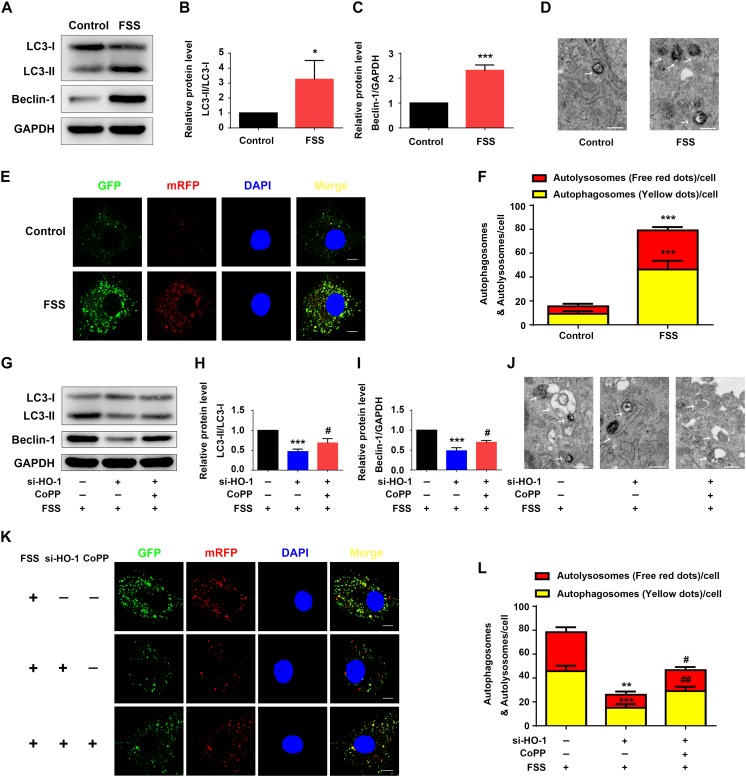
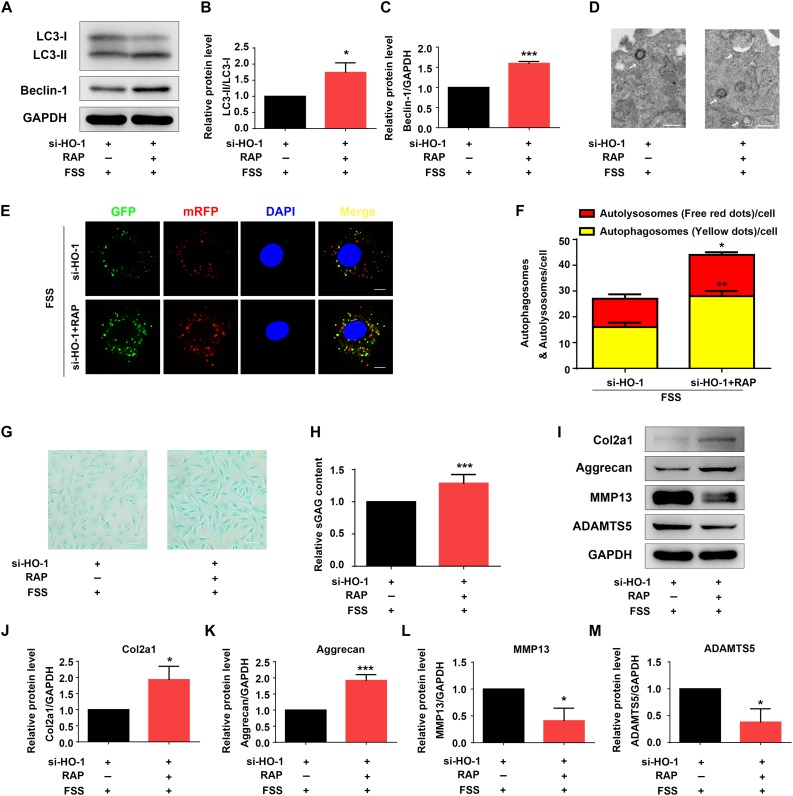
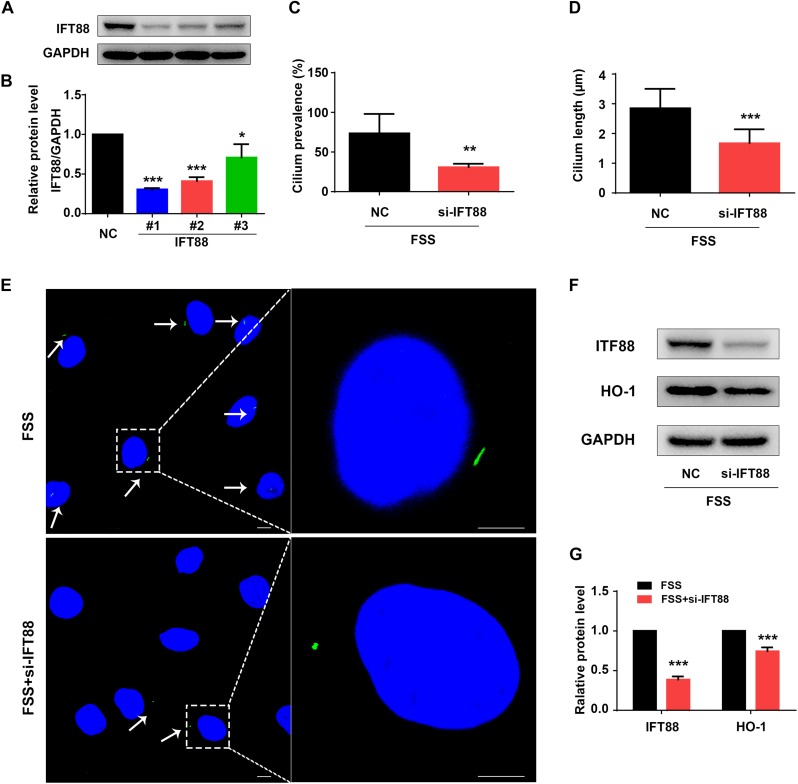
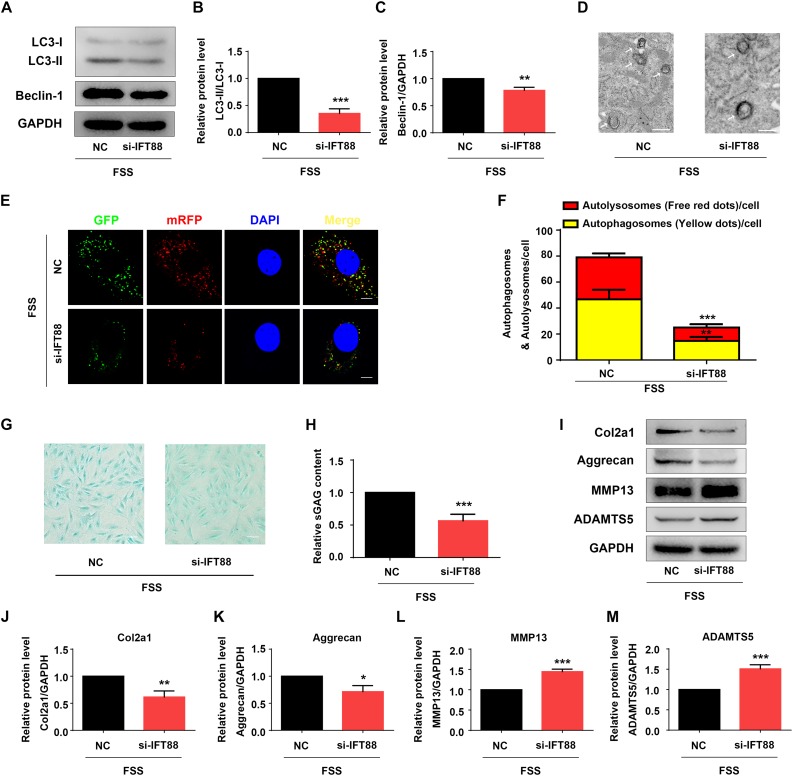
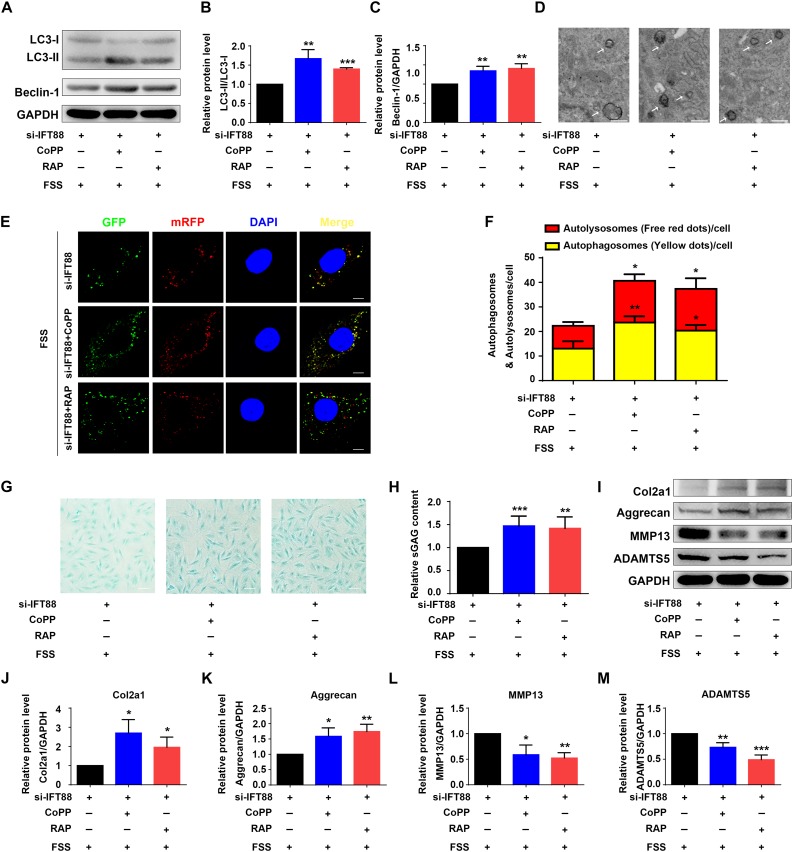
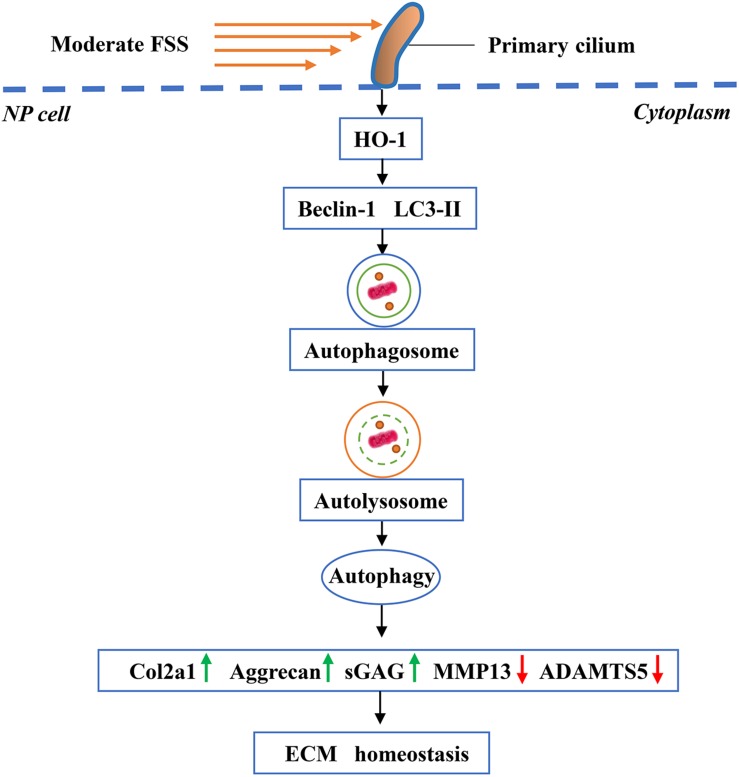
In vertebrate, the nucleus pulposus (NP), which is an essential component of the intervertebral disk, is constantly impacted by fluid shear stress (FSS); however, molecular mechanism(s) through which FSS modulates the NP homeostasis is poorly understood. Here we show that FSS regulates the extracellular matrix (ECM) homeostasis in NP cells. A moderate dose of FSS (i.e., 12 dyne/cm2) increases the sulfated glycosaminoglycan (sGAG) content and protein levels of Col2a1 and Aggrecan and decreases those of matrix metalloproteinase 13 (MMP13) and a disintegrin and metalloproteinase with thrombospondin motif 5 (ADMATS5) in rat NP cells, while a higher dose of FSS (i.e., 24 dyne/cm2) displays opposite effects. Results from RNA sequencing analysis, quantitative real-time RT-PCR analysis and western blotting establish that the heme oxygenase-1 (HO-1) is a key downstream mediator of the FSS actions in NP cells. HO-1 knockdown abolishes FSS-induced alterations in ECM protein production and sGAG content in NP cells, which is reversed by HO-1 induction. Furthermore, FSS activates the autophagic pathway by increasing the LC3-II/LC3-I ratio, Beclin-1 protein level, and formation of autophagosome and autolysosome and thereby regulates ECM protein and sGAG production in a HO-1 dependent manner. Finally, we demonstrate that the intraflagellar transport (IFT) 88, a core trafficking protein of primary cilia, is critically involved in the HO-1-mediated autophagy activation and ECM protein and sGAG production in FSS-treated NP cells. Thus, we for the first time demonstrate that FSS plays an important role in maintaining ECM homeostasis through HO-1-dependent activation of autophagy in NP cells.

Keywords: autophagy; fluid shear stress; heme oxygenase-1; intraflagellar transport (IFT) 88; nucleus pulposus cell.


Figures

FIGURE 1
FIGURE 1
Fluid shear stress regulates expression of ECM proteins and sGAG content in nucleus pulposus cells. (A) The formation of fluid shear stress (FSS) in nucleus pulposus cells (NP). Compressive stress (C), hydrostatic pressure (HP), and tensile stress (T) are indicated. (B) Schematic diagram of the Flexcell Streamer System. (C) Alcian blue staining. NP cells were treated with 12 dyne/cm2 FSS for the indicated times. Bar, 100 μm. (D) sGAG content. NP cells were treated as in panel (B), followed by the Blyscan Sulfated Glycosaminoglycan Assay. (E–I) Western blotting. NP cells were treated as in panel (C), followed by Western blotting analyses for expression of Col2a1, aggrecan, MMP13, and ADAMTS5. Quantitative data from three independent experiments (D,F–I). Results are expressed as mean ± standard deviation (s.d.). NS, no statistical significance, *P < 0.05, **P < 0.01, and ***P < 0.001 vs. un-treated group (0 h).
FIGURE 2
FIGURE 2
Heme oxygenase-1 regulates FSS-mediated ECM production in NP cells. (A) The heat map of RNA-seq data. NP cells were treated with or without 12 dyne/cm2 FSS for 2 h, followed by RNA-seq analysis as described in Materials and Methods. (B) Volcano plot of RNA-seq data. Blue arrow indicates heme oxygenase-1 (HO-1). (C) Quantitative real-time reverse transcriptase-polymerase chain reaction (qRT-PCR) analysis. NP cells were treated with or without 12 dyne/cm2 FSS for 2 h, followed by qRT-PCR analysis. (D,E) Western blotting. NP cells were treated as in panel (C), followed by western blotting. Quantitative data from three independent experiments (E). (F,G) Immunofluorescence (IF) staining. NP cells were treated as in panel (C), followed by IF staining (E). Bar, 50 μm. Quantitative data from three independent experiments (G). (H,I) HO-1 siRNA knockdown. NP cells were transfected with negative control siRNA (NC-siRNA) and three HO-1-siRNA (#1, #2, #3). Then, cells were subjected to western blotting for HO-1 (H). Quantitative data from three independent experiments (I). Note: #2 HO-1-siRNA showed the best knocking down effect and was used for all following experiments in this study. (J,K) Western blotting. NP cells were transfected with negative control siRNA (NC-siRNA) and HO-1-siRNA (#2). Then, cells were pretreated with or without HO-1 inducer cobalt protoporphyrin IX (CoPP) (10 μM) and subjected to 12 dyne/cm2 FSS for 2 h, followed by western blotting for HO-1 (J). Quantitative data from three independent experiments (K). (L,M) sGAG content. NP cells were treated as in panel (J), followed by alcian blue staining and Blyscan Sulfated Glycosaminoglycan Assay. Bar,100 μm. Quantitative data of sGAG content from three independent experiments (M). (N–R) Western blotting. NP cells were treated as in panel (J), followed by western blotting for expression of the indicated proteins. Quantitative data from three independent experiments (O–R). Results are expressed as mean ± standard deviation (s.d.). NS, no statistical significance, **P < 0.05, ***P < 0.001 vs. control, NC or FSS + NC-siRNA group; #P < 0.01 and ##P < 0.01 vs. FSS + HO-1-siRNA group.
FIGURE 3
FIGURE 3
HO-1 mediates FSS-induced autophagy in NP cells. (A–C) Western blotting. NP cells were treated with or without 12 dyne/cm2 FSS for 2 h, followed by western blotting for expression of the indicated proteins. Quantification of LC3-II/LC3-I ratio (B) and Beclin-1 (C). (D) Transmission Electron Microscopy (TEM). NP cells were treated as in panel (A). TEM images are shown. Arrows indicate double-membrane autophagosomes and autolysosomes at various stages. Bar, 500 nm. (E,F) Measurements of autophagosomes and autolysosomes. NP cells were infected with lentivirus expressing a tandem mRFP-GFP-LC3 construct and treated with or without 12 dyne/cm2 FSS for 2 h. Fluorescence images were obtained. Bar, 5 μm. Quantification of autophagosomes (yellow dots) and autolysosomes (free red dots) (F). (G–I) Western blotting. NP cells were first treated with and without HO-1 siRNA knockdown and in the presence and absence of CoPP. Then, cells were pretreated with or without HO-1 inducer cobalt protoporphyrin IX (CoPP) (10 μM) and subjected to 12 dyne/cm2 FSS for 2 h, followed by western blotting for expression of the indicated proteins. Quantification of LC3-II/LC3-I ratio and Beclin-1 from three independent experiments (H,I). (J) TEM. NP cells were treated as in panel (G). TEM images are shown. The arrows indicate double-membrane autophagosomes and autolysosomes. Bar, 500 nm. (K,L) Measurements of autophagosomes and autolysosomes. NP cells were transduced with lentivirus expressing a tandem mRFP-GFP-LC3 construct and treated as in panel (G). Fluorescence images were obtained. Bar, 5 μm. Quantification of autophagosomes (yellow dots) and autolysosomes (free red dots) from three independent experiments (L). *P < 0.05, **P < 0.01, and ***P < 0.001 vs. control; #P < 0.05 and ##P < 0.01 vs. FSS + HO-1-siRNA group.
FIGURE 4
FIGURE 4
Rapamycin regulates autophagy and ECM in NP cells. (A–C) Western blotting. NP cells were first transfected with HO-1 siRNA and treated with autophagy activator rapamycin (RAP, 500 nM) for 12 h. Cells were then treated with 12 dyne/cm2 FSS for 2 h, followed by western blotting for expression of the indicated proteins. Quantification of LC3-II/LC3-I ratio and Beclin-1 from three independent experiments (B,C). (D) Transmission Electron Microscopy (TEM). NP cells were treated as in panel (A). TEM images are shown. The arrows indicate double-membrane autophagosomes and autolysosomes. Bar, 500 nm. (E,F) Measurements of autophagosomes and autolysosomes. NP cells were transduced with lentivirus expressing a tandem mRFP-GFP-LC3 construct and treated as in panel (A). Fluorescence images were obtained. Bar, 5 μm. Quantification of autophagosomes (yellow dots) and autolysosomes (free red dots) from three independent experiments (F). (G,H) sGAG content. NP cells were treated as in panel (A), followed by alcian blue staining (G) and Blyscan Sulfated Glycosaminoglycan Assay (H). Bar, 100 μm. (I–M) Western blotting. NP cells were treated as in panel (A), followed by western blotting for expression of the indicated proteins (I). Quantification of Col2a1, aggrecan, MMP13 and ADAMTS5 from three independent experiments (J–M). Results are expressed as mean ± standard deviation (s.d.). *P < 0.05 and ***P < 0.001 vs. FSS + HO-1-siRNA group.
FIGURE 5
FIGURE 5
Knockdown of IFT88 impairs cilium function and decreases expression of HO-1 in FSS-treated NP cells. (A) IFT88 Knockdown. NP cells were transfected with negative control siRNA (NC-siRNA) and three different IFT88-siRNA (#1, #2, #3). Then, cells were subjected to western blotting for expression of IFT88 (A). Quantitative data from three independent experiments (B). The #1 IFT88-siRNA was used for the following experiments in this study. (C,D) Qualification of cilium prevalence (C) and cilium length (D) in NP cells from three independent experiments. NP cells were transfected with negative control siRNA (NC-siRNA) and IFT88 siRNA. Then, cells were treated with 12 dyne/cm2 FSS for 2 h. (E) Fluorescence images of primary cilia. Left bar, 10 μm; right bar, 5 μm. White arrows represent primary cilia. (F,G) Western blotting. NP cells were transfected with NC-siRNA or IFT88-siRNA (#1) and subjected to 12 dyne/cm2 FSS for 2 h, followed by western blotting for expression of IFT88 and HO-1 (F). Quantification of data from three independent experiments (G). Results are expressed as mean ± standard deviation (s.d.). *P < 0.05, **P < 0.01, and ***P < 0.001 vs. NC or FSS + NC-siRNA group).
FIGURE 6
FIGURE 6
IFT88 loss reduces autophagy and impairs ECM homeostasis in FSS-treated NP cells. (A–C) Western blotting. NP cells were transfected with negative control siRNA (NC-siRNA) or IFT88-siRNA (#1). Then, cells were subjected to 12 dyne/cm2 FSS for 2 h, followed by western blotting for expression of LC3-I, LC3-II, and Beclin-1 (A). Quantification of LC3-I/LC3-II ratio and Beclin-1 from three independent experiments (B,C). (D) Transmission Electron Microscopy (TEM). NP cells were treated as in PANEL (A). TEM images are shown. The arrows indicate double-membrane autophagosomes and autolysosomes. Bar, 500 nm. (E,F) Measurements of autophagosomes and autolysosomes. NP cells were transduced with lentivirus expressing a tandem mRFP-GFP-LC3 construct and treated as in panel (A). Fluorescence images were obtained. Bar, 5 μm. Quantification of autophagosomes (yellow dots) and autolysosomes (free red dots) from three independent experiments (F). (G,H) sGAG content. NP cells were treated as in panel (A), followed by alcian blue staining (G) and Blyscan Sulfated Glycosaminoglycan Assay (H). Bar, 100 μm. (I–M) Western blotting. NP cells were treated as in panel (A), followed by western blotting for expression of the indicated proteins (I). Quantification of expression of Col2a1, aggrecan, MMP13 and ADAMTS5 from three independent experiments (J–M). Results are expressed as mean ± standard deviation (s.d.). *P < 0.05, **P < 0.01, and ***P < 0.001 vs. FSS + NC-siRNA group.
FIGURE 7
FIGURE 7
HO-1 upregulation or rapamycin reverses IFT88 loss-induced alterations in autophagy and ECM production in FSS-treated NP cells. (A–C) Western blotting. NP cells were transfected with IFT88-siRNA. Then, cells were pretreated with CoPP (10 μM) or rapamycin (RAP, 500 nM) and subjected to 12 dyne/cm2 FSS for 2 h, followed by western blotting for expression of LC3-I, LC3-II, and Beclin-1 (A). Quantification of LC3-I/LC3-II ratio and Beclin-1 from three independent experiments (B,C). (D) Transmission Electron Microscopy (TEM). NP cells were treated as in panel (A). TEM images are shown. The arrows indicate double-membrane autophagosomes and autolysosomes. Bar, 500 nm. (E,F) Measurements of autophagosomes and autolysosomes. NP cells were transduced with lentivirus expressing a tandem mRFP-GFP-LC3 construct and treated as in panel (A). Fluorescence images were obtained. Bar, 5 μm. Quantification of autophagosomes (yellow dots) and autolysosomes (free red dots) from three independent experiments (F). (G,H) sGAG content. NP cells were treated as in panel (A), followed by alcian blue staining (G) and Blyscan Sulfated Glycosaminoglycan Assay (H). Bar, 100 μm. (I–M) Western blotting. NP cells were treated as in panel (A), followed by western blotting for expression of the indicated proteins (I). Quantification of expression of Col2a1, aggrecan, MMP13 and ADAMTS5 from three independent experiments (J–M). Results are expressed as mean ± standard deviation (s.d). *P < 0.05, **P < 0.01, and ***P < 0.001 vs. FSS + IFT88-siRNA group.
FIGURE 8
FIGURE 8
Working model. Primary cilia sense and transmit extracellular FSS signal to NP cells, which activates HO-1 and thereby autophagy. Increased autophagy plays an important role in maintaining ECM homeostasis in NP cells.

Similar articles

Cited by

References

    1. An Q. D., Li Y. Y., Zhang H. X., Lu J., Yu X. D., Lin Q., et al. (2018). Inhibition of bromodomain-containing protein 4 ameliorates oxidative stress-mediated apoptosis and cartilage matrix degeneration through activation of NF-E2-related factor 2-heme oxygenase-1 signaling in rat chondrocytes. J. Cell Biochem. 119 7719–7728. 10.1002/jcb.27122 - DOI - PubMed
    1. Anvarian Z., Mykytyn K., Mukhopadhyay S., Pedersen L. B., Christensen S. T. (2019). Cellular signalling by primary cilia in development, organ function and disease. Nat. Rev. Nephrol. 15 199–219. 10.1038/s41581-019-0116-9 - DOI - PMC - PubMed
    1. Bonnevie E. D., Gullbrand S. E., Ashinsky B. G., Tsinman T. K., Elliott D. M., Chao P. G., et al. (2019). Aberrant mechanosensing in injured intervertebral discs as a result of boundary-constraint disruption and residual-strain loss. Nat. Biomed. Eng. 3 998–1008. 10.1038/s41551-019-0458-4 - DOI - PMC - PubMed
    1. Cao H., Yan Q., Wang D., Lai Y., Zhou B., Zhang Q., et al. (2020). Focal adhesion protein Kindlin-2 regulates bone homeostasis in mice. Bone Res. 8:2. 10.1038/s41413-019-0073-8 - DOI - PMC - PubMed
    1. Cao H., Yu S., Yao Z., Galson D. L., Jiang Y., Zhang X., et al. (2010). Activating transcription factor 4 regulates osteoclast differentiation in mice. J. Clin. Invest. 120 2755–2766. 10.1172/JCI42106 - DOI - PMC - PubMed