. 2020 Jun 4;48(10):e55.
doi: 10.1093/nar/gkaa183.

SingleCellSignalR: inference of intercellular networks from single-cell transcriptomics

Affiliations

SingleCellSignalR: inference of intercellular networks from single-cell transcriptomics

Simon Cabello-Aguilar et al. Nucleic Acids Res. .

Abstract

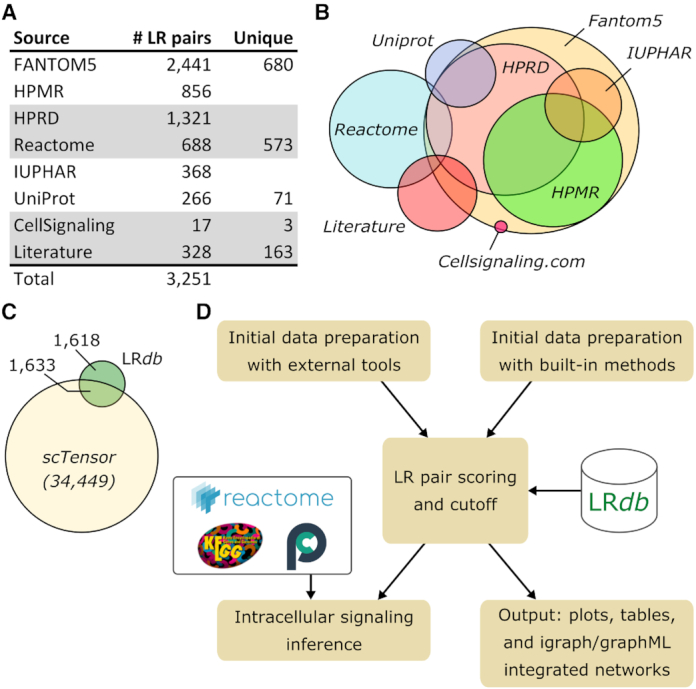
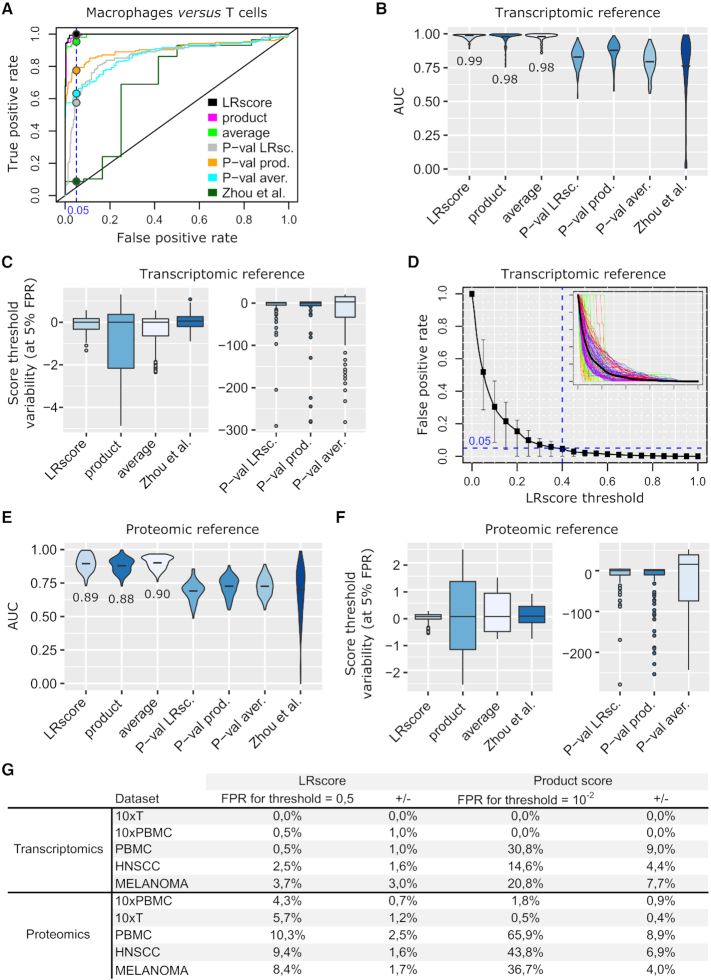
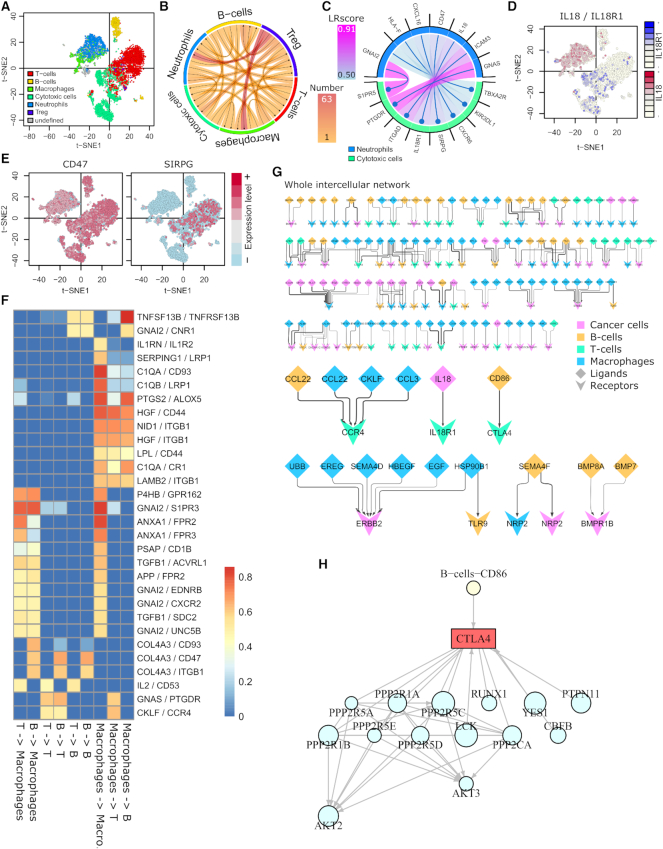
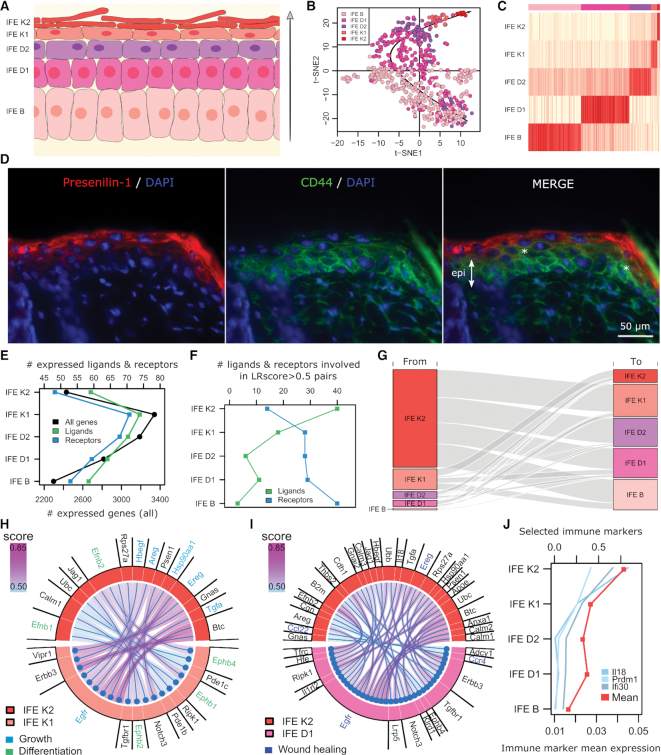
Single-cell transcriptomics offers unprecedented opportunities to infer the ligand-receptor (LR) interactions underlying cellular networks. We introduce a new, curated LR database and a novel regularized score to perform such inferences. For the first time, we try to assess the confidence in predicted LR interactions and show that our regularized score outperforms other scoring schemes while controlling false positives. SingleCellSignalR is implemented as an open-access R package accessible to entry-level users and available from https://github.com/SCA-IRCM. Analysis results come in a variety of tabular and graphical formats. For instance, we provide a unique network view integrating all the intercellular interactions, and a function relating receptors to expressed intracellular pathways. A detailed comparison of related tools is conducted. Among various examples, we demonstrate SingleCellSignalR on mouse epidermis data and discover an oriented communication structure from external to basal layers.


Figures

Figure 1.
Figure 1.
SingleCellSignalR databases and workflow. (A) LRdb sources. (B) Approximate overlap of sources. (C) Overlap (50.2%) of LRdb with an example of LRdb derived from STRING (here the database of scTensor). (D) SingleCellSignalR general workflow with input transcript expression matrix both normalized and clustered by either independent tools or by SingleCellSignalR basic built-in algorithms.
Figure 2.
Figure 2.
Statistical analysis. (A) Representative ROC curve. (B) AUCs over all the ROC curves of the five datasets; transcriptomics reference. (C) Relative variability (with respect to the median value) of the thresholds required to achieve 5% FPs in each ROC curve (all couples of cell types, all the datasets). (D) FP rate upon various LRscore thresholds. A small box plot is featured for each threshold value and the figure inset shows all the ROC curves. LRscore threshold (blue dashed line) such that 75% of the ROC curves would yield FPs below 5%. (E andF) Same as B and C, but for the proteomics reference. (G) FP rates (±sd) on each dataset against the transcriptomic and the proteomic references when imposing a consensus LRscore threshold of 0.5. Same results for an equivalent product score threshold consensus in the two right-most columns.
Figure 3.
Figure 3.
Graphical representations. (A) 10×PBMC data with SIMLR clusters. (B) Summary chord diagram of the paracrine interactions; largest number of interactions from regulatory T cells toward macrophages and neutrophils. (C) Paracrine interactions from neutrophils toward cytotoxic cells. (D andE) Joined, and separated expression plots over the t-SNE map to assess LR interaction specificity and prevalence. (F) Integrated tabular view of the formula image most variable LR pairs with LRscore > 0.5 in one cell-type couple at least. (G) Integrated network of MELANOMA data patient 89 intercellular interactions. Overview and chosen interactions. The full network is in Supplementary Figure S13. (H) Example of intracellular signaling downstream CTLA-4 in T cells. Node sizes represent the gene expression level (arbitrary scale).
Figure 4.
Figure 4.
Mouse IFE. (A) Schematics of the IFE (arrow = axis of differentiation). (B) t-SNE plot of the IFE cells with the underlying black arrow representing the axis of differentiation. Some incompletely differentiated non IFE B cells lie among the IFE B subpopulation. (C) Cell type calling with actual subpopulations in the top color band. (D) Presenilin-1 (left panel) and CD44 (middle panel) immunostainings of mouse skin sections. Sections were counterstained with DAPI (epi = epidermis, * = co-localization). (E) Number of genes with average expression different from 0 in each IFE layer. (F) Number of ligands and receptors involved in LRscore > 0.5 interactions. (G) Flow diagram representing the number of interactions between the cell subpopulations. (H andI) Chord diagrams of adjacent and remote IFE K2 cell–cell interactions. (J) Immune marker gene expression. Il18 is expressed by macrophages, Ifi30 by antigen-presenting cells and Prdm1 by T cells (genecards.org).

References

    1. Potente M., Gerhardt H., Carmeliet P.. Basic and therapeutic aspects of angiogenesis. Cell. 2011; 146:873–887. - PubMed
    1. Kopan R., Ilagan M.X.G.. The canonical notch signaling pathway: unfolding the activation mechanism. Cell. 2009; 137:216–233. - PMC - PubMed
    1. Orkin S.H., Zon L.I.. Hematopoiesis: an evolving paradigm for stem cell biology. Cell. 2008; 132:631–644. - PMC - PubMed
    1. Batlle E., Henderson J.T., Beghtel H., van den Born M.M., Sancho E., Huls G., Meeldijk J., Robertson J., van de Wetering M., Pawson T. et al.. Beta-catenin and TCF mediate cell positioning in the intestinal epithelium by controlling the expression of EphB/ephrinB. Cell. 2002; 111:251–263. - PubMed
    1. Gorelik L., Flavell R.A.. Abrogation of TGFbeta signaling in T cells leads to spontaneous T cell differentiation and autoimmune disease. Immunity. 2000; 12:171–181. - PubMed

Publication types