Review
. 2020 May;9(9):e1901058.
doi: 10.1002/adhm.201901058. Epub 2020 Mar 20.

Magnetic Nanoparticles in Cancer Therapy and Diagnosis

Affiliations
Review

Magnetic Nanoparticles in Cancer Therapy and Diagnosis

Ali Farzin et al. Adv Healthc Mater. 2020 May.

Abstract

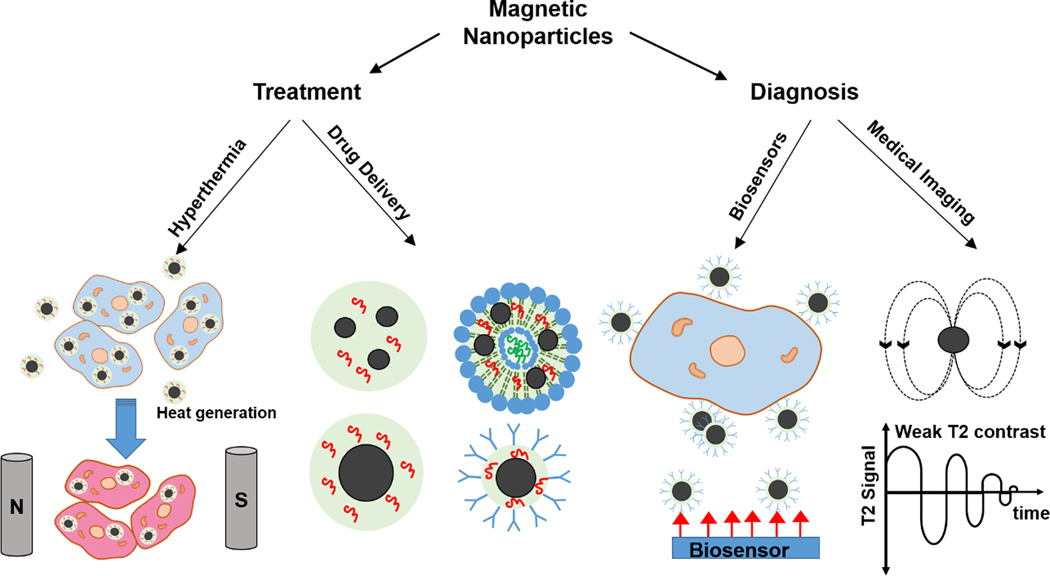
There is urgency for the development of nanomaterials that can meet emerging biomedical needs. Magnetic nanoparticles (MNPs) offer high magnetic moments and surface-area-to-volume ratios that make them attractive for hyperthermia therapy of cancer and targeted drug delivery. Additionally, they can function as contrast agents for magnetic resonance imaging (MRI) and can improve the sensitivity of biosensors and diagnostic tools. Recent advancements in nanotechnology have resulted in the realization of the next generation of MNPs suitable for these and other biomedical applications. This review discusses methods utilized for the fabrication and engineering of MNPs. Recent progress in the use of MNPs for hyperthermia therapy, controlling drug release, MRI, and biosensing is also critically reviewed. Finally, challenges in the field and potential opportunities for the use of MNPs toward improving their properties are discussed.

Keywords: cancer detection; cancer therapy; drug delivery; hyperthermia; magnetic nanoparticles.


Figures

Figure 1.
Figure 1.
Different forms of the MNPs with considerable potential in hyperthermia, drug delivery, imaging, and biosensing for cancer treatment and diagnosis.
Figure 2.
Figure 2.
Schematic drawing of (a) a hysteresis loop of a ferromagnetic material and (b) typical plot of a superparamagnetic material.
Figure 3:
Figure 3:
Schematic representation of the EPR effect in normal and cancer tissue.
Figure 4:
Figure 4:
Multifunctional MNPs in cancer therapy and diagnosis.
Figure 5.
Figure 5.
(a) Schematic illustrations of NPC inhibiting tumor cell invasion. Different elements of NPC are stuck to the surface of glioma cells and the effect of NPCs on cell morphology; Reproduced with permission from Veiseh et al. [146] Copyright (2009) Wiley-VCH. (b) Schematic representation of different nano-systems for application in thermo-chemotherapy.
Figure 6.
Figure 6.
(a) TEM image of DOX loaded NPs modified with PEG and LHRH peptide. (b) Release curve of DOX from iron oxide- DOX-PEG-LHRH nano-system incubated at 37˚C at different pH levels. (c) The dynamic temperature profile of the synthesized core/shell system under AMF (33.5 kA/m and 393 kHz). (d) Viability of A2780/AD ovarian cancer cells after curing with the following: (1) control (no treatment), (2) exposed only to AMF, (3) including only synthesized core/shell nano-system, (4) 44˚C hyperthermia for 30 min: incubation of cells with IONPs-PEG-LHRH nano-system and exposure to AMF (33.5 kA/m and398 kHz), (5) 40˚C hyperthermia for 30 min: incubation of cells with IONPs-PEG-LHRH nano-system and exposure to AMF (21.2 kA/m and 393 kHz), (6) chemotherapy: cells treatment with IONPS-DOX-PEG-LHRH, and (7) combinatorial treatment: chemotherapy and hyperthermia (40˚C for 30 min). (a-d) Reprinted with permission from Taratula et al. [37] Copyright (2013) Elsevier.
Figure 7.
Figure 7.
(a) Schematic representation of drug release from liposomes with hydrophobic MNPs in lipid bilayer. (b) The release rate of calcein-loaded magnetoliposomes vs. time over three successive on/off cycles under external AMF at room temperature (Reprinted with permission from Qiu et al. [167] Copyright (2013) Elsevier). (c) Topographic atomic force microscope image from the loaded micelles with magnetic iron oxide. (d) A TEM image of synthesized micelles. (e) DOX cumulative drug release vs. temperature from synthesized micelles in a hot water bath and magnetically induced heating. (c-e) Reprinted with permission from Kim et al. [39] Copyright (2013) American Chemical Society.
Figure 8.
Figure 8.
(a) Various properties of MNPs affecting the r2/r1 ratio and consequently on MR image contrast. (b) Magnetization curve of magnetic IONPs of different diameters (1.5, 2.2, 3 and 12nm). (c) A schematic of the spin canting effect of different sizes of IONPs. Red and black colors correspond to the magnetic core and disorder shell, respectively. (d) MR images from a rat after injection of IONPs at various time periods. (b-d) Reprinted with permission from Kim et al. [200] Copyright (2011) American Chemical Society.
Figure 9.
Figure 9.
(a) Schematic representation of spin canted phenomena in small-sized GdIO and IO NPs. Embedding Gd in IONPs increases the thickness of the spin canted layer and this phenomenon improves T1 MR image contrast and brightness. Adapted with permission from Zhou et al. [41] Copyright (2013) American Chemical Society. (b) In vivo T1-weighted MR images of mice after injection GdIO NPs with a dose of 2.0 mg GdIO NPs per kg of mice at different time points. Blue arrows, red dot, and red dashed squares correspond to heart, Bladder, and kidney, respectively. Reprinted with permission from Zhou et al. [41] Copyright (2013) American Chemical Society.
Figure 10.
Figure 10.
(a) In vivo MR images from a mouse body after injection of MSNs-IONPs. (b) DOX drug release from MSNs-iron oxide pH-responsive carrier systems at different pH values. (c) In vivo MR images from a mouse body after injection of MSNs-DOX-IONPs. (a-c) Reprinted with permission from Wu et al. [204] Copyright (2014) Wiley-VCH 2014.
Figure 11.
Figure 11.
(a) TEM images from single and clustered SPIONs reveal that dynamic diameter is (i) 51 nm, (ii) 70 nm, (iii) 79 nm, and (iv) 141 nm. (b) DLS volume distributions of PEI-b-PCL-b-PEG micelles with 9.8 nm superparamagnetic iron oxide (SPIO) crystals. Volume distribution of a series of different sized micelles with 9.8 nm SPION shows the average hydrodynamic of different micelles can be assumed between 51 and 141 nm. (c) The r2 relaxivities of single and clustered IONPs versus the hydrodynamic diameters. The organic layer of the SPIO nanocrystals with a measured thickness of 0.25 nm (_ _), 0.5 nm (- - -), 1 nm (____), 2 nm (. . .), and 5 nm (−..-). (a-c) Reprinted with permission from Pöselt et al. [214] Copyright (2012) American Chemical Society.
Figure 12.
Figure 12.
(a) Schematic presentation of the ability of T1 and T2-weighted MR image contrast agents. (b) Schematic illustration of synthesized GMNPs. (c) A TEM image of synthesized gadolinium-labeled MNPs. (d) T1-weighted and (e) T2 –weighted MR images after injecting Feridex (orange arrows) and Magnevist (green arrows). (f) T1-weighted and (g) T2 –weighted MRI of a mouse following the injection of synthesized GMNPs (the injection site is remarked by blue arrows). (c-g) Reprinted with permission from Bae et al. [239]. Copyright (2010) American Chemical Society.
Figure 13.
Figure 13.
(a) Schematic of embedded T1 MRI contrast agent inside T2 MRI contrast NP. (b) A TEM image of synthesized Gd2O3 (as T1 contrast agent) inside the IONP. (c) T1-weighted and (d) T2-weighted in-vivo MR images before and after injection of synthesized GdIOs NPs inside a BALB/c mouse (top: coronal plane, bottom: transverse plane). (e) T1-weighted and (f) T2-weighted in-vivo MR images by injection of synthesized GdIOs NPs inside nude mice. Grey arrows: gallbladder, black arrows: liver, white dotted circles and white arrows: liver tumor. (a-f) Reprinted with permission from Zhou et al. [42] Copyright (2012) Wiley-VCH.
Figure 14.
Figure 14.
(a) Schematic illustration of synthesized *As-SPIONs as dual MRI/PET contrast agents. In vivo PET images of BALB/c mice following injecting (b) free *As, (c) As- SPION@ PEG, and (d) *As-SPIONs. (e) In vivo T2*-weighted MR images from mice before and after injection of radiolabeled As SPION. (a-e) Reprinted with permission from Chen et al. [247] Copyright (2013) Wiley-VCH.
Figure 15.
Figure 15.
(a) Schematic illustration of a DMR system with higher sensitivity developed by Lee et al.[11a] (b) The modification of the old planar micro-coil system by solenoidal coil embedded in a microfluidic system results in a 350% improvement in signal level. (c) Changes of r2 = 1/T2 by using BT474 cells (human breast tumor cells) labeled with CLIO NPs and developed MnFe2O4 NPs. Results show × 10 better detection sensitivity by using MnFe2O4 NPs. (d) Using MnFe2O4 NPs in DMR system enhanced sensitivity detection to a single-cell level (~2 cells). This developed DMR system has excellent properties compared to older ones such as cytology and histology. (a-d) Reprinted with permission from Lee et al. [11a] Copyright (2009) United States National Academy of Sciences.

References

    1. Saghazadeh S, Rinoldi C, Schot M, Kashaf SS, Sharifi F, Jalilian E, Nuutila K, Giatsidis G, Mostafalu P, Derakhshandeh H, Adv. Drug Deliv.Rev. 2018, 127, 138; - PMC - PubMed
    2. Elkhoury K, Russell CS, Sanchez-Gonzalez L, Mostafavi A, Williams TJ, Kahn C, Peppas NA, Arab-Tehrany E, Tamayol A, Adv. Healthc. Mater. 2019, 8, 1900506. - PMC - PubMed
    1. Besenhard MO, Baber R, LaGrow AP, Mazzei L, Thanh NT, Gavriilidis A, Cryst. Eng. Comm. 2018, 20, 7082;
    2. Zhou X.-x., Liu J.-f., Jiang G.-b., Environ. Sci. Technol. 2017, 51, 3892. - PubMed
    1. Farzin A, Ahmadian M, Fathi M, Mater. Sci. Eng. C 2013, 33, 2251. - PubMed
    1. Tong R, Langer R, Cancer J. 2015, 21, 314. - PubMed
    1. Choi CHJ, Zuckerman JE, Webster P, Davis ME, Proc. Natl. Acad. Sci. 2011, 108, 6656. - PMC - PubMed

Publication types