

Uranium-Platinum System
- PMID: 32196149
- PMCID: PMC5287019
- DOI: 10.6028/jres.064A.009
Uranium-Platinum System
Abstract
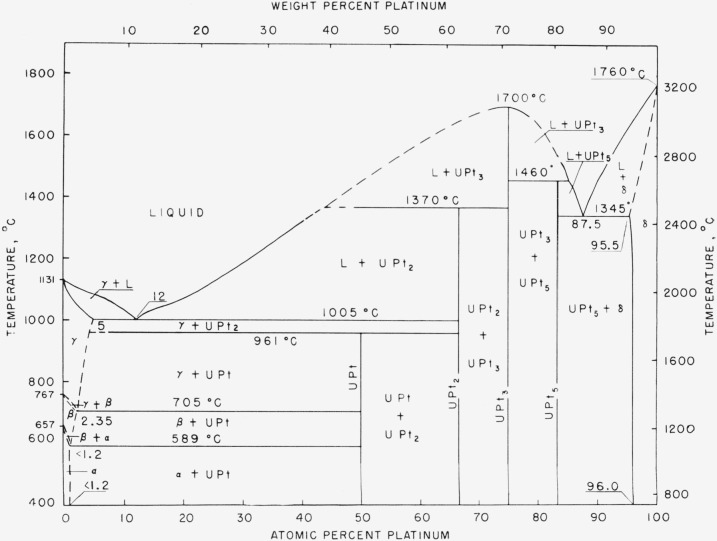
The phase diagram of the uranium-platinum system was constructed from data obtained by thermal analysis, metallographic examination, and X-ray diffraction. The system is characterized by four intermetallic compounds: UPt, formed peritectoidally at 961° C; UPt2, formed peritectically at 1,370° C; UPt3, melting congruently at 1,700° C; and UPt5, formed peritectically at 1,460° C. One eutectic occurs at 1,005° C and 12 a/o platinum, and a second at 1,345° C and 87.5 a/o platinum. The maximum solubilities are 4.5 a/o uranium in platinum and 5 a/o platinum in gamma-uranium. Platinum lowers the gamma-beta uranium transformation to 705° C and the beta-alpha transformation to 589° C.
Figures

Alloy of 5.0 a/o platinum, quenched from 720° C, UPt in uranium matrix. × 500.
Alloy of 2.35 a/o platinum, after thermal analysis, UPt in uranium matrix. × 1000.
Alloy of 2.35 a/o platinum, quenched from 700° C, UPt in uranium matrix. × 200.
Alloy of 1.2 a/o platinum, quenched from 590° C, UPt in uranium matrix. × 100.
Alloy of 1.2 a/o platinum, quenched from 600° C, uranium solid solution. × 500.
Alloy of 0.9 a/o platinum, homogenized, uranium solid solution. × 100.
Alloy of 1.2 a/o platinum, after thermal analysis, UPt in uranium matrix. Polarized light. × 100.
Alloy of 49.8 a/o platinum, uranium in UPt matrix. × 200.


Alloy of 66.7 a/o platinum, UPt2 phase. × 100.
Alloy of 74.6 a/o platinum, UPt3 phase. Polarized light, × 500.
Alloy of 82.8 a/o platinum, UPt3 in a matrix of UPt5. × 500.
Alloy of 96.4 a/o platinum, platinum terminal solid solution. × 250.
References
-
-
R.W. Buzzard (informal communication).
-
-
- Buzzard RW, Cleaves HE. J Met and Ceram (TID65) 1948;1:43.
-
- Saller HA, Rough FA. Battelle Memorial Inst. 1955 BMI–1000.
-
- Heal TJ, Williams GI. Acta Cryst. 1955;8:494.
-
- Buzzard RW, Liss RB, Fickle DP. J Research NBS. 1953;50:209. RP2412.
LinkOut - more resources
Full Text Sources