. 2020 Mar 20;16(3):e1008650.
doi: 10.1371/journal.pgen.1008650. eCollection 2020 Mar.

GLP-1 Notch-LAG-1 CSL control of the germline stem cell fate is mediated by transcriptional targets lst-1 and sygl-1

Affiliations

GLP-1 Notch-LAG-1 CSL control of the germline stem cell fate is mediated by transcriptional targets lst-1 and sygl-1

Jian Chen et al. PLoS Genet. .

Abstract

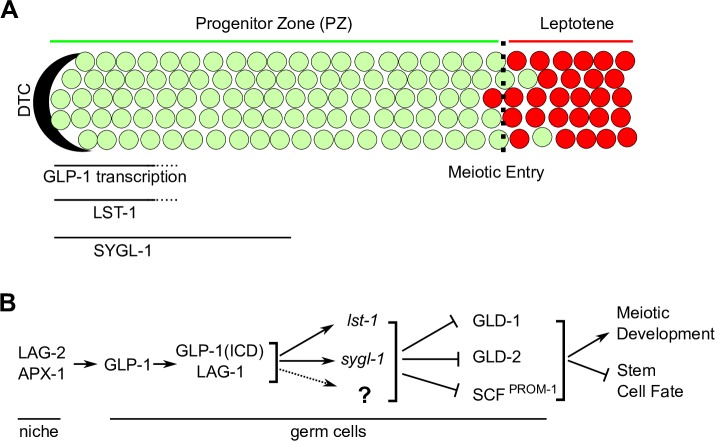
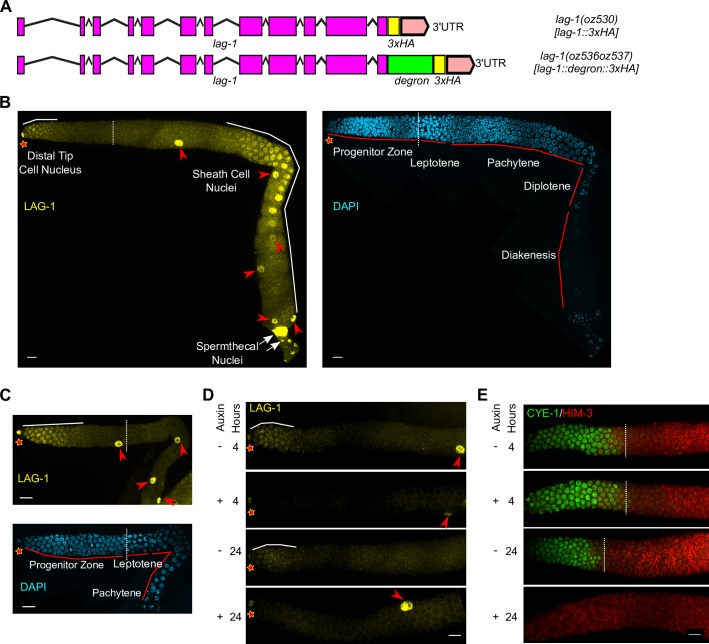
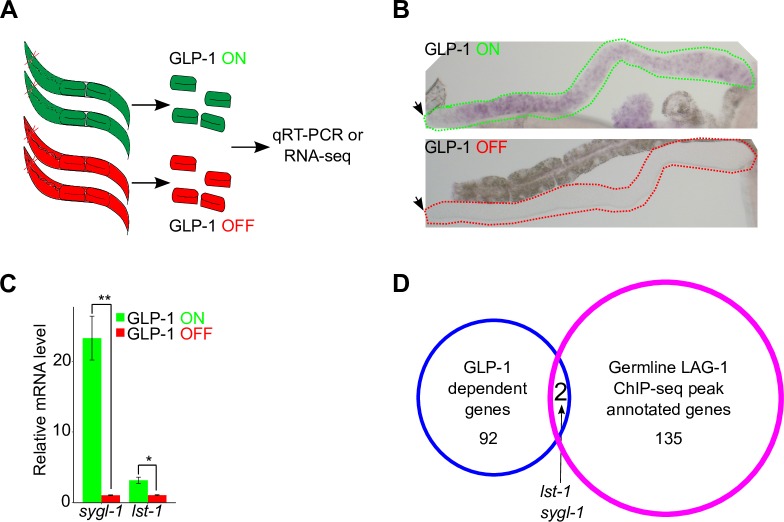
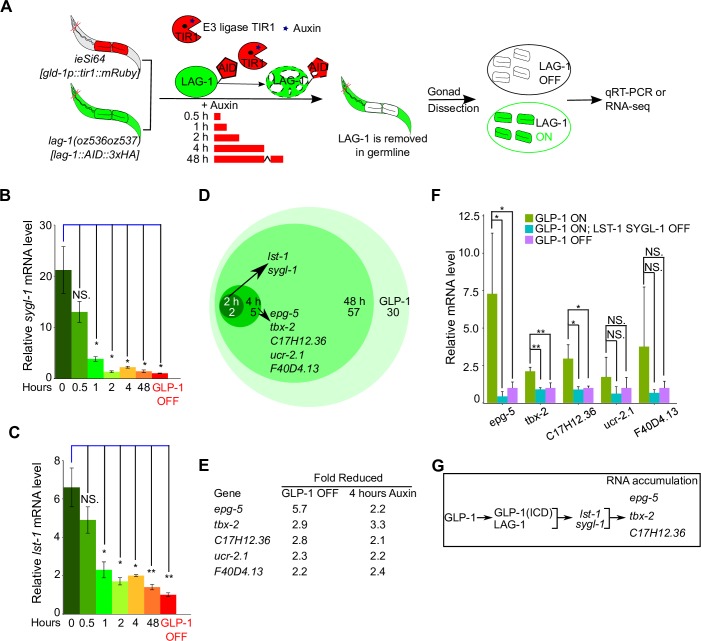
Stem cell systems are essential for the development and maintenance of polarized tissues. Intercellular signaling pathways control stem cell systems, where niche cells signal stem cells to maintain the stem cell fate/self-renewal and inhibit differentiation. In the C. elegans germline, GLP-1 Notch signaling specifies the stem cell fate, employing the sequence-specific DNA binding protein LAG-1 to implement the transcriptional response. We undertook a comprehensive genome-wide approach to identify transcriptional targets of GLP-1 signaling. We expected primary response target genes to be evident at the intersection of genes identified as directly bound by LAG-1, from ChIP-seq experiments, with genes identified as requiring GLP-1 signaling for RNA accumulation, from RNA-seq analysis. Furthermore, we performed a time-course transcriptomics analysis following auxin inducible degradation of LAG-1 to distinguish between genes whose RNA level was a primary or secondary response of GLP-1 signaling. Surprisingly, only lst-1 and sygl-1, the two known target genes of GLP-1 in the germline, fulfilled these criteria, indicating that these two genes are the primary response targets of GLP-1 Notch and may be the sole germline GLP-1 signaling protein-coding transcriptional targets for mediating the stem cell fate. In addition, three secondary response genes were identified based on their timing following loss of LAG-1, their lack of a LAG-1 ChIP-seq peak and that their glp-1 dependent mRNA accumulation could be explained by a requirement for lst-1 and sygl-1 activity. Moreover, our analysis also suggests that the function of the primary response genes lst-1 and sygl-1 can account for the glp-1 dependent peak protein accumulation of FBF-2, which promotes the stem cell fate and, in part, for the spatial restriction of elevated LAG-1 accumulation to the stem cell region.


Conflict of interest statement

The authors have declared that no competing interests exist.

Figures

Fig 1
Fig 1. Overview of GLP-1 signaling in the distal germline of C. elegans.
(A) Schematic of the adult hermaphrodite distal germline. The distal end of the germline is capped by a somatic distal tip cell (DTC). Progenitor zone cells are shown in green; meiotic prophase cells are in red. Dashed line indicates the progenitor zone–meiotic prophase boundary, the operationally defined point of meiotic entry [4]. GLP-1 signaling maintains germline stem cell fate and GLP-1 mediated transcription occurs in the distal most ~5 cell diameters (cd) of the germline [21,42]. LST-1 and SYGL-1 protein are observed in the distal most 5 or 10 cell diameters, respectively [22]. (B) Genetic pathway controlling the stem cell fate vs meiotic development decision in the distal end of C. elegans germline. GLP-1 signaling acts, at least in part, through transcriptional targets lst-1 and sygl-1 to repress the GLD-1, GLD-2 and SCFPROM-1 meiotic entry pathways (reviewed in [4]). GLP-1(ICD), GLP-1 intracellular domain.
Fig 2
Fig 2. LAG-1 spatial accumulation and germline autonomous function to promote the stem cell fate.
(A) Diagrams of tagged endogenous lag-1 alleles, lag-1(oz530[lag-1::3xHA]) (top) and lag-1(oz536oz537[lag-1::degron::3xHA]) (bottom). Purple boxes, exons; lines, introns; pink boxes, untranslated region; yellow boxes, 3xHA; green box, degron. (B & C) Images of HA-stained (LAG-1, yellow) germlines from dissected hermaphrodite gonads, co-stained with DAPI (cyan) for (B) 1-day adult and (C) mid-L4 stage. (D & E) Images of (D) HA-stained (LAG-1, yellow) and (E) CYE-1 (green), HIM-3-stained (red) germlines from dissected hermaphrodites. L4 stage animals with the following genotype lag-1(oz536oz537[lag-1::degron::3xHA]); ieSi64[gld-1p::TIR1::mRuby::gld-1 3'UTR] were treated with or without auxin for 4 hours (top two panels) or 24 hours (bottom two panels). Note that depending on the orientation of the gonad when mounted for microscopy, two, one or zero distal sheath cell nuclei are visible in the surface views of the germline shown in the photographs. Star, distal end; dashed lines, position of meiotic entry; solid white lines, position of LAG-1 accumulation; red arrowheads, sheath cell nuclei; white arrows, spermatheca nuclei. Scale bar is 10 μm.
Fig 3
Fig 3. Post-transcriptional regulation of LAG-1 by GLP-1 signaling.
(A) Images of HA-stained (LAG-1, yellow) germlines from dissected L4 hermaphrodites of the indicated genotype. See S1 Table for the complete genotypes. Star, distal end; dashed white lines, meiotic entry. Scale bar is 10 μm. (B—D) Plot of LAG-1 levels (B—C) and comparison of LAG-1 peak accumulation (D) for indicated genotype. lag-1(oz530[lag-1::3xHA]) is used for quantitation. Numbers indicate mean values of LAG-1 level for each genotype (in blue) and numbers in bracket shows the sample size. Dots, mean (B-C) or data points (D); Error bars, mean ± standard deviation (SD hereafter). P-value ≤ 0.01 (*); ≤ 0.001 (**); ≤ 0.0001 (***); > 0.01 non-significant (NS.). (E) Model depicting genetic control of peak accumulation for LAG-1 and percent contribution to peak LAG-1 accumulation. Sixty one percent of LAG-1 peak level is attributed to GLP-1 signaling, in which GLP-1 transcriptional targets lst-1 and sygl-1 account for 31% of LAG-1 peak level.
Fig 4
Fig 4. Genome-wide identification of germline-specific LAG-1 targets by sequential ChIP-seq.
(A) Schematic showing BirA specifically expressed in the germline (in green) biotinylating LAG-1 containing the BioTag. The strain harbored two transgenes, i) ckSi11[pie-1p::BirA::gfp], where biotin ligase BirA was driven by germline specific promoter pie-1, and ii) ozIs43[lag-1p::lag-1::3xFLAG::BioTag], see S1 Table. (B) The workflow of sequential ChIP-seq. Direct ChIP was not feasible due to the interference by high levels of endogeneous biotinylated proteins [53,54]. Sequential ChIP-seq was developed to overcome this issue and to facilitate DNA library preparation from ultra-low amount of DNA. (C) Genome browser tracks for sygl-1, lst-1 and mir-61/250 after sequential ChIP-seq. The raw reads were normalized to the control, and the signals are presented as log2-fold change after normalization. Black arrows, canonical LAG-1/CSL binding motif GTGGGAA [16,18,19]. See S4 Table. (D) Venn diagram showing 137 genes were overlapped from three biological replicates of germline LAG-1 ChIP-seq analyses. Rep, replicate. (E) The over-represented motif discovered by HOMER suite with germline specific ChIP-seq data (top) and the reported canonical LAG-1/CSL binding motif (bottom) [16,18,19].
Fig 5
Fig 5. Genome-wide identification of GLP-1-dependent genes by transcriptomic analysis.
(A) Schematic showing harvesting of dissected gonads, with tumorous germlines, for either qRT-PCR analysis or transcriptomic analysis. The genotype for GLP-1 ON animal (green) is gld-2(q497) gld-1(q485); glp-1(ar202) and GLP-1 OFF (red) animal is gld-2(q497) gld-1(q485); glp-1(q175). (B) In situ hybridization (ISH) used to detect sygl-1 mRNA expression in GLP-1 ON and GLP-1 OFF young adult animals. Dotted lines showing boundary of the gonad. Black arrow indicates distal end of the germline. (C) sygl-1 and lst-1 transcript levels analysis via qRT-PCR. The expression level for each gene in the GLP-1 OFF background was set as one. Three biological replicates were conducted and two tailed t-test was used for statistical analysis. P-value ≤ 0.01 (*); ≤ 0.001 (**). (D) Venn diagram identifying GLP-1 transcriptional targets through integrative genome-wide approach. Five biological replicates were used to conduct transcriptomic analysis and identified 94 GLP-1-dependent genes (blue circle). Two GLP-1 transcriptional targets were defined as genes whose mRNA expression was controlled by GLP-1 and also had LAG-1 bound to their promoter regions (red circle, data from Fig 4D). See S5 Table.
Fig 6
Fig 6. FBF-2 accumulation is post-transcriptionally controlled by GLP-1 transcriptional targets LST-1 and SYGL-1.
(A) Images of V5-stained (FBF-2, green, from fbf-2(q932[3xV5::fbf-2]) germlines from dissected young adult hermaphrodites of the indicated genotype. See S1 Table for the complete genotypes. Star, distal end; dashed white line, meiotic entry. Scale bar is 10 μm. (B—D) Plot of FBF-2 levels (B—C) and comparison of peak FBF-2 accumulation (D) for indicated genotype. Numbers indicate mean values of FBF-2 level for each genotype (in blue) and numbers in bracket shows the sample size. Dots, mean (B-C) or data points (D); Error bars, mean ± SD. P-value ≤ 0.01 (*); ≤ 0.001 (**); ≤ 0.0001 (***); > 0.01 non-significant (NS.). (E) Model depicting genetic control of FBF-2 peak levels and percent contribution to peak FBF-2 accumulation. Total of 85% of FBF-2 peak level can be attributed to GLP-1 signaling through GLP-1 transcriptional targets lst-1 and sygl-1.
Fig 7
Fig 7. Time-course transcriptomic analysis to identify LAG-1-dependent genes in the germline.
(A) Schematic showing time-course qRT-PCR and transcriptomic analysis following germline-specific degradation of LAG-1. This strain harbors germline-expressed TIR1, an ubiquitin E3 ligase that drives degron containing target protein degradation through proteolysis in the presence of co-factor auxin [38]. The CRISPR allele lag-1(oz536oz537) has the AID degron fused to the C-terminus of LAG-1, which is recognized by TIR1, resulting in germline-specific degradation of LAG-1. The complete genotype for this strain is gld-2(q497) gld-1(q485); glp-1(ar202); lag-1(oz536oz537[lag-1::degron::3xHA]); ieSi64[gld-1p::TIR1::mRuby::gld-1 3'UTR]. Isolated gonads, after dissection, are used to quantitate the abundance of RNAs, either through qRT-PCR or transciptomic analysis. (B & C) Quantitation of two GLP-1/LAG-1 targets sygl-1 and lst-1 mRNA abundance after auxin treatment at different time points. Three biological replicates were conducted and two-tailed t-test was used for statistical analysis. P-value ≤ 0.01 (*); ≤ 0.001 (**); ≤ 0.0001 (***); > 0.01 non-significant (NS.). (D) Venn diagram showing genes whose RNA expression is dependent on LAG-1 at the various time points through transcriptomic analysis. Genes observed at an earlier time are also dependent at later time point(s), but not shown for simplicity. The presented genes were also controlled by GLP-1. Four biological replicates were conducted for each time point. (E) Expression of 5 genes was reduced after 4 hrs auxin treatment, in addition to lst-1 and sgyl-1 (identified at 2 hrs auxin treatment). Shown are the genes’ relative fold reduction in both GLP-1 OFF and LAG-1 OFF (via 4 hrs auxin treatment) from transcriptomic analysis. (F) qRT-PCR analysis for genes expression level from (E) in different mutant backgrounds. The genotypes are, GLP-1 ON: gld-2(q497) gld-1(q485); glp-1(ar202). GLP-1 OFF: gld-2(q497) gld-1(q485); glp-1(q175). GLP-1 ON LST-1 SYGL-1 OFF: gld-2(q497) gld-1(q485) lst-1(ok814) sygl-1(tm5040); glp-1(ar202). Five biological replicates were conducted for each genotype and two-tailed t-test was used for statistical analysis. P-value ≤ 0.01 (*); ≤ 0.001 (**); ≤ 0.0001 (***); > 0.01 non-significant (NS.). (G) Model depicting genetic control of RNA accumulation for genes from (F). See S6 and S7 Tables.

References

    1. Morrison SJ, Kimble J. Asymmetric and symmetric stem-cell divisions in development and cancer. Nature. 2006. pp. 1068–1074. 10.1038/nature04956 - DOI - PubMed
    1. Morrison SJ, Spradling AC. Stem Cells and Niches: Mechanisms That Promote Stem Cell Maintenance throughout Life. Cell. 2008. pp. 598–611. 10.1016/j.cell.2008.01.038 - DOI - PMC - PubMed
    1. Simons BD, Clevers H. Strategies for homeostatic stem cell self-renewal in adult tissues. Cell. 2011. pp. 851–862. 10.1016/j.cell.2011.05.033 - DOI - PubMed
    1. Hubbard EJA, Schedl T. Biology of the Caenorhabditis elegans Germline Stem Cell System. Genetics. 2019;213: 1145–1188. 10.1534/genetics.119.300238 - DOI - PMC - PubMed
    1. Greenwald I, Kovall R. Notch signaling: genetics and structure. WormBook: the online review of C. elegans biology. 2013. pp. 1–28. 10.1895/wormbook.1.10.2 - DOI - PMC - PubMed

Publication types

MeSH terms