. 2020 Mar 20;15(3):e0229080.
doi: 10.1371/journal.pone.0229080. eCollection 2020.

Antibody characterization using immunosignatures

Affiliations

Antibody characterization using immunosignatures

Phillip Stafford et al. PLoS One. .

Abstract

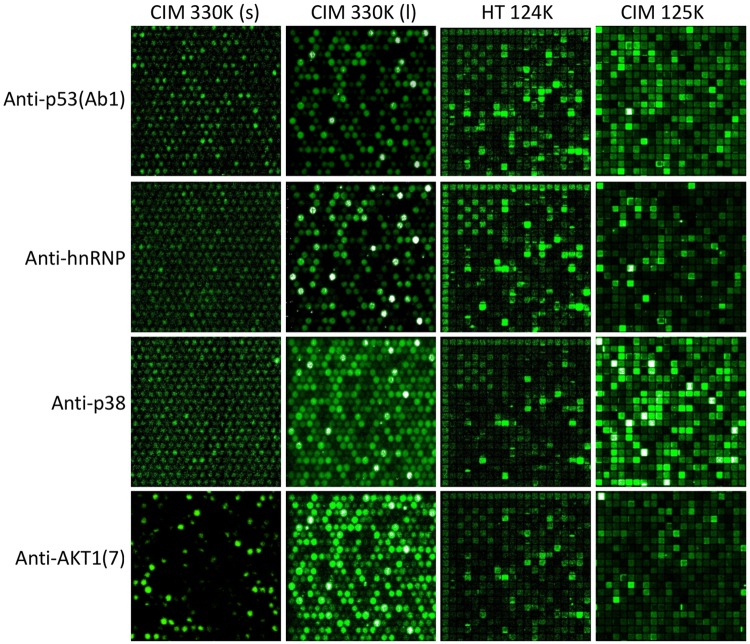
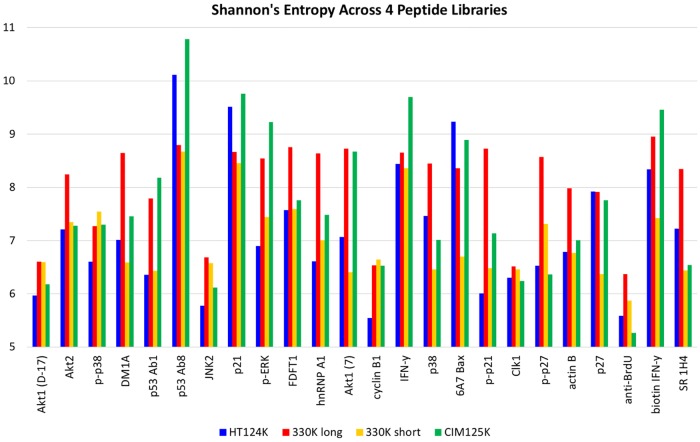
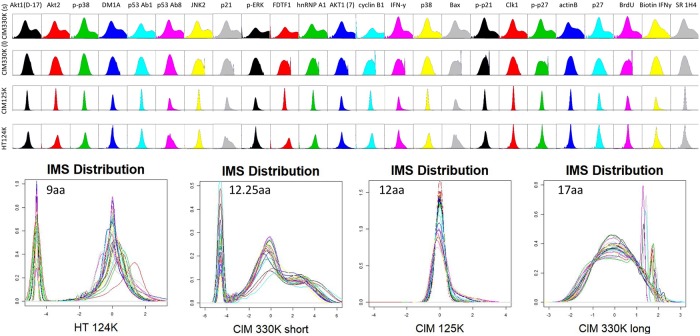
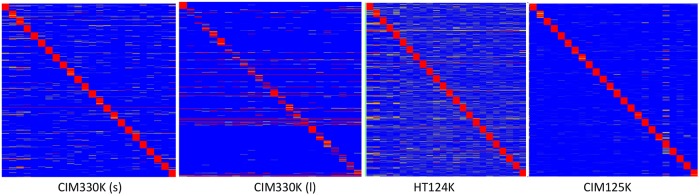
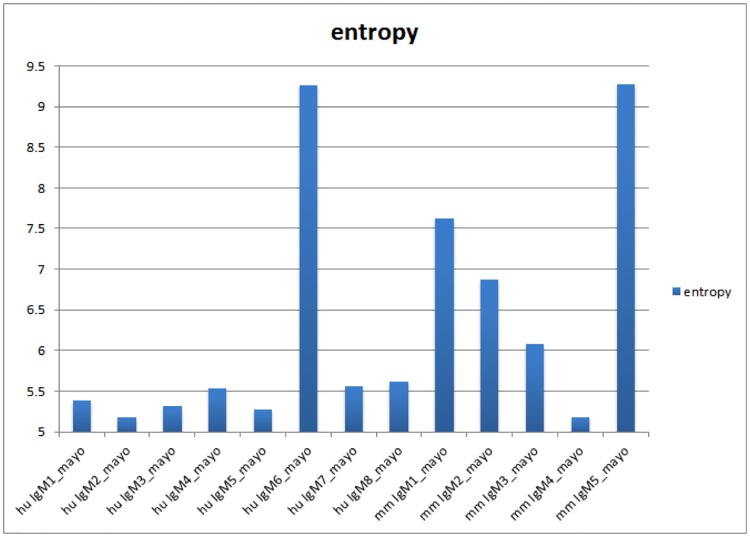
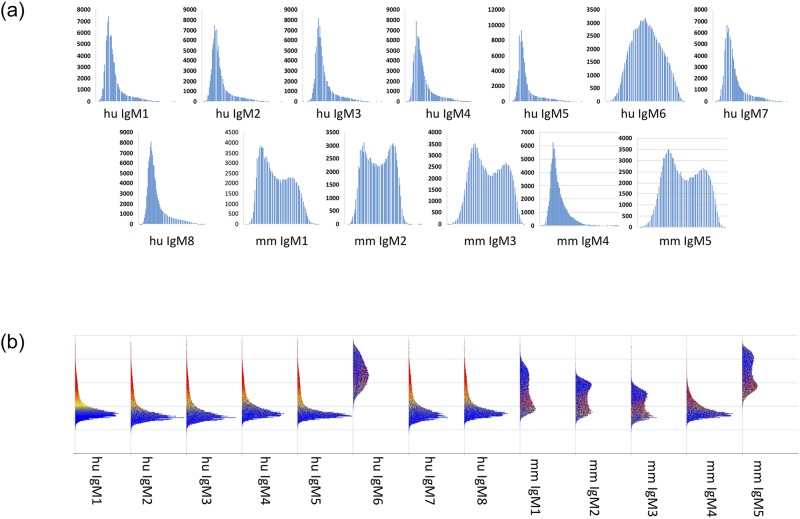
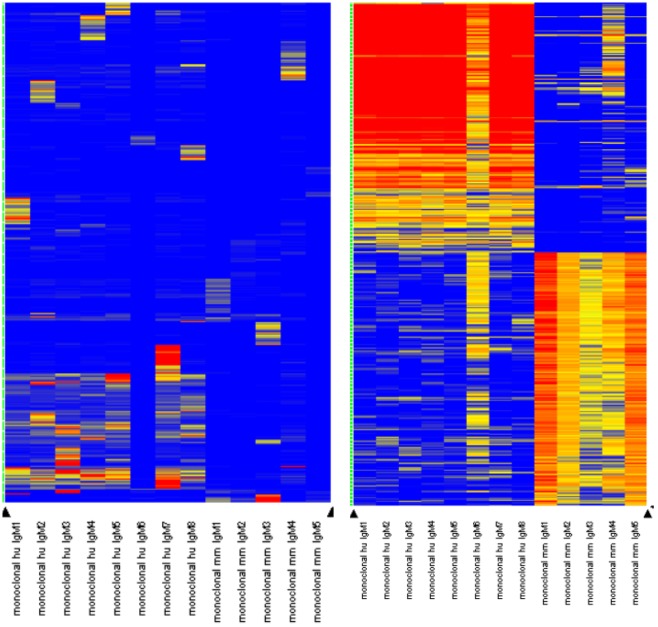
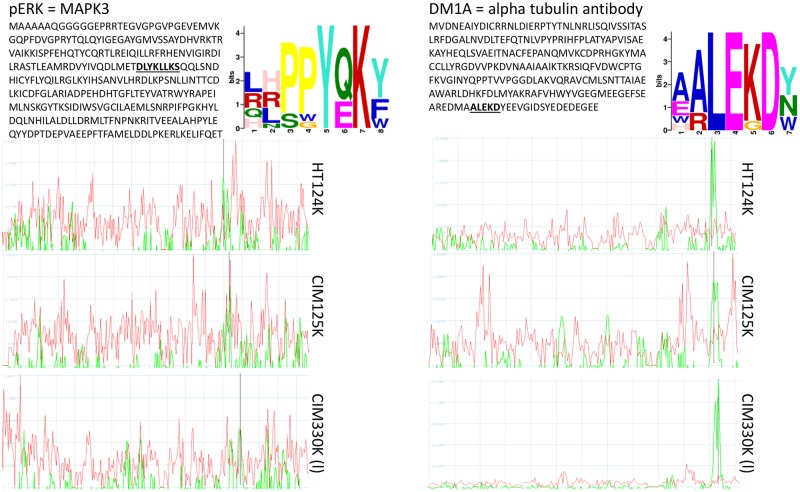
Therapeutic monoclonal antibodies have the potential to work as biological therapeutics. OKT3, Herceptin, Keytruda and others have positively impacted healthcare. Antibodies evolved naturally to provide high specificity and high affinity once mature. These characteristics can make them useful as therapeutics. However, we may be missing characteristics that are not obvious. We present a means of measuring antibodies in an unbiased manner that may highlight therapeutic activity. We propose using a microarray of random peptides to assess antibody properties. We tested twenty-four different commercial antibodies to gain some perspective about how much information can be derived from binding antibodies to random peptide libraries. Some monoclonals preferred to bind shorter peptides, some longer, some preferred motifs closer to the C-term, some nearer the N-term. We tested some antibodies with clinical activity but whose function was blinded to us at the time. We were provided with twenty-one different monoclonal antibodies, thirteen mouse and eight human IgM. These antibodies produced a variety of binding patterns on the random peptide arrays. When unblinded, the antibodies with polyspecific binding were the ones with the greatest therapeutic activity. The protein target to these therapeutic monoclonals is still unknown but using common sequence motifs from the peptides we predicted several human and mouse proteins. The same five highest proteins appeared in both mouse and human lists.


Conflict of interest statement

The authors have declared that no competing interest exist.

Figures

Fig 1
Fig 1. Raw images of a small portion of the upper-left portion of four different peptide microarrays showing four different monoclonal antibodies.
The X axis is four different peptide libraries; CIM330K (short) is a library of 330,000 random-sequence peptides of length 12.2 residues; CIM 330K (long) is a library of 330,000 random-sequence peptides of length 17 residues. HT124K is a library of 124,000 random-sequence peptides of length 9 residues; CIM125K is a library of 125,000 peptides of mean length 12 residues. The Y axis is four commercially-sourced monoclonal antibodies. Row 1: anti-human TP-53 (Ab1) has low binding to most peptides but very high binding to a small subset of peptides, especially to those containing the sequence RHSVV. Row 2: anti-human hnRNP monoclonal has an intermediate binding prevalence, with approximately 15% of the total peptides binding at >2SD above background. Row 3: anti-human p38 monoclonal has low binding pattern but at least 15% of all peptides bind at least 2SD above background with a few high binders. Row 4: anti-AKT1(7) monoclonal has more promiscuous binding with >40% of all peptides binding >2SD above background for HT124K and CIM125K. This visual display is intended to demonstrate qualitatively how diverse the binding patterns are.
Fig 2
Fig 2. Entropy measures of each of the 24 different monoclonals tested.
Shannon’s Entropy was calculated for each of the monoclonals and each of the 3 different peptide libraries. Since each peptide library is different, entropy calculations will differ as well, however a general trend shows that p53Ab8 has generally high measured entropy and anti-BrdU the lowest.
Fig 3
Fig 3. Data distribution for 24 monoclonals, for each peptide microarray library.
Every peptide is shown as raw data for each of the 3 different peptide microarray libraries. Distribution kurtosis and 75th percentile distributions are correlated to binding promiscuity.
Fig 4
Fig 4. Hierarchical clustering of the top 50 peptides for each of the 24 monocloanls tested.
The top 200 peptides for each monoclonal were selected by filtering via pattern-matching to a perfectly discriminatory pattern (i.e. high for each monoclonal, low for the other 23 monoclonals). This filter produced peptides that are unique to each monoclonal, if possible. The values for these 50*24 = 1200 peptides is shown for the three microarray libraries. The peptides were clustered using Pearson’s correlation coefficient to group peptides on the Y axis, the X axis lists each monoclonal, and was ordered manually Common reactivity is seen as colored bars off the diagonal axis.
Fig 5
Fig 5. Entropy measures for 8 human therapeutic monoclonals and 5 mouse therapeutic monoclonals (IgM).
Experimental IgM monoclonals used for therapeutic remyelination in human and mouse. IgM6 and IgM1 and IgM5 were shown by clinical trial significant efficacy in remyelinating human and mouse neurons, respectively. No other monoclonal showed efficacy.
Fig 6
Fig 6. Data distribution for monoclonals shown in Fig 4.
Data for all 125,000 peptides from CIM125K are shown as a density plot, either one by one (top plots) or side-by-side (bottom plot). For the distributions shown along the bottom, blue color indicates low intensity binding while yellow and red indicate higher binding at least above the median signal for that array. Antibodies are shown in the same order as Fig 4. Wide/broad distributions match promiscuous binding of specific antibodies, narrow distributions suggest more specific binding. No other serological test performed on any of these antibodies led investigators to predictions of efficacy, but therapeutic efficacy of these IgM antibodies correlated perfectly with the broad distributions and relatively high entropy scores.
Fig 7
Fig 7. Heatmap for the 13 different clinical monoclonals.
Each of the clinical monoclonals was tested exactly like the 24 commercial antibodies, to find 50 peptides that were unique for each antibody (see Fig 4). Left: For each of the antibodies, some unique peptides were identified but for the human antibodies, many peptides overlapped suggesting a common target. The mouse antibodies had less overlap with either the human or other mouse antibodies. Right: We applied a general filter for high binding peptides. Here there are 200 peptides identified for the human antibodies (left) and 200 for the mouse antibodies (right). These high-binding peptides overlap with each other, but not between mouse and human reinforcing the possibility that these two sets of antibodies are against different protein targets. These 200 peptides were used to BLAST all human and all mouse proteins, respectively (see Table 4).
Fig 8
Fig 8. Alignment of peptide data from JNK2 (top) and DM1A (bottom).
JNK2 and DM1A were processed on 3 microarray platforms. 125K, 124K and 330K array data were used to find epitopes using CLUSTALW and GLAM2. The large text figures represent the GLAM2 output. These motifs are similar to the actual linear epitope shown underlined in the protein sequence. Right: Guitope [13] was used to identify a region of either JNK2 (top three graphs) or tubulin (bottom three graphs). The red lines indicate the noise threshold, generated by testing all random peptides from each of the peptide libraries. The green line is the signal from the 200 selected peptides unique to that antibody. The black vertical line indicates the position within the protein where the epitope is likely to reside. For both proteins, the Guitope analysis predicted the exact location of the start of the epitope sequence. 72 residues from the C-terminus of JNK2 and 23 residues from the C-terminus of tubulin.

References

    1. Buus S., et al., High-resolution Mapping of Linear Antibody Epitopes Using Ultrahigh-density Peptide Microarrays. Molecular & Cellular Proteomics, 2012. 11(12): p. 1790–1800. - PMC - PubMed
    1. Huang J., et al., MimoDB 2.0: a mimotope database and beyond. Nucleic Acids Research, 2012. 40(Database issue): p. D271–D277. 10.1093/nar/gkr922 - DOI - PMC - PubMed
    1. Stafford P., et al., Physical characterization of the “Immunosignaturing Effect”. Molecular & Cellular Proteomics, 2012. 11(4). - PMC - PubMed
    1. Boltz K.W., et al., Peptide microarrays for carbohydrate recognition. Analyst, 2009. 134(4): p. 650–652. 10.1039/b823156g - DOI - PubMed
    1. Rodriguez M., et al., Remyelination by Oligodendrocytes Stimulated by Antiserum to Spinal Cord. Journal of Neuropathology & Experimental Neurology, 1987. 46(1): p. 84–95. - PubMed

Publication types