. 2020 Mar 20;16(3):e1008442.
doi: 10.1371/journal.ppat.1008442. eCollection 2020 Mar.

Latency reversal agents modulate HIV antigen processing and presentation to CD8 T cells

Affiliations

Latency reversal agents modulate HIV antigen processing and presentation to CD8 T cells

Julie Boucau et al. PLoS Pathog. .

Abstract

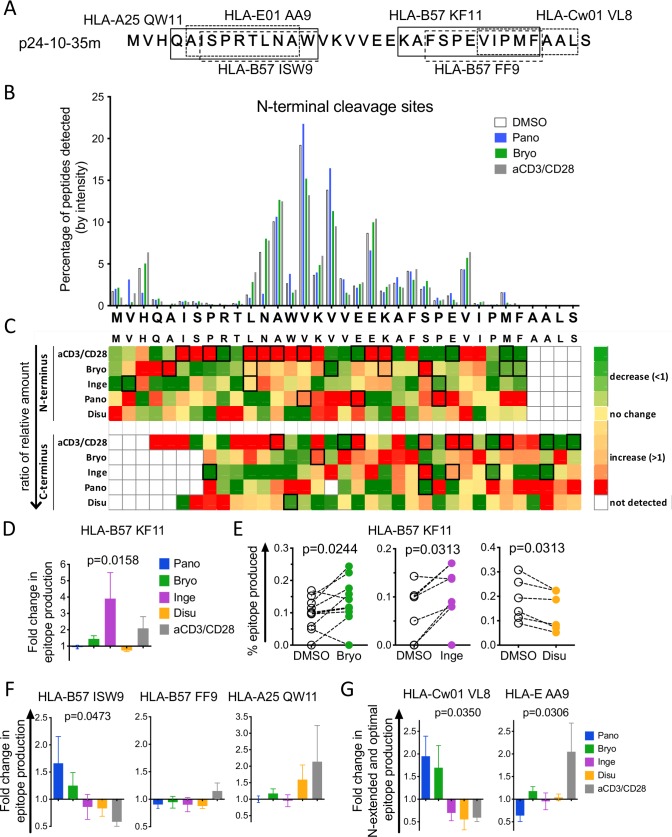
Latency reversal agents (LRA) variably induce HIV re-expression in CD4 T cells but reservoirs are not cleared. Whether HIV epitope presentation is similar between latency reversal and initial infection of CD4 T cells is unknown yet crucial to define immune responses able to detect HIV-infected CD4 T cells after latency reversal. HIV peptides displayed by MHC comes from the intracellular degradation of proteins by proteasomes and post-proteasomal peptidases but the impact of LRAs on antigen processing is not known. Here we show that HDAC inhibitors (HDCAi) reduced cytosolic proteolytic activities while PKC agonists (PKCa) increased them to a lesser extent than that induced by TCR activation. During the cytosolic degradation of long HIV peptides in LRA-treated CD4 T cells extracts, HDACi and PKCa modulated degradation patterns of peptides and altered the production of HIV epitopes in often opposite ways. Beyond known HIV epitopes, HDACi narrowed the coverage of HIV antigenic fragments by 8-11aa degradation peptides while PKCa broadened it. LRAs altered HIV infection kinetics and modulated CD8 T cell activation in an epitope- and time-dependent manner. Interestingly the efficiency of endogenous epitope processing and presentation to CD8 T cells was increased by PKCa Ingenol at early time points despite low levels of antigens. LRA-induced modulations of antigen processing should be considered and exploited to enhance and broaden HIV peptide presentation by CD4 T cells and to improve immune recognition after latency reversal. This property of LRAs, if confirmed with other antigens, might be exploited to improve immune detection of diseased cells beyond HIV.


Conflict of interest statement

The authors have declared that no competing interests exist.

Figures

Fig 1
Fig 1. Different classes of LRA alter cytosolic peptidase activities.
A. Aminopeptidase hydrolytic activity in primary CD4 T cells of healthy donors (n = 8–10) at 6, 24 and 48 h after treatment with DMSO (open circles), Bryostatin (green triangles) or Panobinostat (blue squares). B. Aminopeptidase hydrolytic activity in paired DMSO- (open circles) and Panobinostat-treated (blue circles, left) or DMSO- and Bryostatin-treated (green circles, right) primary CD4 T cells at 48 h post-treatment (n = 8 healthy donors). Wilcoxon matched-pairs signed-rank t tests analysis. C. Fold change in aminopeptidase, proteasomal chymotryptic, caspase-like, tryptic-like hydrolytic activities in LRA-treated over DMSO-treated cells at 48 hours: Panobinostat- (blue), Romidepsin- (red), Disulfiram- (orange), Bryostatin- (green), Ingenol- (purple) or aCD3/CD28-treated samples (n = 6–16). One-Way ANOVA Kruskal-Wallis tests on the 6 groups and p-values are reported. D. CD25 and CD69 surface levels were monitored by flow cytometry in primary CD4 T cells at 6, 24 and 48 h post treatment with DMSO (black crosses), Panobinostat (inverted blue triangles), Romidepsin (red squares), Disulfiram (orange circles), Bryostatin (green triangles), Ingenol (purple diamonds) or aCD3/CD28 (grey circles). n = 4–12 healthy donors. E. Unsupervised visualization with t-SNE on Z score centered and normalized data, which included the percentages of CD25-, CD69-, CD38 and HLA-DR-positive CD4 T cells in each sample and the values for aminopeptidase and proteasome chymotryptic, caspase-like and tryptic-like hydrolytic activities. Panobinostat and Romidepsin were grouped as HDACi (green, n = 13) and Bryostatin and Ingenol were grouped as PKCa (red, n = 30), also displayed are mock-treated DMSO (blue, n = 33) and aCD3/CD28-treated (black, n = 14). Ellipses indicate 75% confidence interval.
Fig 2
Fig 2. LRA treatments alter the degradation pattern of HIV-1 p24-10-35m and epitope production.
A. Sequence of HXB2 HIV-1 Gag p24-10-35m substrate and MHC-I optimal epitopes. B. Cleavage patterns of p24-10-35m after a 120-minute degradation in extracts of primary CD4 T cells treated with DMSO- (open bars), Panobinostat- (blue), Bryostatin- (green) or aCD3/CD28–treated (grey) showing the relative amount of fragments starting at each residue (N-terminus cleavage site). Results shown for a representative experiment. C. Ratios of the relative amount of fragments starting (top) and ending (bottom) at each residue in matched DMSO- over LRA-treated samples (n = 6–15). Changes in fragments starting (N-terminus) or ending (C-terminus) at each position appear as decreased (green; <1), increased (orange/red; >1) or unchanged (yellow) compared to DMSO-treated samples. Wilcoxon matched-pairs signed-rank t tests were performed on the matched DMSO- and LRA-treated samples. The boxed squares indicate statistical significance (p < 0.05). D. Fold change in HLA-B57-KF11 epitope production in CD4 T cell extracts treated with Panobinostat- (blue), Bryostatin- (green), Ingenol- (purple), Disulfiram- (orange) or aCD3/CD28-treated (grey) extracts over matched DMSO-treated extracts (n = 6–10 donors). One-Way ANOVA Kruskal-Wallis tests on the 5 groups and the p-value is reported. E. Percentage of HLA-B57-restricted KF11 epitope produced in paired DMSO- (open circles) and Bryostatin- (green, n = 9, left), Ingenol- (purple, n = 6, middle) or Disulfiram- (orange, n = 6, right). Wilcoxon matched-pairs signed-rank t tests were performed. F. Fold change in HLA-B57 ISW9 (left, n = 4–9 donors), HLA-B57 FF9 (middle, n = 5–12 donors) and HLA-A25 QW11 (right, n = 2–6 donors) epitope production in paired Panobinostat- (blue), Bryostatin- (green), Ingenol- (purple), Disulfiram- (orange) or aCD3/CD28-treated (grey) CD4 T cell over paired DMSO-treated extracts. G. Fold change in HLA-Cw01 VL8 (left, n = 2–6 donors) and HLA-E01 AA9 (right, n = 5–9 donors) epitope and N-extended precursors production in Panobinostat- (blue), Bryostatin- (green), Ingenol- (purple), Disulfiram- (orange) or aCD3/CD28-treated (grey) CD4 T cell extracts over paired DMSO-treated extracts. F and G: One-Way ANOVA Kruskal-Wallis tests were performed on the 5 groups and the p-value is reported if statistically significant.
Fig 3
Fig 3. LRA treatments alter the degradation patterns of HIV-1 p24-161-24m and epitope production.
A. Sequence of HXB2 HIV-1 Gag p24-161-24m and MHC-I HIV epitopes. B. Reading vertically the heat map shows changes in the amount of degradation fragments starting (N-terminus, top) or ending (C-terminus, bottom) at each position upon LRA treatment over matched DMSO-treated sample in an average of n = 8–11 healthy donors. Wilcoxon matched-pairs signed-rank t tests were performed on matched DMSO- and aCD3/CD28- or LRA-treated primary CD4 T cells extracts. The boxed squares indicate statistical significance (p < 0.05). C. Fold change in HLA-A02/B70 YL9 (left, n = 5–10 donors), HLA-A2402 DT9 (middle left, n = 5–12 donors) and HLA-A25 QW11 (right, n = 2–6 donors) epitope production in Panobinostat- (blue), Bryostatin- (green), Ingenol- (purple), or aCD3/CD28-treated (grey) CD4 T cell extracts over paired DMSO-treated extracts. One-Way ANOVA Kruskal-Wallis tests were performed on the 4 groups and the associated p-value is reported, Dunn’s Multi-comparison test was calculated and the pairs that statistically differed are indicated with a bar. D. The percentage of HLA-A02/B70 YL9, HLA-A2402 DT9, HLA-A3303 DR11 and HLA-B35/B53/B57/B58 QW9 epitopes produced in paired DMSO- (open circles) and Bryostatin- (green, n = 8–10), Ingenol- (purple, n = 4), Panobinostat- (blue, n = 9) or aCD3/CD28-treated (grey, n = 7) extracts. Wilcoxon matched-pairs signed-rank t tests were performed. * p < 0.05, ** p < 0.01, ns: not significant.
Fig 4
Fig 4. LRA treatments alter the degradation patterns of HIV-1 long peptides into peptides of 8-11aa beyond known HIV epitopes.
A. Relative amount of degradation peptides of 8-11aa detected at each residue of p24-10-35m during degradation in CD4 T cell extracts treated with DMSO (open circles), Bryostatin (green), Panobinostat (blue) or aCD3/CD28 (grey). Results shown for a representative experiment. B. Heat map showing the changes in the contribution of each residue to the production of 8-11aa peptides during the degradation of p24-10-35m in Panobinostat, Bryostatin, Ingenol or aCD3/CD28 over matched DMSO control. n = 7–11 donors. Stars show statistically significant changes (p<0.05). C. Same as A for p24-161-24m degradation peptides. D. Heat map similar to B for p24-161-24mer. n = 4–10 donors.
Fig 5
Fig 5. Combined Bryostatin and Panobinostat treatment of CD4 T cells changes HIV peptide degradation patterns.
A. Aminopeptidase (left) and proteasomal chymotryptic (right) hydrolytic activities in paired DMSO- (open circles) and Panobinostat+Bryostatin-treated (filled circles) primary CD4 T cells measured at 48 h post-treatment. n = 12 healthy donors. Wilcoxon matched-pairs signed-rank t tests. ns: not significant. B. The surface expression of CD3 (right) and CD25 and CD69 (left) was monitored by flow cytometry in primary CD4 T cells at 48 h post treatment with DMSO (open circles), Panobinostat (blue squares), Bryostatin (green triangles), a combination of Panobinostat+Bryostatin (black inverted triangles) (n = 7 healthy donors). One-Way ANOVA Kruskal-Wallis tests were performed on the 4 groups and the overall p-value is reported, Dunn’s Multi-comparison test was calculated and the pairs that statistically differed are indicated with a bar. * p < 0.05, ** p < 0.01, *** p < 0.001. C. Cleavage patterns of p24-10-35m after degradation in extracts from DMSO- (open bars), Panobinostat- (blue), Bryostatin- (green) and combination Panobinostat+Bryostatin-treated (black) primary CD4 T cells extracts at 120 min, showing the relative amount of fragments starting (N-terminus cleavage site) at each residue. Results shown for a representative experiment. D. Heat map representing the relative amount of 8–11 aa peptides containing each aa. Each row represents an LRA-treatment. One representative experiment is shown.
Fig 6
Fig 6. LRAs affect endogenous HIV epitope processing and presentation by HIV-infected CD4 T cells to CD8+ T cells.
A. HIV-1ΔEnv-GFP-VSVg infection rate of primary CD4 T cells pretreated with DMSO (black), aCD3/CD28 (grey) or Panobinostat (blue), Bryostatin (green), Ingenol (purple) was assessed by flow cytometry using GFP and HIV-p24 expression at 48 h post-infection (n = 7 donors with distinct symbols). B. Percentage of CD107a+ CD8 T cells specific for HLA-B57 KF11 (left) and HLA-B57 TW10 (right) after incubation with HLA-B57+ HIV-infected CD4 T cells treated with DMSO, LRA or aCD3/CD28 at 24, 48 and 72h post-infection at a 4:1 CTL:CD4 ratio. For each treatment (DMSO, LRA or aCD3/CD28 beads) control uninfected LRA- or beads-treated CD4 T cells were included in the experiment and used to calculate and subtract CD107a background. C. Percentage of CD107a+ CD8 T cells specific for HLA-B57 ISW9- (cyan), KF11- (orange) and TW10- specific (red) after incubation with peptide-pulsed DMSO-treated HLA-B57+ CD4 T cells measured at a 4:1 CTL:CD4 ratio. A-C: n = 6 experiments with mean values and standard deviations. D. Peptide equivalent (KF11 (right) and TW10 (left), displayed at the surface of HIV-infected HLA-B57+ CD4 T cells treated with DMSO (open blank symbols), Panobinostat (blue squares), Bryostatin (green triangles), Ingenol (inverted purple triangles) and CD3/CD28-stimulated (grey diamonds). The results of n = 5 (TW10) and n = 4 (KF11) infection and degranulation experiments are shown at 24, 48 and 72 hpi. E. Spider plots showing the peptide equivalent (TW10, KF11, ISW9 in ng/ml), HIV infection rates (% GFP+p24+), MHC-I surface levels (mfi) displayed by HIV-infected CD4 T cells pre-treated with DMSO (yellow), aCD3/CD28 (grey), Panobinostat (blue), Bryostatin (green), Ingenol (purple). Axes for any given parameter were scaled uniformly across timepoints to take into account the full dynamic range (i.e., minimum to maximum value for that parameter across the 3 timepoints). Spider plots at 24, 48 and 72 h (left to right) after HIV infection of pre-treated CD4 T cells. F. Spider plots similar to E showing the efficiency of peptide presentation (TW10, KF11, ISW9) defined at the peptide equivalent (TW10, KF11, ISW9) displayed by HIV-infected CD4 T cells divided by the infection rate (% GFP+p24+, an indirect measurement of HIV antigens in cells).

References

    1. Chomont N, El-Far M, Ancuta P, Trautmann L, Procopio FA, Yassine-Diab B, et al. HIV reservoir size and persistence are driven by T cell survival and homeostatic proliferation. Nat Med. 2009;15(8):893–900. 10.1038/nm.1972 - DOI - PMC - PubMed
    1. Churchill MJ, Deeks SG, Margolis DM, Siliciano RF, Swanstrom R. HIV reservoirs: what, where and how to target them. Nature reviews Microbiology. 2016;14(1):55–60. 10.1038/nrmicro.2015.5 - DOI - PubMed
    1. Kim Y, Anderson JL, Lewin SR. Getting the "Kill" into "Shock and Kill": Strategies to Eliminate Latent HIV. Cell host & microbe. 2018;23(1):14–26. - PMC - PubMed
    1. Margolis DM, Garcia JV, Hazuda DJ, Haynes BF. Latency reversal and viral clearance to cure HIV-1. Science. 2016;353(6297):aaf6517 10.1126/science.aaf6517 - DOI - PMC - PubMed
    1. Rasmussen TA, Lewin SR. Shocking HIV out of hiding: where are we with clinical trials of latency reversing agents? Curr Opin HIV AIDS. 2016;11(4):394–401. 10.1097/COH.0000000000000279 - DOI - PubMed

Publication types

MeSH terms