

FVIII activity following FVIII protein infusion or FVIII gene transfer predicts the bleeding risk in hemophilia A rats
- PMID: 32196903
- PMCID: PMC7786582
- DOI: 10.1111/jth.14804
FVIII activity following FVIII protein infusion or FVIII gene transfer predicts the bleeding risk in hemophilia A rats
Abstract
Background: Prophylactic replacement therapy in hemophilia A (HA) patients does not adequately prevent bleeds and arthropathic complications. A more refined understanding of the relationship between coagulation factor VIII (FVIII) levels and bleeding risk during protein prophylaxis, or with gene therapy, is needed to improve patient care.
Objectives: Investigate this relationship in the HA rat, a model exhibiting spontaneous bleeds and development of arthropathy similar to HA patients.
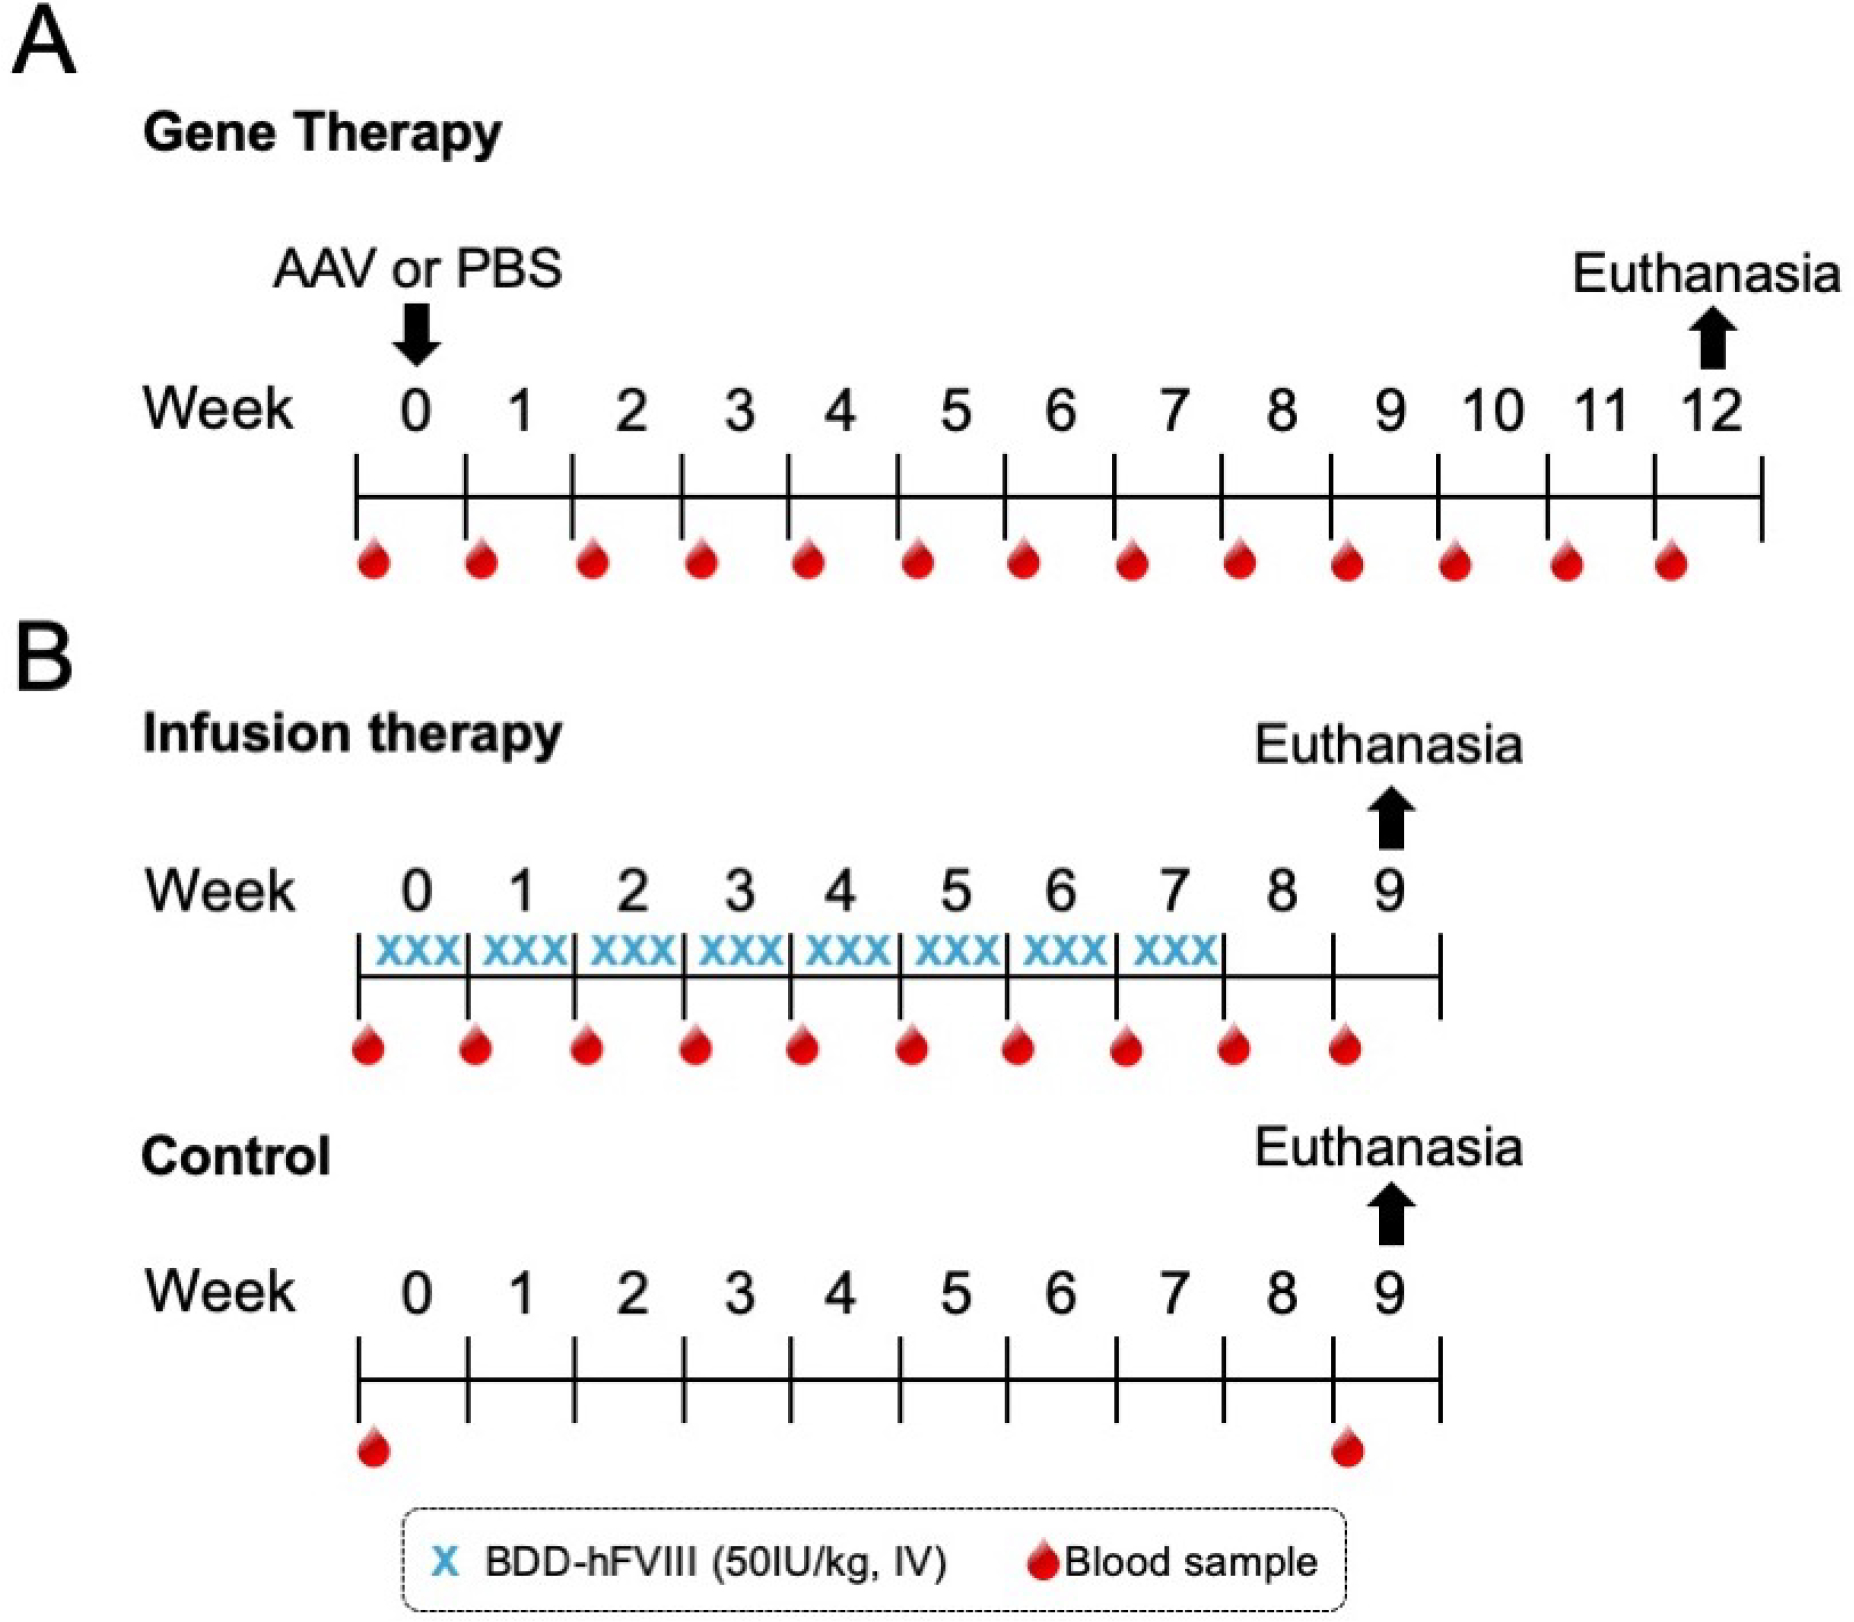
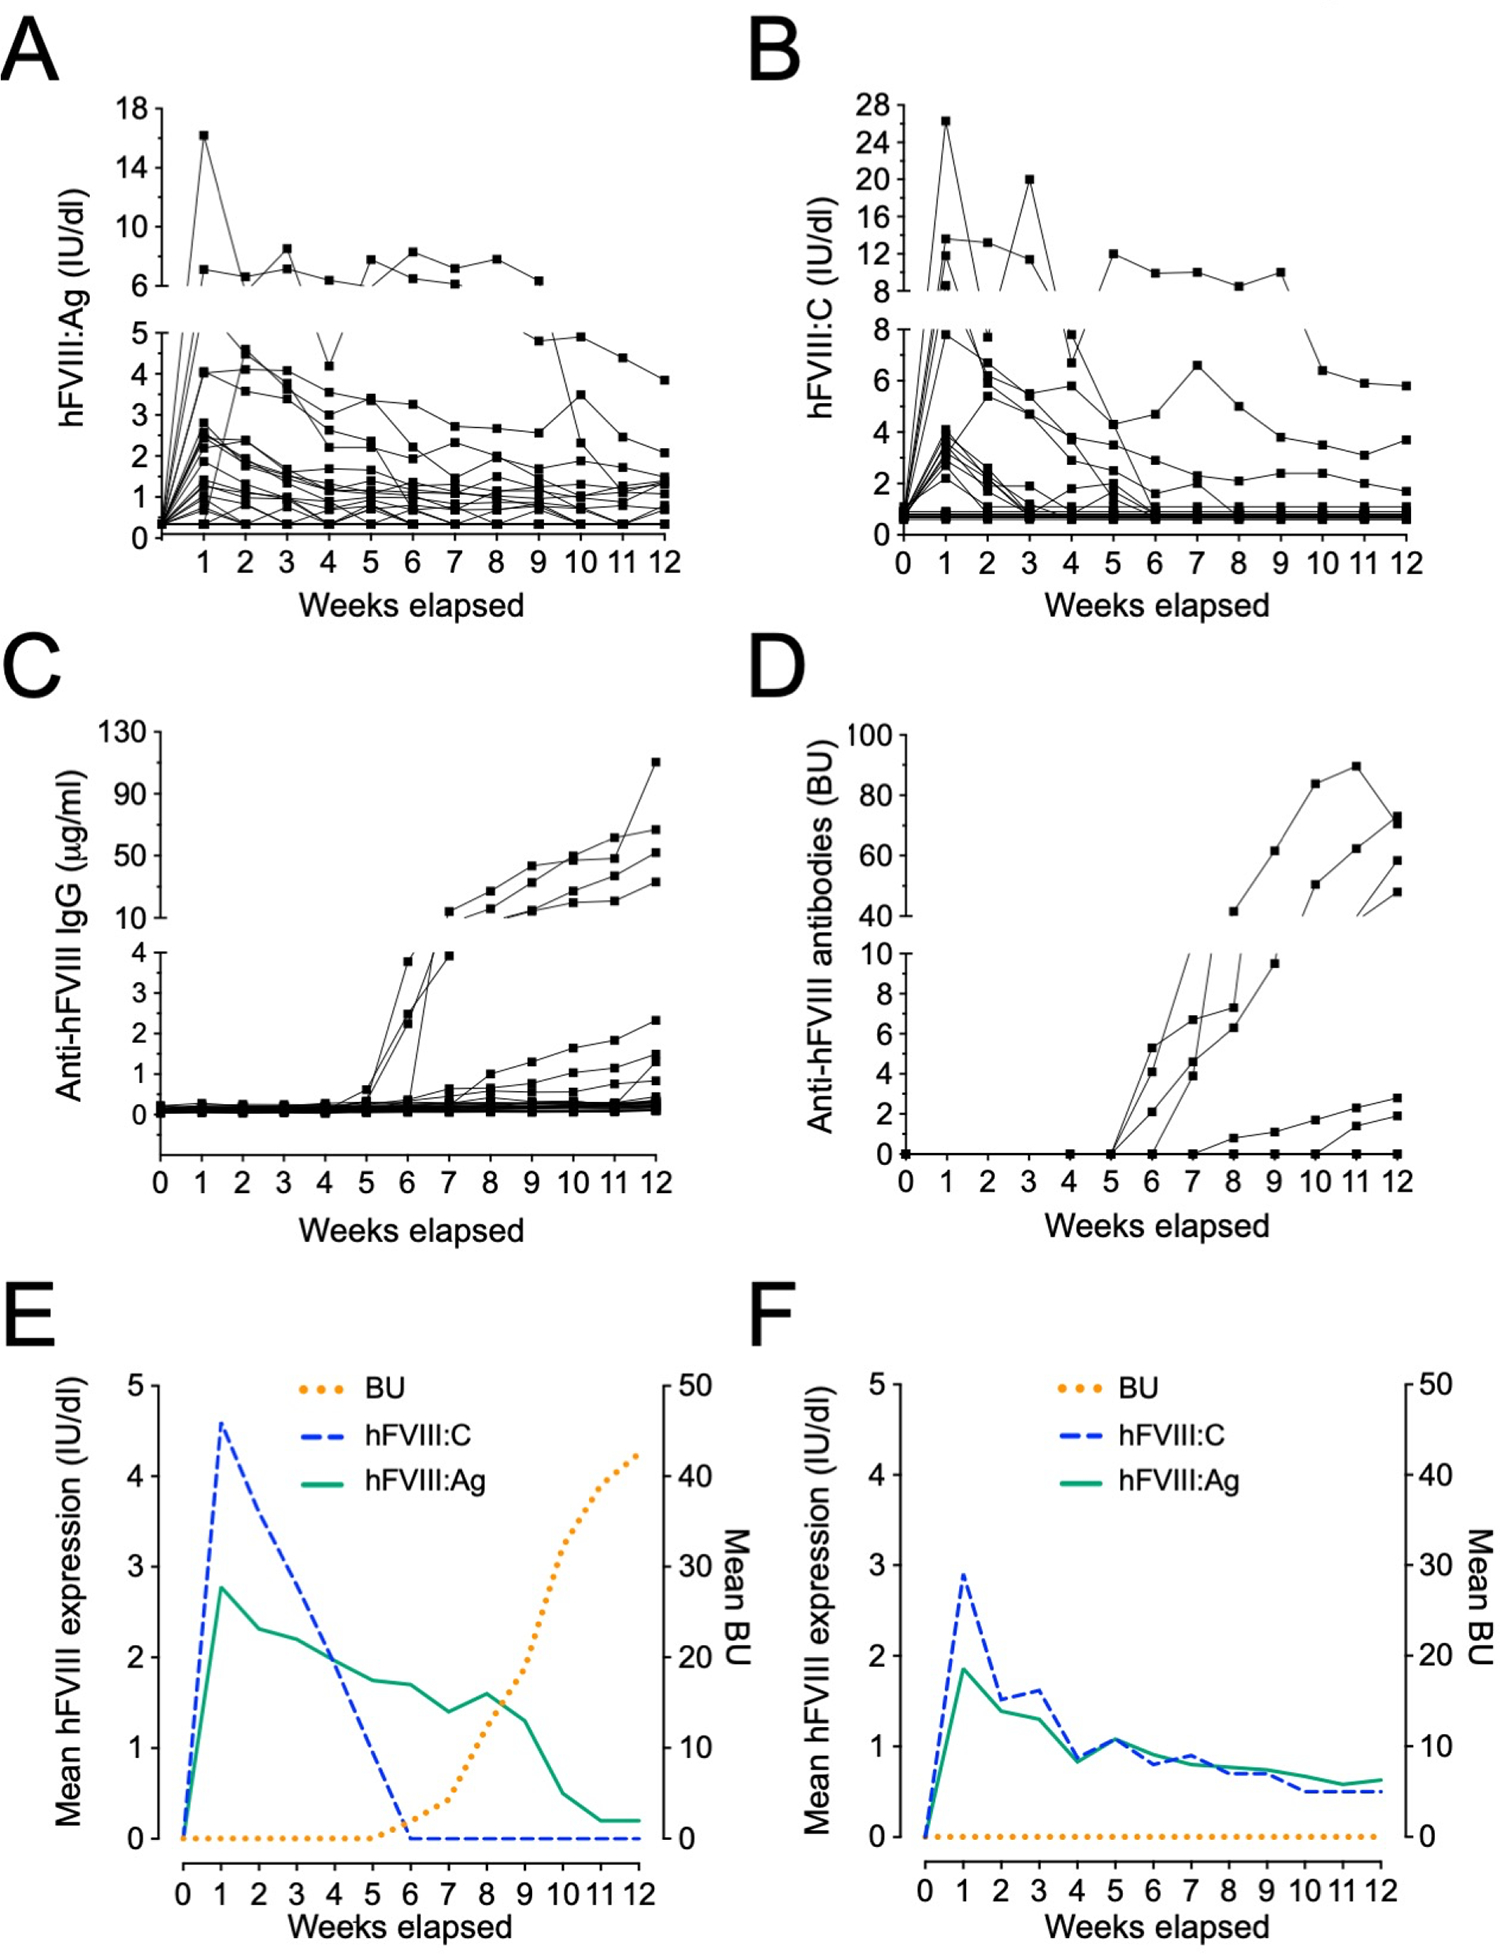
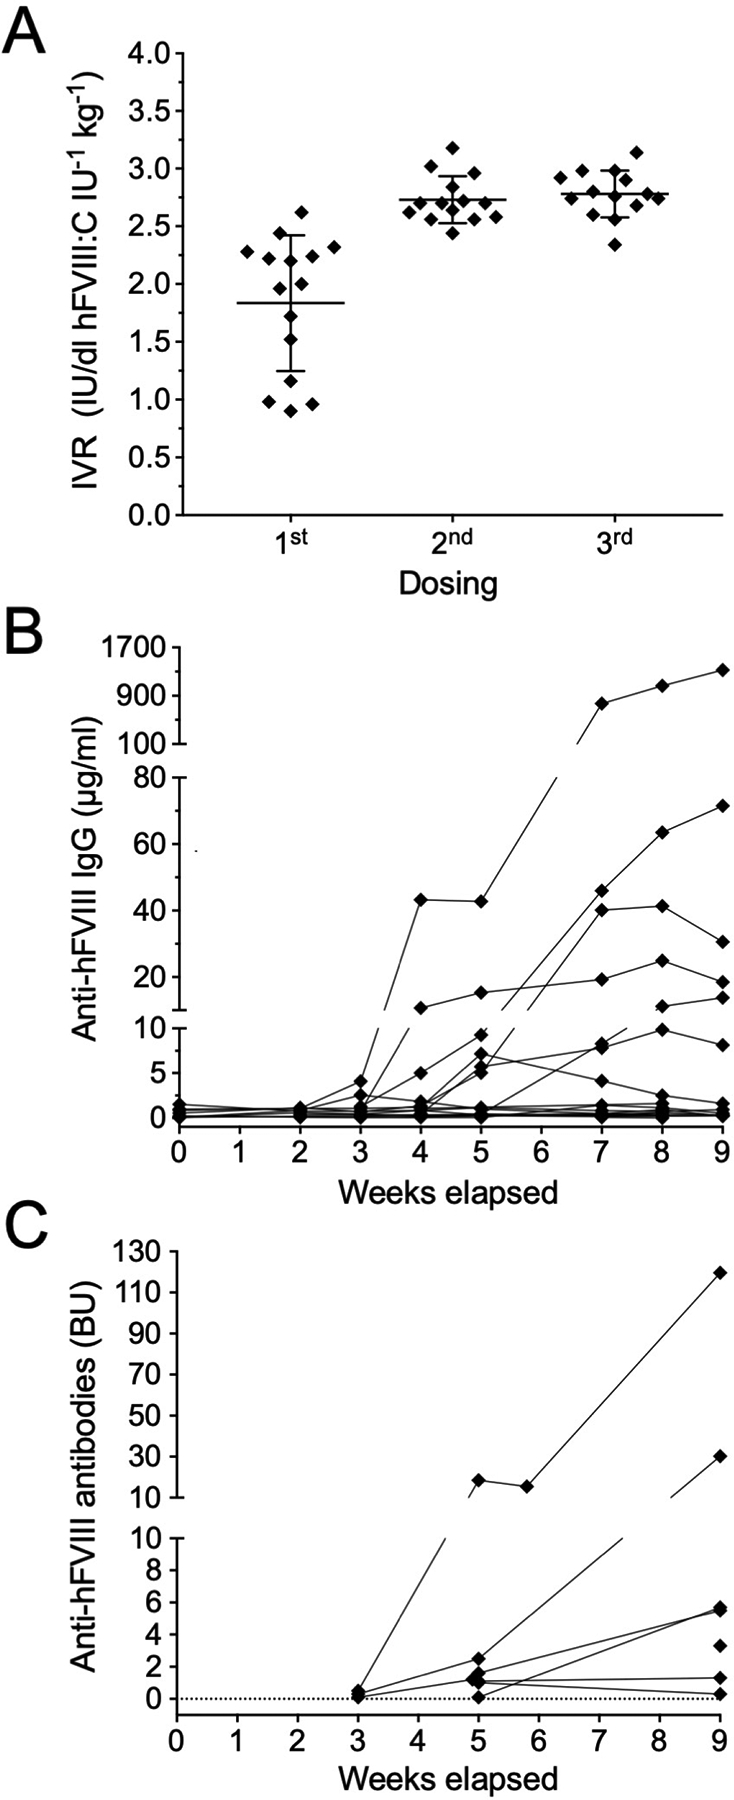
Methods: Human B domain-deleted FVIII was delivered to HA rats via adeno-associated virus (AAV)-mediated gene transfer or multiple intravenous protein injections.
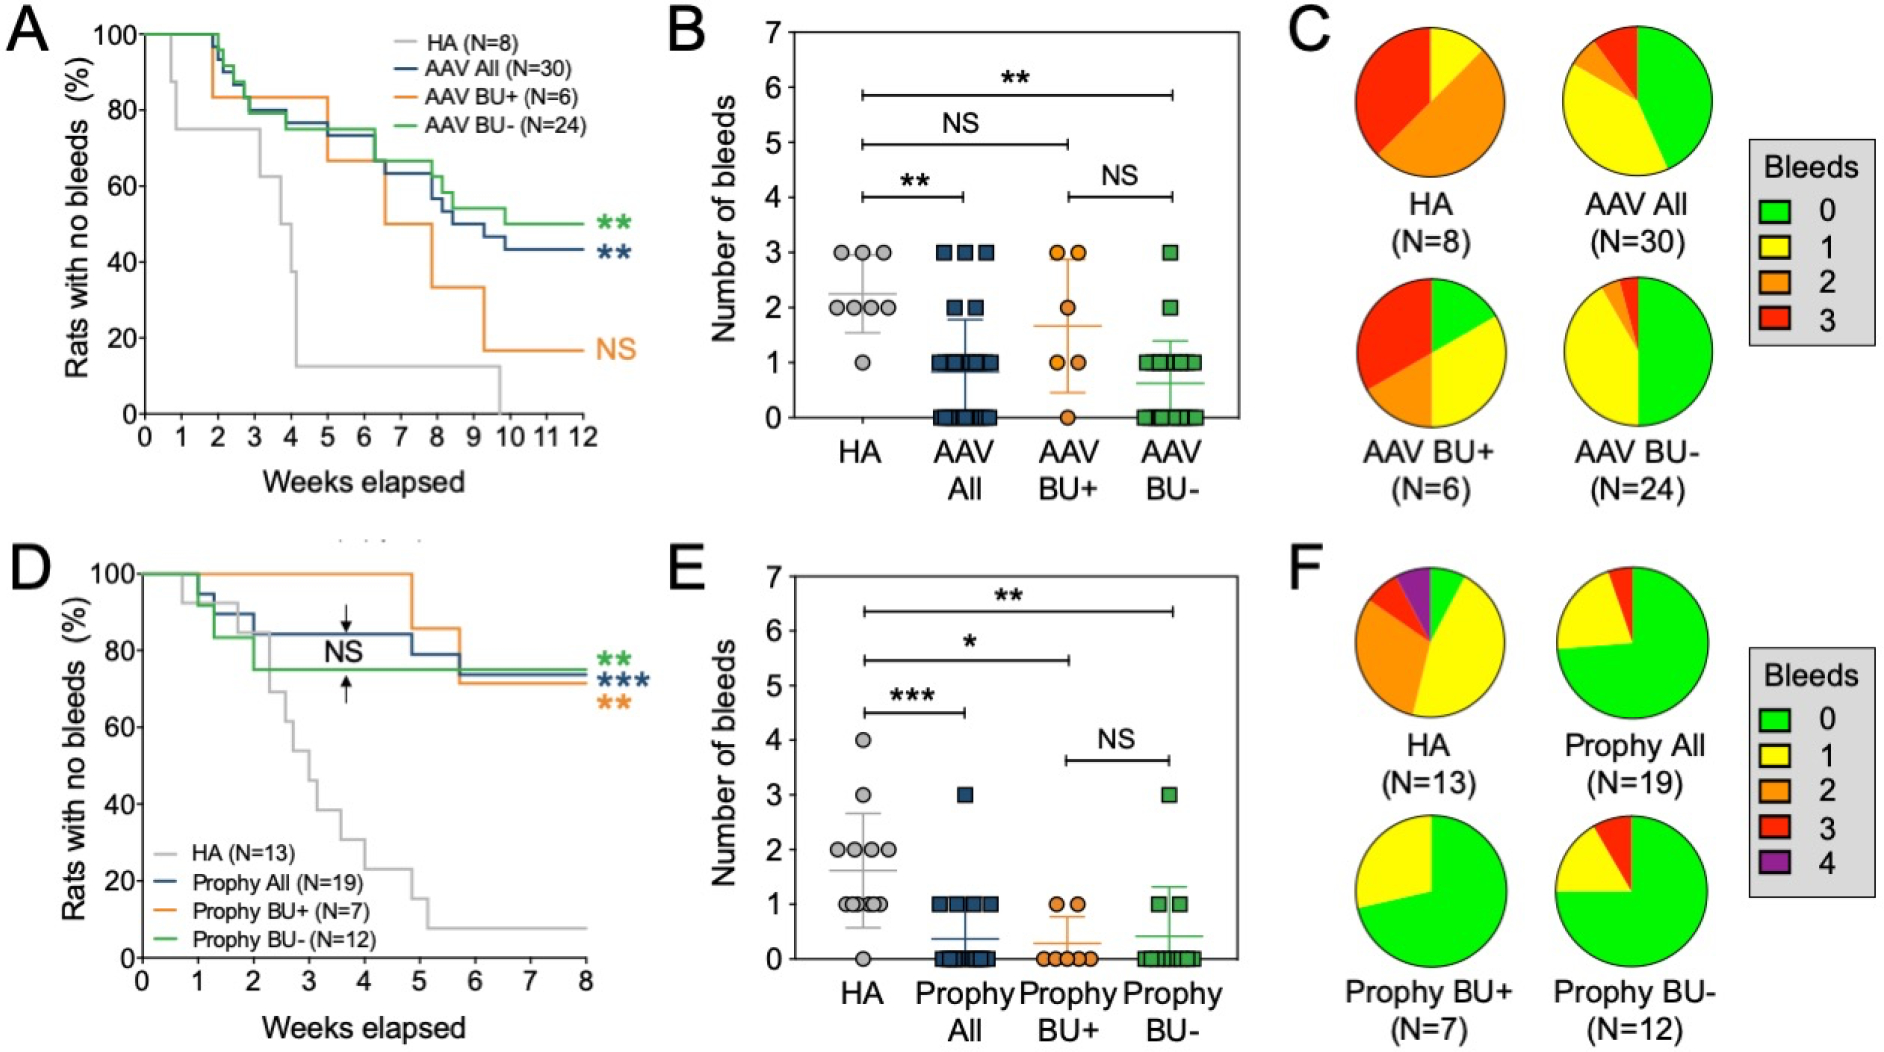
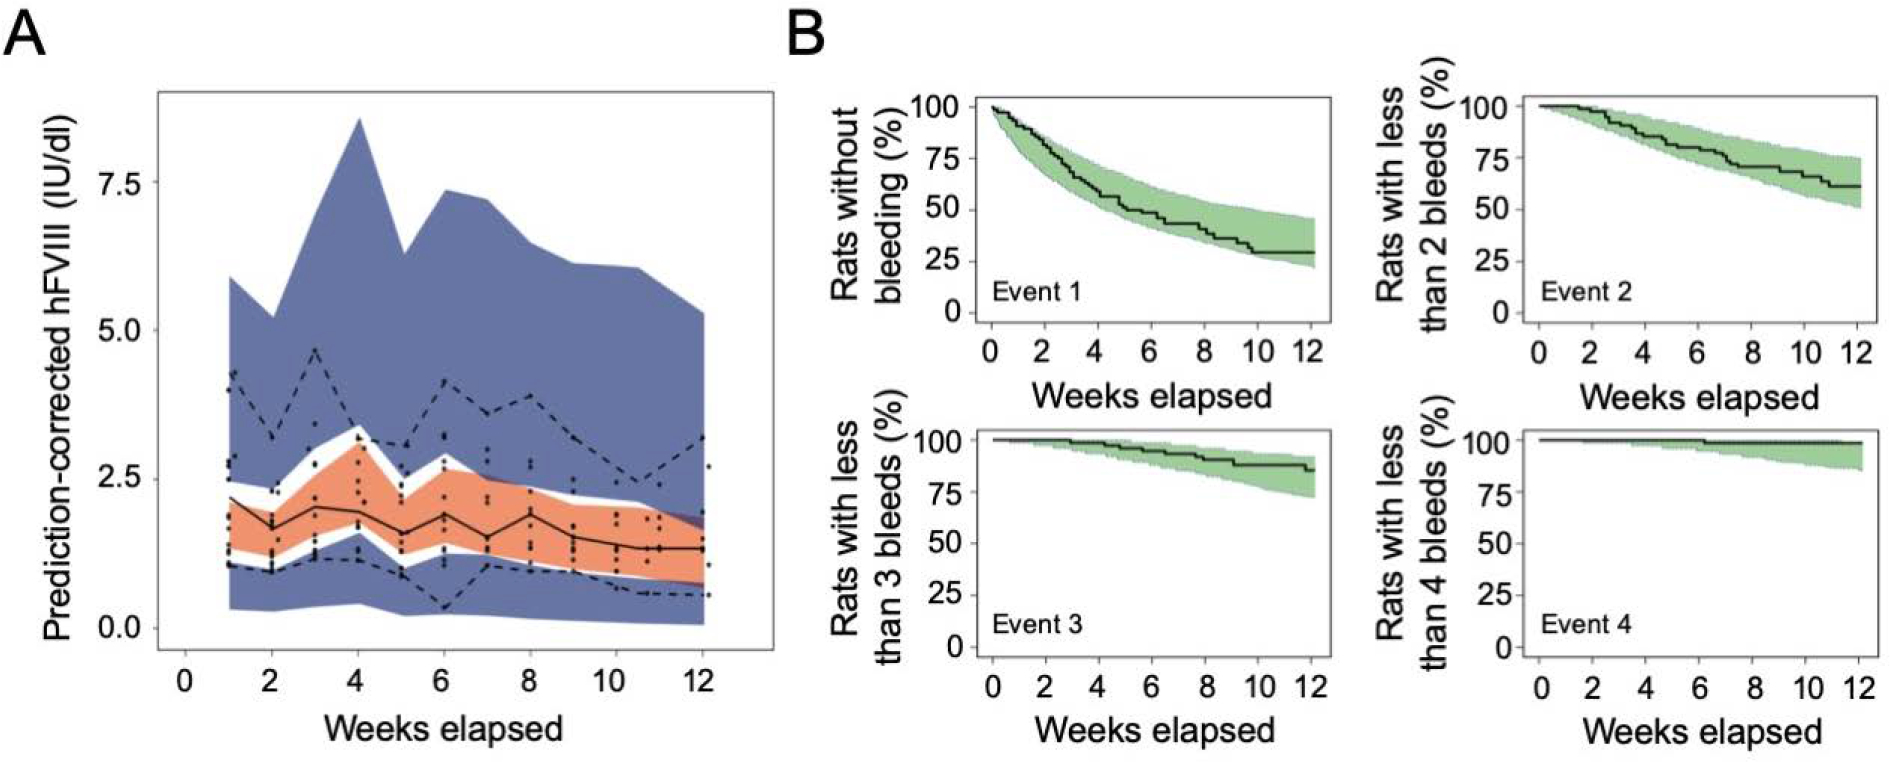
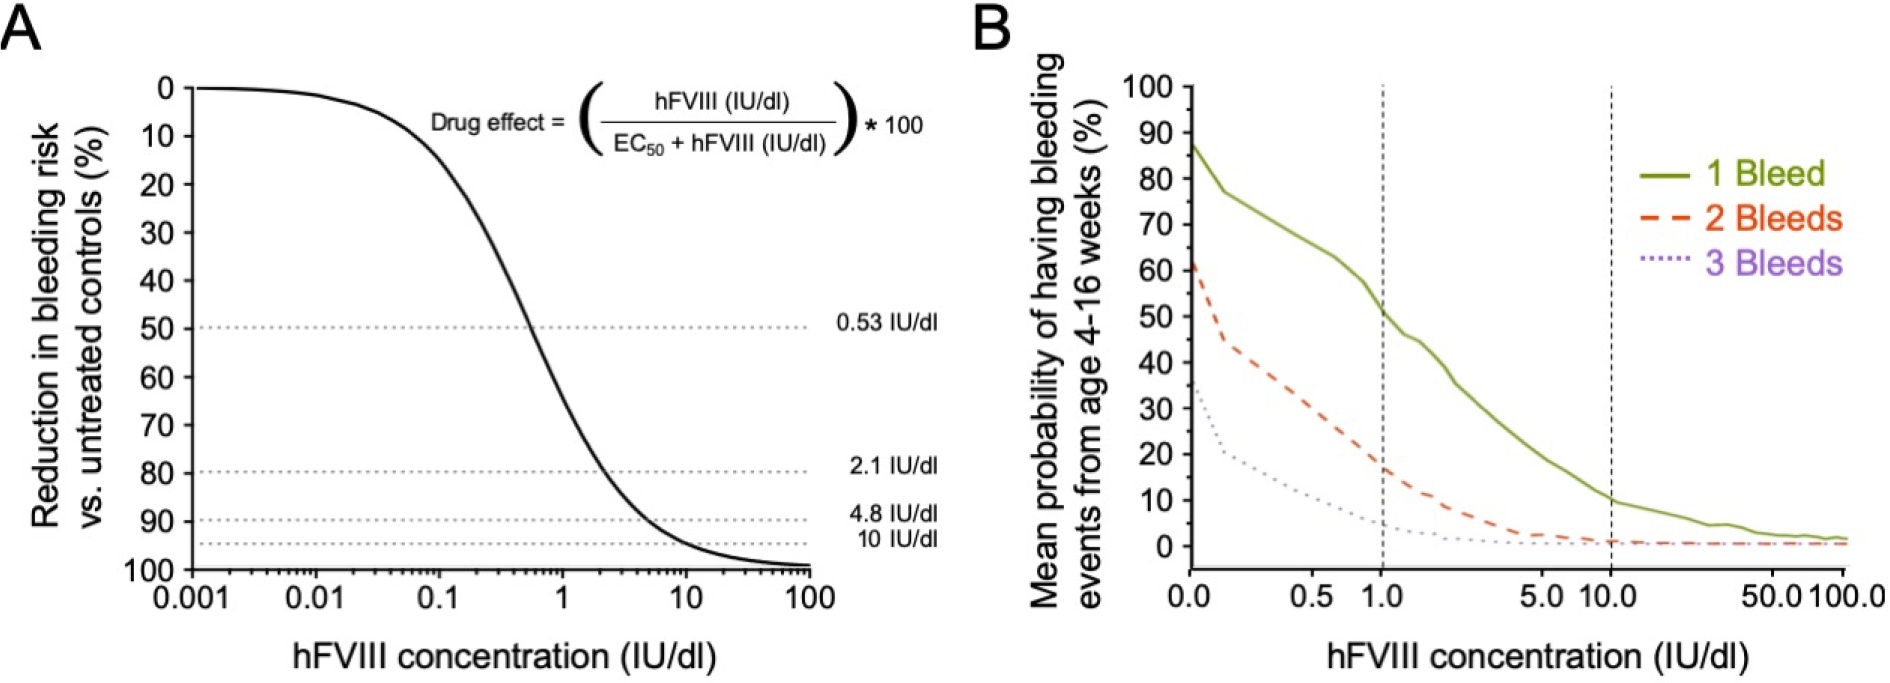
Results and conclusions: After 12 weeks of observation, both approaches significantly reduced bleeds per animal and increased the proportion of bleed-free animals compared with controls (43% vs 0%, respectively [AAV]; 75% vs 8%, respectively [injection]). Both approaches resulted in an anti-FVIII inhibitory response in 20% to 37% of treated animals, similar to HA patients. Inhibitory antibodies were refractory to clinical improvement (reduction of bleeds) only in the AAV-based prophylaxis. An integrated model-based analysis of data on FVIII exposure and bleeding events was performed. This predicted the bleeding risk at any given circulating FVIII activity. Specifically, 4.8 or 10 IU/dL FVIII (0.048 and 0.1 IU/mL, respectively) were predicted to reduce bleeding risk by 90% or 95%, respectively, compared with untreated controls. Our data establish the utility of the HA rat model in FVIII prophylaxis studies and describe how FVIII activity affects bleeding risk in this setting. These enable further studies on FVIII prophylaxis focusing on disease complications for an optimized treatment of HA patients.
Keywords: animal; genetic therapy; hemophilia A; models; risk; therapeutics.
© 2020 International Society on Thrombosis and Haemostasis.
Conflict of interest statement
DISCLOSURE OF CONFLICT OF INTEREST
K.M.L., M.P and B. W. are employees of Novo Nordisk A/S. M.S.L. is currently an employee of LEO Pharma A/S. M.H. is currently an employee of Zealand Pharma A/S. M.K-H is currently an employee of Ascendis Pharma A/S. P.M. receives research funding through competitive grants from the “Bayer Hemophilia Awards Program” and salary (spouse) from Bristol-Myers Squibb and CSL Behring. All other authors declare no conflict of interest. The generation of rat FVIIa used technology licensed to Spark Therapeutics, Inc. (Spark). The Children’s Hospital of Philadelphia as an Institution also holds equity in Spark.
Figures
Similar articles
-
Minimum factor VIII levels to prevent joint bleeding in mild hemophilia A.Blood Adv. 2023 Dec 12;7(23):7209-7215. doi: 10.1182/bloodadvances.2023011366. Blood Adv. 2023. PMID: 37871302 Free PMC article.
-
Comparative Effectiveness of Valoctocogene Roxaparvovec and Prophylactic Factor VIII Replacement in Severe Hemophilia A.Adv Ther. 2024 Jun;41(6):2267-2281. doi: 10.1007/s12325-024-02834-9. Epub 2024 Apr 15. Adv Ther. 2024. PMID: 38616241 Free PMC article. Clinical Trial.
-
Exploring the Potential Feasibility of Intra-Articular Adeno-Associated Virus-Mediated Gene Therapy for Hemophilia Arthropathy.Hum Gene Ther. 2020 Apr;31(7-8):448-458. doi: 10.1089/hum.2019.355. Epub 2020 Mar 18. Hum Gene Ther. 2020. PMID: 32079420
-
Translational Potential of Immune Tolerance Induction by AAV Liver-Directed Factor VIII Gene Therapy for Hemophilia A.Front Immunol. 2020 Apr 28;11:618. doi: 10.3389/fimmu.2020.00618. eCollection 2020. Front Immunol. 2020. PMID: 32425925 Free PMC article. Review.
-
Perspective - The case for zero bleeds and drug bioequivalence in the treatment of congenital hemophilia A in 2021.Blood Rev. 2021 Nov;50:100849. doi: 10.1016/j.blre.2021.100849. Epub 2021 May 7. Blood Rev. 2021. PMID: 34024681 Review.
Cited by
-
Pharmacokinetic analysis identifies a factor VIII immunogenicity threshold after AAV gene therapy in hemophilia A mice.Blood Adv. 2022 Apr 26;6(8):2628-2645. doi: 10.1182/bloodadvances.2021006359. Blood Adv. 2022. PMID: 35286375 Free PMC article.
References
-
- Srivastava A, Brewer AK, Mauser-Bunschoten EP, Key NS, Kitchen S, Llinas A, Ludlam CA, Mahlangu JN, Mulder K, Poon MC, Street A. Guidelines for the management of hemophilia. Haemophilia. 2013; 19: e1–47. - PubMed
-
- den Uijl IE, Fischer K, Van Der Bom JG, Grobbee DE, Rosendaal FR, Plug I. Clinical outcome of moderate haemophilia compared with severe and mild haemophilia. Haemophilia. 2009; 15: 83–90. - PubMed
-
- Valentino LA. Blood-induced joint disease: the pathophysiology of hemophilic arthropathy. J Thromb Haemost. 2010; 8: 1895–902. - PubMed
-
- Blanchette VS, Key NS, Ljung LR, Manco-Johnson MJ, van den Berg HM, Srivastava A, Subcommittee on Factor Viii FIX, Rare Coagulation Disorders of the S, Standardization Committee of the International Society on T, Hemostasis. Definitions in hemophilia: communication from the SSC of the ISTH. J Thromb Haemost. 2014; 12: 1935–9. - PubMed
-
- White GC, Rosendaal F, Aledort LM, Lusher JM, Rothschild C, Ingerslev J. Definitions in hemophilia. Recommendation of the scientific subcommittee on factor VIII and factor IX of the scientific and standardization committee of the International Society on Thrombosis and Haemostasis. Thromb Haemost. 2001; 85: 560. - PubMed
Publication types
MeSH terms
Substances
Grants and funding
LinkOut - more resources
Full Text Sources
Medical
