. 2020 May;287(10):2087-2104.
doi: 10.1111/febs.15301. Epub 2020 Apr 19.

The myokine meteorin-like (metrnl) improves glucose tolerance in both skeletal muscle cells and mice by targeting AMPKα2

Affiliations

The myokine meteorin-like (metrnl) improves glucose tolerance in both skeletal muscle cells and mice by targeting AMPKα2

Jung Ok Lee et al. FEBS J. 2020 May.

Abstract

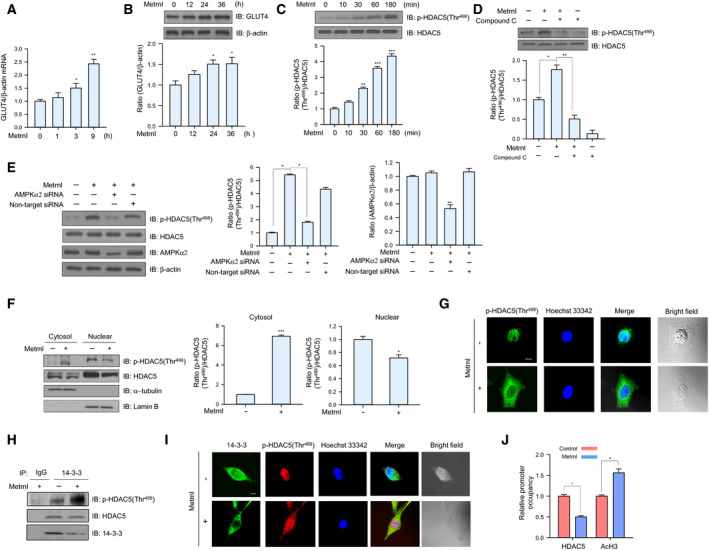
Meteorin-like (metrnl) is a recently identified adipomyokine that beneficially affects glucose metabolism; however, its underlying mechanism of action is not completely understood. We here show that the level of metrnl increases in vitro under electrical pulse stimulation and in vivo in exercised mice, suggesting that metrnl is secreted during muscle contractions. In addition, metrnl increases glucose uptake via the calcium-dependent AMPKα2 pathway in skeletal muscle cells and increases the phosphorylation of HDAC5, a transcriptional repressor of GLUT4, in an AMPKα2-dependent manner. Phosphorylated HDAC5 interacts with 14-3-3 proteins and sequesters them in the cytoplasm, resulting in the activation of GLUT4 transcription. An intraperitoneal injection of recombinant metrnl improved glucose tolerance in mice with high-fat-diet-induced obesity or type 2 diabetes, but not in AMPK β1β2 muscle-specific null mice. Metrnl improves glucose metabolism via AMPKα2 and is a promising therapeutic candidate for glucose-related diseases such as type 2 diabetes.

Keywords: AMPK; Metrnl; adipomyokine; glucose uptake; type 2 diabetes.


Conflict of interest statement

The authors declare no conflict of interest.

Figures

Fig. 1
Fig. 1
The level of metrnl increased in vitro and in vivo exercise models. (A, B) C2C12 myotubes were subjected to an acute or chronic electrical pulse stimulation (EPS), and the conditioned media (serum‐free DMEM) were analyzed using a metrnl ELISA kit. (C) Total mRNA was prepared from C2C12 myotubes after EPS, and RT‐PCR was performed using metrnl‐specific primers. PCR products were separated on a 1% agarose gel and visualized under ultraviolet light, with β‐actin as the positive control. (D) C2C12 myotubes were subjected to acute EPS. Lysates were analyzed by western blotting using anti‐phospho‐AMPKα1/2 (Thr183/Thr172) antibody, with AMPKα1/2 and β‐actin as the controls. (E) Total protein was prepared from C2C12 myotubes after chronic electric pulse stimulation, and western blot analysis was performed using metrnl, GLUT4, and phospho‐AMPKα1/2 (Thr183/Thr172) antibodies, with β‐actin and AMPKα1/2 as the controls. (F) C2C12 myoblasts were transiently transfected with metrnl siRNA for 24 h. Then, the cells were subjected on acute EPS. Cell lysates were analyzed by western blotting using anti‐phospho‐AMPKα (Thr183/Thr172), metrnl, AMPKα1/2 antibodies, with β‐actin as the controls. (G) BALB/C mice were divided into groups: sedentary (n = 10) and forced treadmill running (n = 10). Mice were sacrificed after chronic exercise, and the level of metrnl circulating in the blood was measured by ELISA. (H, I) Intraperitoneal (IP) GTT: blood glucose concentrations were measured after intraperitoneal administration of glucose (2 mg·kg−1 body weight). (J) Western blot analysis of phospho‐AMPKα1/2 (Thr183/Thr172), AMPKα1/2, phosphos‐TBC1D1 (Ser237), TBC1D1, and metrnl in thigh muscles of sedentary and exercise mice. β‐Actin is shown as a loading control. (K) Western blot analysis of metrnl in adipose tissues of sedentary and exercise mice. β‐Actin is shown as a loading control. Results are displayed as the mean ± SEM of five experiments. *P < 0.05, **P < 0.01, and ***P < 0.001 compared with control.
Fig. 2
Fig. 2
Metrnl stimulated glucose uptake via AMPK in skeletal muscle cells. (A) Dose‐dependent phosphorylation of AMPKα1/2 and ACC after metrnl treatment. C2C12 myoblasts were stimulated for 60 min at various metrnl concentrations. The cell lysates were analyzed by western blotting using antibodies against phospho‐AMPKα (Thr183/Thr172) and phospho‐ACC (Ser79), with AMPKα1/2 and ACC as the controls. (B) Time‐dependent phosphorylation of AMPKα1/2 and ACC after metrnl treatment. C2C12 cells were incubated with metrnl (100 ng·mL−1) for the indicated times. Cell lysates were analyzed by western blotting using antibodies against phospho‐AMPKα1/2 (Thr183/Thr172) and phospho‐ACC (Ser79), with AMPKα1/2 and ACC as the controls. (C) Dose‐dependent uptake of glucose with metrnl treatment. C2C12 myotubes were incubated with metrnl at several concentrations for 1 h and then assayed for glucose uptake. (D) Time‐dependent uptake of glucose with metrnl treatment. C2C12 myotubes were incubated with metrnl (100 ng·mL−1) for the indicated times and then assayed for glucose uptake. (E) C2C12 myotubes were treated with metrnl (100 ng·mL−1) for 1 h in the presence of compound C (10 µm) and then assayed for glucose uptake. (F) C2C12 myotubes were transiently transfected with AMPKα2 siRNA or non‐target siRNA, incubated with metrnl (100 ng·mL−1) for 1 h and then assayed for glucose uptake. Results are displayed as the mean ± SEM of five experiments. *P < 0.05, **P < 0.01, and ***P < 0.001.
Fig. 3
Fig. 3
Metrnl activated AMPK by increasing intracellular calcium concentrations. (A) For Ca2+ detection, C2C12 myoblasts were pre‐incubated in Fluo‐3 AM (10 µm) for 30 min. The Ca2+ response was measured after C2C12 incubated with metrnl (100 ng·mL−1). The Ca2+ concentration correlates with the fluorescence intensity. Scale bars, 100 μm (n = 5). (B) C2C12 myoblasts were pre‐treated with the membrane‐impermeable calcium chelator BAPTA‐AM (5 μm) and then incubated with metrnl (100 ng·mL−1) for 60 min. Cell lysates were analyzed by western blotting using anti‐phospho‐AMPKα1/2 (Thr183/Thr172) antibody, with AMPKα1/2 as the control. (C) C2C12 myoblasts were pre‐treated with the CaMKK2 inhibitor STO‐609 (5 µm) and then treated with metrnl (100 ng·mL−1). Cell lysates were analyzed by western blotting using anti‐phospho‐AMPKα1/2 (Thr183/Thr172) antibody, with AMPKα1/2 as the control. (D) C2C12 myotubes were treated with metrnl (100 ng·mL−1) for 1 h in the presence of STO‐609 (5 µm) and then assayed for glucose uptake. Results are displayed as the mean ± SEM of five experiments. *P < 0.05 and **P < 0.01.
Fig. 4
Fig. 4
Metrnl increased glucose uptake via the p38 MAPK pathway. (A) C2C12 myoblasts were stimulated for 60 min with several concentrations of metrnl. The cell lysates were analyzed by western blotting using anti‐phospho‐p38 MAPK antibody, with p38 MAPK as the control. (B) Time‐dependent phosphorylation of p38 MAPK after metrnl treatment. C2C12 myoblasts were incubated with metrnl (100 ng·mL−1) for the indicated times. Cell lysates were analyzed by western blotting using anti‐phospho‐p38 MAPK antibody, with p38 MAPK as the control. (C) C2C12 myoblasts were pre‐treated with compound C (10 μm), then treated with metrnl (100 ng·mL−1). Cell lysates were analyzed by western blotting using antibodies against phospho‐p38 MAPK and phospho‐AMPKα1/2(Thr183/Thr172), with p38 MAPK and AMPKα1/2 as the controls. (D) C2C12 myoblasts were transiently transfected with AMPKα2 siRNA or non‐target siRNA. Cell lysates were analyzed by western blotting using anti‐phospho‐p38 MAPK antibody, with p38, AMPKα2, and β‐actin as the controls. (E) C2C12 myotubes were treated with metrnl (100 ng·mL−1) for 1 h in the presence of SB202190 (20 µm) and then assayed for glucose uptake. (F) C2C12 myotubes were transiently transfected with p38 MAPK siRNA or non‐target siRNA, incubated with metrnl (100 ng·mL−1) for 1 h, and then assayed for glucose uptake. Results are displayed as the mean ± SEM of five experiments. *P < 0.05 and **P < 0.01.
Fig. 5
Fig. 5
Metrnl increased GLUT4 expression by stimulating HDAC5 phosphorylation. (A) Total mRNA from C2C12 myoblasts was prepared after metrnl (100 ng·mL−1) treatment for the indicated times, and real‐time qRT‐PCR was performed using GLUT4‐specific primers, with β‐actin mRNA as the positive control. (B) C2C12 myoblasts were treated with metrnl (100 ng·mL−1) for the indicated times. The cell lysates were analyzed by western blotting using anti‐GLUT4 antibody, with β‐actin as the control. (C) Time‐dependent phosphorylation of HDAC5 after metrnl treatment. C2C12 myoblasts were incubated with metrnl (100 ng·mL−1) for the indicated times. Cell lysates were analyzed by western blotting using anti‐phospho‐HDAC5 (Thr498) antibody, with HDAC5 as the control. (D) C2C12 myoblasts were pre‐treated with compound C (10 μm) and then treated with metrnl (100 ng·mL−1). Cell lysates were analyzed by western blotting using anti‐phospho‐HDAC5 (Thr498) antibody, with HDAC5 as the control. (E) C2C12 myoblasts were transiently transfected with AMPKα2 siRNA or non‐target siRNA. Cell lysates were analyzed by western blotting using antibodies against phospho‐HDAC5 (Thr498), AMPKα2, and HDAC5, with β‐actin as the controls. (F) C2C12 myoblasts were treated with metrnl (100 ng·mL−1). Cytosolic and nuclear proteins were extracted from the cells. HDAC5 phosphorylation was evaluated by western blot analysis, with HDAC5 as the control. Western blotting was performed on nuclear and cytosolic fractions to detect nuclear (lamin B) and cytosolic (α‐tubulin) marker proteins. (G) Representative images of phospho‐HDAC5 treated with metrnl for 30 min. Scale bars, 10 μm (n = 5). (H) C2C12 myoblasts were immunoprecipitated with anti‐14‐3‐3 antibody, followed by western blotting using anti‐phospho‐HDAC5, HDAC5, and 14‐3‐3 antibodies. (I) Representative images (phospho‐HDAC5 and 14‐3‐3 objective images) of cells treated with metrnl for 1 h. Scale bars, 10 μm (n = 5). (J) The relative occupancy of HDAC5 and AcH3 on the GLUT4 promoter was assessed using a ChIP analysis following 60 min of metrnl (100 ng·mL−1) treatment. The ChIP data represent the ratio of IP values for each region relative to the input. The results shown are from three independent experiments. Other results are displayed as the mean ± SEM of five experiments. *P < 0.05, **P < 0.01, and ***P < 0.001.
Fig. 6
Fig. 6
Metrnl stimulated GLUT4 translocation by AMPK‐induced TBC1D1 phosphorylation. (A) C2C12 myoblasts were stimulated for 1 h with different concentrations of metrnl. Cell lysates were analyzed by western blotting using anti‐phospho‐TBC1D1 (Ser237) antibody, with TBC1D1 as the control. (B) C2C12 myoblasts were incubated with metrnl (100 ng·mL−1) for the indicated times. Cell lysates were analyzed by western blotting using anti‐phospho‐TBC1D1 (Ser237) antibody, with TBC1D1 as the control. (C) C2C12 myoblasts were pre‐treated with compound C (10 μm) and then treated with metrnl (100 ng·mL−1). Cell lysates were analyzed by western blotting using anti‐phospho‐TBC1D1 (Ser237) antibody, with TBC1D1 as the control. (D) C2C12 myoblasts were transiently transfected with AMPKα2 siRNA or non‐target siRNA. Cell lysates were analyzed by western blotting using anti‐phospho‐TBC1D1 (Ser237), AMPKα2, TBC1D1 antibodies, with β‐actin as the controls. (E) C2C12 myoblasts treated with metrnl (100 ng·mL−1) or insulin (100 nm) were lysed and then fractionated into the plasma membrane and cytosol. Plasma membrane (PM) and cytosol proteins were analyzed by western blotting using anti‐GLUT4 antibody, with insulin receptor (IR) as a plasma membrane marker. (F) Representative images (GLUT4, Hoechst, and merged) of cells treated with metrnl for 1 h. Insulin (100 nm) was used as the positive control. Scale bars, 10 μm (n = 5). (G) Surface expression of GLUT4myc with metrnl treatment. L6‐GLUT4myc myotubes were incubated with metrnl at several time points for 3 h, and then, cell surface expression of GLUT4myc was detected using an antibody‐coupled colorimetric absorbance assay. (H) L6‐GLUT4myc myotubes were treated with metrnl (100 ng·mL−1) for 1 h in the presence of compound C (10 µm), and then, cell surface expression of GLUT4myc was detected using an antibody‐coupled colorimetric absorbance assay. (I, J) L6‐GLUT4myc myotubes were transiently transfected with AMPKα2 or TBC1D1 siRNA for 48 h before metrnl (100 ng·mL−1) treatment for 1 h. The cell surface expression of GLUT4myc was detected using an antibody‐coupled colorimetric absorbance assay. Results are displayed as the mean ± SEM of five experiments. *P < 0.05 and **P < 0.01.
Fig. 7
Fig. 7
Metrnl regulated AMPK phosphorylation and glucose uptake in mouse primary myoblast cells. (A) For Ca2+ detection, myoblasts were pre‐incubated with Fluo‐3 AM (5 μm) for 30 min. After metrnl treatment, the Ca2+ response was measured using a confocal microscope. Scale bars, 100 μm (n = 5). (B) Mouse primary myoblast cells were stimulated with metrnl for the indicated times. Cell lysates were analyzed by western blotting using antibodies against phospho‐AMPKα1/2(Thr183/Thr172) and phospho‐ACC (Ser79), with AMPKα1/2, ACC, and β‐actin as the controls. (C) Dose‐dependent glucose uptake with metrnl treatment. Primary myoblasts were differentiated into myotubes, incubated with metrnl at several concentrations for 1 h, and then assayed for glucose uptake. Results are displayed as the mean ± SEM of five experiments. *P < 0.05 and **P < 0.01.
Fig. 8
Fig. 8
Metrnl improved glucose tolerance in mouse models. (A) Recombinant GST‐metrnl and GST proteins were isolated using glutathione beads. The beads were washed three times with washing buffer, eluted, and analyzed by SDS/PAGE and subsequent Coomassie staining. (B) C2C12 cells were treated with recombinant GST‐metrnl. Cell lysates were analyzed with western blotting using anti‐phospho‐AMPKα1/2(Thr183/Thr172) antibody, with AMPKα1/2 and β‐actin as the controls. (C, D) Blood glucose concentrations and area under the curve (AUC) results for the glucose tolerance test (GTT) in C57BL/6 mice injected with recombinant GST‐metrnl or GST proteins. (E, F) Blood glucose concentrations and AUC results for the GTT in db/M+, db/db + GST, and db/db + GST‐metrnl mice. (G) Fasting glucose levels results for the GTT in db/M+, db/db + GST, and db/db + GST‐metrnl mice. The mice fasted for 12 h, and tail vein blood was used to measure in the blood glucose levels. (H) Representative images of immunohistochemical detection of p‐AMPKα1/2 (Thr183/Thr172) in the extensor digitorum longus (EDL) muscles of db/M+, db/db + GST, and db/db + GST‐metrnl mice (scale bar = 100 μm). (I, J) Blood glucose concentrations and AUC results for the GTT in mice fed an HFD or NCD in NCD‐GST, NCD‐GST‐metrnl, HFD‐GST, and HFD‐GST‐metrnl. (K) Fasting glucose levels in mice fed an HFD or NCD in NCD‐GST, NCD‐GST‐metrnl, HFD‐GST, and HFD‐GST‐metrnl. The mice fasted for 12 h and tail vein blood was used to measure in the blood glucose levels. (L) Body weight of high‐fat‐diet‐induced obesity C57BL/6 mice. Groups were compared using analysis of variance (ANOVA) with Duncan's multiple range test. Results are displayed as the mean ± SEM of five experiments. *P < 0.05, **P < 0.01, and ***P < 0.001.
Fig. 9
Fig. 9
Metrnl did not improve glucose tolerance in AMPK β1β2M‐KO mice. (A, B) Blood glucose concentrations and area under the curve (AUC) results for the glucose tolerance test (GTT) in AMPK β1β2M‐KO mice injected with recombinant GST‐metrnl or GST proteins. (C) Extensor digitorum longus (EDL) tissues isolated from AMPK WT and AMPK β1β2M‐KO mice were incubated with GST‐metrnl or GST (4 µg·mL−1), and then, the uptake of 2‐deoxyglucose (2‐DG) was measured. The data are presented as the mean relative 2‐DG uptake (dpm/[H3] ± SD) based on 12–13 mice per group. **P < 0.01 and ***P < 0.001.

References

    1. Booth FW, Roberts CK & Laye MJ (2012) Lack of exercise is a major cause of chronic diseases. Compr Physiol 2, 1143–1211. - PMC - PubMed
    1. Hoffmann C & Weigert C (2017) Skeletal muscle as an endocrine organ: the role of myokines in exercise adaptations. Cold Spring Harb Perspect Med 7, a029793. - PMC - PubMed
    1. Pedersen BK (2011) Muscles and their myokines. J Exp Biol 214, 337–346. - PubMed
    1. Barra NG, Chew MV, Holloway AC & Ashkar AA (2012) Interleukin‐15 treatment improves glucose homeostasis and insulin sensitivity in obese mice. Diabetes Obes Metab 14, 190–193. - PubMed
    1. Alvarez B, Carbó N, López‐Soriano J, Drivdahl RH, Busquets S, López‐Soriano FJ, Argilés JM & Quinn LS (2002) Effects of interleukin‐15 (IL‐15) on adipose tissue mass in rodent obesity models: evidence for direct IL‐15 action on adipose tissue. Biochim Biophys Acta 1570, 33–37. - PubMed

Publication types

MeSH terms