. 2020 Apr 7;31(4):710-725.e7.
doi: 10.1016/j.cmet.2020.02.016. Epub 2020 Mar 19.

Sugar-Induced Obesity and Insulin Resistance Are Uncoupled from Shortened Survival in Drosophila

Affiliations

Sugar-Induced Obesity and Insulin Resistance Are Uncoupled from Shortened Survival in Drosophila

Esther van Dam et al. Cell Metab. .

Abstract

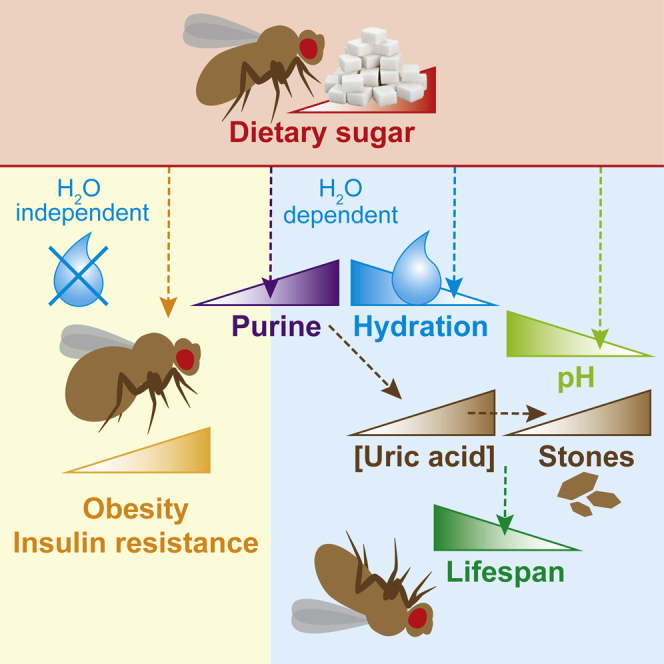
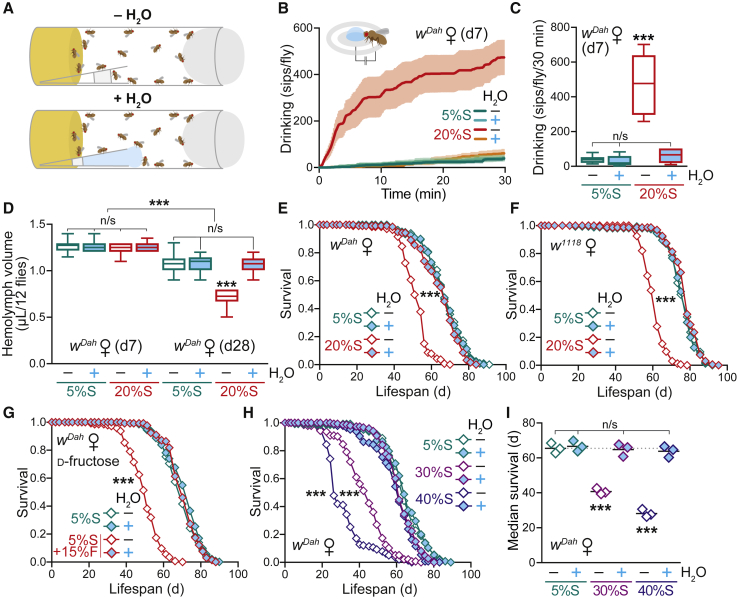
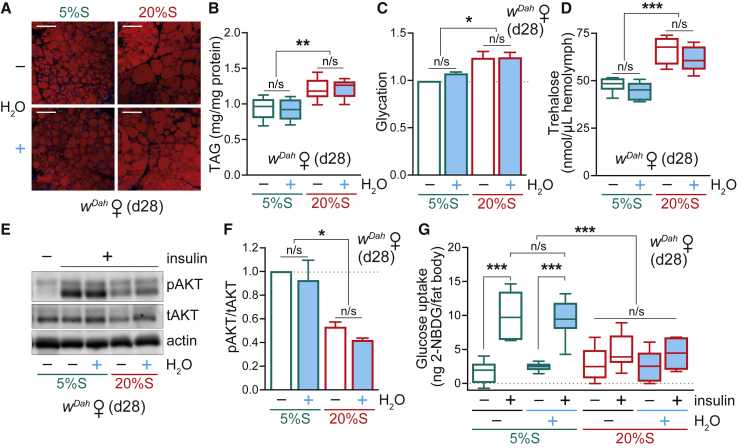
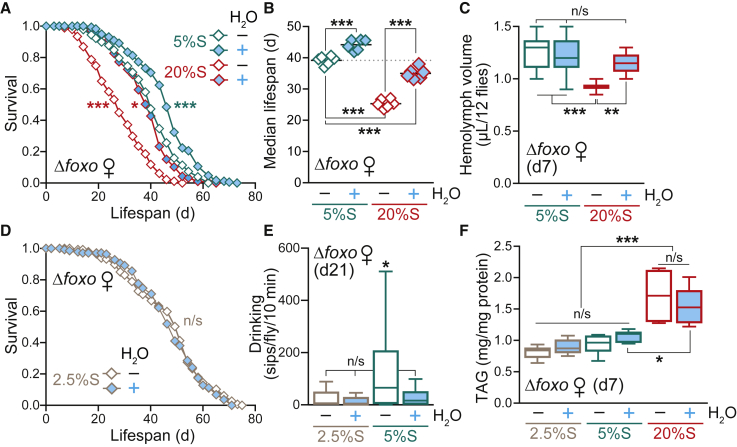
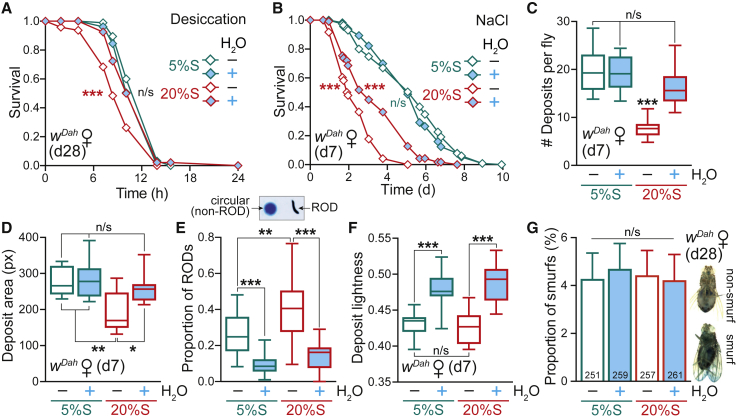
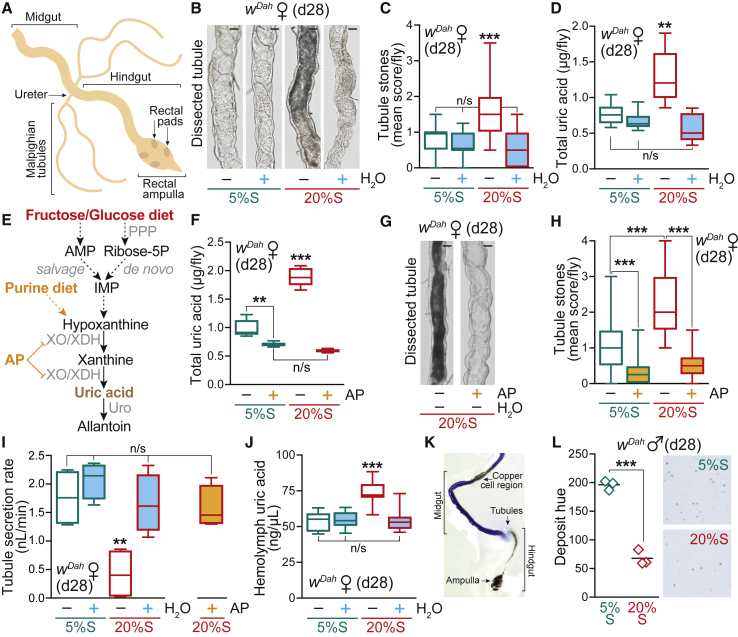
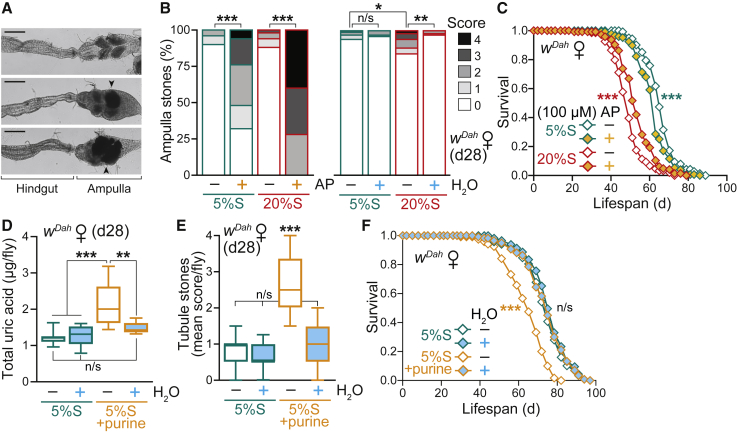
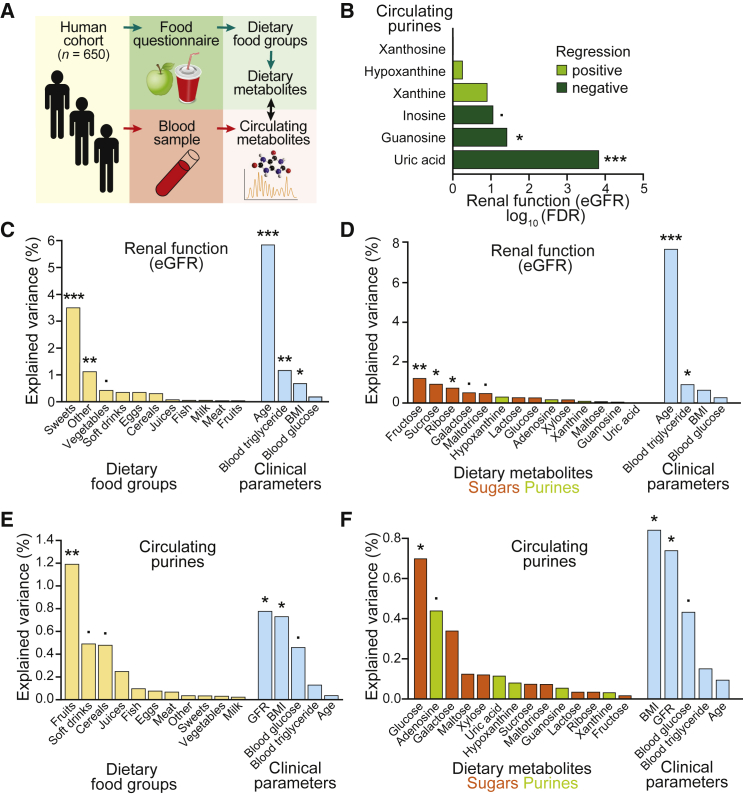
High-sugar diets cause thirst, obesity, and metabolic dysregulation, leading to diseases including type 2 diabetes and shortened lifespan. However, the impact of obesity and water imbalance on health and survival is complex and difficult to disentangle. Here, we show that high sugar induces dehydration in adult Drosophila, and water supplementation fully rescues their lifespan. Conversely, the metabolic defects are water-independent, showing uncoupling between sugar-induced obesity and insulin resistance with reduced survival in vivo. High-sugar diets promote accumulation of uric acid, an end-product of purine catabolism, and the formation of renal stones, a process aggravated by dehydration and physiological acidification. Importantly, regulating uric acid production impacts on lifespan in a water-dependent manner. Furthermore, metabolomics analysis in a human cohort reveals that dietary sugar intake strongly predicts circulating purine levels. Our model explains the pathophysiology of high-sugar diets independently of obesity and insulin resistance and highlights purine metabolism as a pro-longevity target.

Keywords: Drosophila; aging; diabetes; high-sugar diet; obesity; purine catabolism; uric acid; water imbalance.


Conflict of interest statement

Declaration of Interests The authors declare no competing interests.

Figures

None
Graphical abstract
Figure 1
Figure 1
A High-Sucrose Diet that Induces Thirst and Dehydration and Shortens Lifespan in Adult Drosophila Is Rescued by Water Supplementation (A) Scheme of the experimental setup, illustrating the supplementation of media vials with agar-filled tips as an ad libitum water source. (B and C) Drinking assay to quantify the thirst of WT (wDah) flies in response to a high-sugar diet. Females were pre-treated for 7 days on a standard (5%S) or high-sucrose (20%S) diet ± H2O. (B) Automated FlyPAD analysis showing the cumulative number of sips from an agar water source over 30 min. Data are means ± SEM of n = 6–8 individual flies per condition. (C) Box-and-whisker plots (min-max error bars) of the data from (B), analyzed by one-way ANOVA with Tukey correction (n/s, p > 0.05; ∗∗∗p < 0.001). (D) Hemolymph volume of WT females pre-treated for 7 and 28 days on 5%S or 20%S ± H2O. Hemolymph was extracted from groups of 12 flies (n = 12–20 replicates per condition). Data are presented as box-and-whisker plots (min-max error bars), analyzed by one-way ANOVA with Tukey correction (n/s, p > 0.05; ∗∗∗p < 0.001). (E) Lifespan of WT females on 5%S and 20%S ± H2O (n ∼ 150 per condition). (F) Lifespan of w1118 females on 5%S and 20%S ± H2O (n ∼ 165 per condition). (G) Lifespan of WT females ± H2O on a control diet (5%S) supplemented with 15% d-fructose (n ∼ 150 per condition). (H) Lifespan of WT females on 30%S and 40%S ± H2O (n ∼ 120–135 per condition). (I) Summary of median survival ± H2O for n = 3 independent lifespan experiments on control (5%S) and high sucrose (30%S and 40%S) diets. Data were analyzed by one-way ANOVA with Tukey correction (n/s, p > 0.05; ∗∗∗p < 0.001). Statistical analysis for all survival curves (E, F, G, and H) was performed by log-rank test (n/s, p > 0.05; ∗∗∗p < 0.001). See Table S2 for exact n numbers and p values. See also Figure S1.
Figure 2
Figure 2
Metabolic Effects of a High-Sucrose Diet and Water Supplementation in WT Adults (A) Lipid staining by Nile Red of abdominal fat body tissue from d28 WT (wDah) females fed on 5%S or 20%S ± H2O, imaged by confocal microscopy. Scale bar: 50 μm. (B) Whole body TAG levels in d28 WT females fed on 5%S or 20%S ± H2O. Data (n = 8 replicates, each with n = 4 flies per sample) are presented as box-and-whisker plots (min-max error bars), analyzed by one-way ANOVA with Tukey correction (n/s, p > 0.05; ∗∗p < 0.01). (C) Glycation damage in whole body d28 WT females fed on 5%S or 20%S ± H2O, assessed by western blotting (see Figure S2A). Data are means + SEM of n = 4 samples per condition, analyzed by one-way ANOVA with Tukey correction (n/s, p > 0.05; p < 0.05). (D) Circulating trehalose levels in the hemolymph of d28 WT females pre-treated on 5%S or 20%S ± H2O. Data (n = 6 replicates per condition, each with n = 12 flies per sample) are presented as box-and-whisker plots (min-max error bars), analyzed by one-way ANOVA with Tukey correction (n/s, p > 0.05; ∗∗∗p < 0.001). (E and F) Insulin response of abdominal fat body dissected from d28 WT females fed on 5%S or 20%S ± H2O (see Figure S2D). (E) Western blot for phospho-AKT with total AKT and actin as controls. (F) Quantification of bands by densitometry. Data are means + SEM of n = 3 experiments (each with n = 5 fat bodies per sample), analyzed by one-way ANOVA with Tukey correction (n/s, p > 0.05; p < 0.05). (G) Glucose uptake into abdominal fat body dissected from d28 WT females fed on 5%S or 20%S ± H2O (n = 6 replicates for “– insulin” and n = 10 replicates for “+ insulin,” each with n = 5 fat bodies per sample). Data are presented as box-and-whisker plots (min-max error bars), analyzed by one-way ANOVA with Tukey correction (n/s, p > 0.05; ∗∗∗p < 0.001). See also Figure S2.
Figure 3
Figure 3
Δfoxo Mutants Are Hypersensitive to Dietary Sugar (A) Lifespan of Δfoxo females on 5%S and 20%S ± H2O (n ∼ 195 flies per condition). Statistical analysis was performed by log-rank test (p < 0.05; ∗∗∗p < 0.001 against the 5%S – H2O control). See Table S2 for exact n numbers and p values. (B) Summary of median survival data for n = 6 independent Δfoxo lifespan experiments, analyzed by one-way ANOVA with Tukey correction (∗∗∗p < 0.001). (C) Hemolymph volume of Δfoxo females pre-treated for 7 days on 5%S or 20%S ± H2O (n = 12 replicates per condition, each with n = 12 flies per sample). Data are presented as box-and-whisker plots (min-max error bars), analyzed by one-way ANOVA with Tukey correction (n/s, p > 0.05; ∗∗p < 0.01; ∗∗∗p < 0.001). (D) Lifespan of Δfoxo females on 2.5%S ± H2O (n ∼ 150 flies per condition). Statistical analysis was performed by log-rank test (n/s, p > 0.05). See Table S2 for exact n numbers and p values. (E) Drinking assay of Δfoxo females pre-treated for 21 days on 2.5%S, 5%S, or 20%S ± H2O measured over 10 min by FlyPAD (n = 30 individual flies per condition). Data are presented as box-and-whisker plots (min-max error bars), analyzed by one-way ANOVA with Tukey correction (n/s, p > 0.05; p < 0.05). (F) Whole body TAG levels of Δfoxo females pre-treated for 7 days on 2.5%S, 5%S, or 20%S ± H2O (n = 5–6 replicates per condition, each with n = 4 flies per sample). Data are presented as box-and-whisker plots (min-max error bars), analyzed by one-way ANOVA with Tukey correction (n/s, p > 0.05; p < 0.05; ∗∗∗p < 0.001). See also Figure S3.
Figure 4
Figure 4
Effects of a High-Sugar Diet on Stress Responses and Gut Physiology (A and B) Stress response of WT (wDah) females pre-treated on 5%S or 20%S ± H2O, then exposed to (A) desiccation at d28 (n ∼ 105 flies per condition) and (B) high salt at d7 (500 mM NaCl, n ∼ 100–120 flies per condition). Statistical analysis of survival curves was performed by log-rank test (n/s, p > 0.05; ∗∗∗p < 0.001). See Table S2 for exact n numbers and p values. (C–F) Analysis of fly excreta from WT females pre-treated in vials for 7 days on 5%S or 20%S ± H2O, then transferred to dishes for 24 h (n = 5 flies per plate). Food was supplemented with 2.5% w/v blue dye, while the agar for the water supplementation was undyed (see Figure S4D). Data are presented as box-and-whisker plots (min-max error bars), analyzed by one-way ANOVA with Tukey correction (n/s, p > 0.05; p < 0.05; ∗∗p < 0.01; ∗∗∗p < 0.001). (C) Number of deposits per fly recorded over 24 h (n = 10 plates per condition). (D) Mean area of deposits (n = 10 plates per condition). (E) Proportion of RODs (reproductive oblong deposits) (n = 21–24 plates per condition). (F) Mean lightness of deposits on a 0–1 scale (n = 10 plates per condition). (G) The proportion of WT females exhibiting a Smurf phenotype at d28. Inset: example image of a non-Smurf fly, where the blue dye is restricted solely to the digestive tract, and a Smurf fly, where gut barrier integrity is compromised and the blue dye disperses throughout the fly body. Data are means + SEM of n = 20 vials per condition, analyzed by one-way ANOVA with Tukey correction (n/s, p > 0.05). The total number of flies scored per condition is indicated. See also Figure S4.
Figure 5
Figure 5
A High-Sugar Diet Induces Uric Acid Deposition and Tubule Dysfunction (A) Diagram of the Drosophila lower digestive tract, terminating in the rectal ampulla. The Malpighian (renal) tubules connect at the junction between the midgut and the hindgut. (B) Light microscopy images of dissected tubules from WT (wDah) females fed for 28 days on 5%S or 20%S ± H2O. Scale bar: 25 μm. (C) Tubule phenotype scoring of WT females maintained for 28 days on 5%S or 20%S ± H2O. Data (n = 50 flies per condition) are presented as box-and-whisker plots (min-max error bars), analyzed by Kruskal-Wallis test with Dunn correction (n/s, p > 0.05; ∗∗∗p < 0.001). See Figure S5A for the scoring scale. (D) Uric acid content of whole WT females fed for 28 days on 5%S or 20%S ± H2O (n = 6 replicates per condition, each with n = 5 flies per sample). Data are presented as box-and-whisker plots (min-max error bars), analyzed by one-way ANOVA with Tukey correction (n/s, p > 0.05; ∗∗p < 0.01). (E) Biochemical pathway showing how dietary sugars such as d-glucose and d-fructose can lead to enhanced purine metabolism and to the formation of uric acid. Following the action of enzymes such as hexokinase, adenosine monophosphate (AMP) is formed and can be converted to the purine precursor inosine monophosphate (IMP). Alternatively, the purine precursor ribose-5-P is formed via the pentose phosphate pathway (PPP) by de novo biosynthesis. The drug allopurinol (AP) prevents uric acid production by inhibiting the enzyme xanthine oxidase (XO)/xanthine dehydrogenase (XDH). Urate oxidase (Uro) catalyzes the degradation of uric acid to allantoin. The enzyme XO/XDH (encoded by rosy in Drosophila) and Uro are strongly expressed in the tubules (>20-fold and >13,000-fold higher than in the hindgut of females, respectively; Leader et al., 2018). (F) Uric acid content of whole WT females fed for 28 days on 5%S or 20%S ± AP (1 mM). Box-and-whisker plots (min-max error bars) of n = 5 replicates per condition (each with n = 5 flies per sample), analyzed by one-way ANOVA with Tukey correction (n/s, p > 0.05; ∗∗p < 0.01; ∗∗∗p < 0.001). (G) Light microscopy images of dissected tubules from WT females fed for 28 days on 20%S ± AP (1 mM). Scale bar: 25 μm. (H) Tubule phenotype scoring of WT females maintained for 28 days on 5%S or 20%S ± AP (1 mM). Data (n = 50 flies per condition, except n = 25 for 20%S + AP) are presented as box-and-whisker plots (min-max error bars), analyzed by Kruskal-Wallis test with Dunn correction (∗∗∗p < 0.001). See Figure S5A for the scoring scale. (I) Secretion rates of tubules from WT females pre-treated for 28 days on 5%S or 20%S ± H2O or ± AP (1 mM). See Figure S5E for a diagram of the secretion assay. Data (n = 4 replicates per condition) are presented as box-and-whisker plots (min-max error bars), analyzed by one-way ANOVA with Tukey correction (n/s, p > 0.05; ∗∗p < 0.01). (J) Hemolymph uric acid concentration from WT females fed for 28 days on 5%S or 20%S ± H2O. Data (n = 8 replicates per condition, each with n = 12 flies per sample) are presented as box-and-whisker plots (min-max error bars), analyzed by one-way ANOVA with Tukey correction (n/s, p > 0.05; ∗∗∗p < 0.001). (K) Dissected WT female gut after feeding with the pH indicator dye bromophenol blue (0.5% w/v) showing acidification of the hindgut (posterior to the tubules) and the rectal ampulla. The copper cell region in the midgut, known to be acidified, is also apparent. (L) Physiological acidification in response to the high-sugar diet. WT males were pre-treated for 28 days on 5%S or 20%S, then incubated in plates with medium containing the pH indicator dye bromocresol purple (0.5% w/v) for 48 h. Mean hue of deposits (n = 3 plates per condition), analyzed by unpaired two-tailed Student’s t test (∗∗∗p < 0.001). Inset: scan of a typical plate illustrating the pH-dependent color shift (see Figure S5H). See also Figure S5.
Figure 6
Figure 6
Pharmacological Treatments and Dietary Interventions Targeting Purine Metabolism Impact on Lifespan (A) Light microscopy images of dissected ampulla: above, a clear ampulla with rectal pads visible; below, examples of stones present in the ampulla. Scale bar: 100 μm. (B) Rectal ampulla stone phenotype scoring of WT (wDah) females pre-treated for 28 days on 5%S or 20%S ± AP (1 mM) (n = 50 flies per condition, except n = 25 for 20%S + AP) and 5%S or 20%S ± H2O (n = 100 flies per condition). Data were analyzed by Kruskal-Wallis test with Dunn correction (n/s, p > 0.05; p < 0.05; ∗∗p < 0.01; ∗∗∗p < 0.001). See Figure S6B for the scoring scale. (C) Allopurinol treatment (100 μM) extends the survival of WT females on a high-sucrose diet (20%S ± AP), despite shortening lifespan on control food (5%S ± AP) (n ∼ 150 flies per condition). (D) Uric acid content of WT females is elevated after 28 days on a high purine diet (5%S + 10 mM purine), and rescued by water supplementation. Data (n = 8 replicates per condition, each with n = 5 flies per sample) are presented as box-and-whisker plots (min-max error bars), analyzed by one-way ANOVA with Tukey correction (n/s, p > 0.05; ∗∗p < 0.01; ∗∗∗p < 0.001). (E) Tubule phenotype scoring of females maintained for 28 days on a high-purine diet (5%S + 10 mM purine) ± H2O. Data (n = 50–60 flies per condition) are presented as box-and-whisker plots (min-max error bars), analyzed by Kruskal-Wallis test with Dunn correction (n/s, p > 0.05; ∗∗∗p < 0.001). See Figure S5A for the scoring scale. (F) A high purine diet (10 mM) shortens lifespan, which is fully rescued by water supplementation (n ∼ 120 flies per condition). Statistical analysis of survival curves (C and F) was performed by log-rank test (n/s, p > 0.05; ∗∗∗p < 0.001). See Table S2 for exact n numbers and p values. See also Figure S6.
Figure 7
Figure 7
Human Metabolomics Analysis Links Dietary Sugar Intake with Renal Function and Circulating Purine Levels (A) Scheme of the experimental setup to assess dietary intake and circulating metabolites in a German population cohort (n = 650). Dietary habits and food choices were recorded via the EPIC food frequency questionnaire for the past 12 months on the day of examination and used to impute dietary intake of individual metabolites. Blood was drawn at a single time point, and the serum was subjected to metabolomics by LC-MS to obtain levels of circulating metabolites. (B) Linear model of eGFR predicting concentrations of each individual circulating purine. Logarithmic FDRs are plotted as bars and color-coded for positive (light green) or negative (dark green) regressions. (C and D) Explained variance of diet on eGFR via PERMANOVA (·p < 0.1; p < 0.05; ∗∗p < 0.01; ∗∗∗p < 0.001). Clinical parameters are separated from dietary food groups for visual clarity. (C) Analysis of variance for dietary food groups. The food items contributing significantly from the “other” group were fats and oils (∗∗) and non-alcoholic beverages (). (D) Analysis of variance for imputed dietary metabolites, color-coded in orange for sugars and green for purines. (E and F) Explained variance of diet on the levels of circulating purines in the serum via PERMANOVA (·p < 0.1; p < 0.05; ∗∗p < 0.01). Clinical parameters are separated from dietary food groups for visual clarity. Analysis of variance for dietary food groups (E), and for imputed dietary metabolites, color-coded in orange for sugars and green for purines (F). See also Figure S7.

Comment in

References

    1. Anker S.D., Doehner W., Rauchhaus M., Sharma R., Francis D., Knosalla C., Davos C.H., Cicoira M., Shamim W., Kemp M. Uric acid and survival in chronic heart failure: validation and application in metabolic, functional, and hemodynamic staging. Circulation. 2003;107:1991–1997. - PubMed
    1. Baker K.D., Thummel C.S. Diabetic larvae and obese flies-emerging studies of metabolism in Drosophila. Cell Metab. 2007;6:257–266. - PMC - PubMed
    1. Barr W.G. Uric Acid. In: Walker H.K., Hall W.D., Hurst J.W., editors. Clinical Methods: The History, Physical, and Laboratory Examinations. Butterworths; 1990. pp. 770–772. - PubMed
    1. Bass T.M., Grandison R.C., Wong R., Martinez P., Partridge L., Piper M.D. Optimization of dietary restriction protocols in Drosophila. J. Gerontol. A Biol. Sci. Med. Sci. 2007;62:1071–1081. - PMC - PubMed
    1. Bell D.S. Beware the low urine pH--the major cause of the increased prevalence of nephrolithiasis in the patient with type 2 diabetes. Diabetes Obes. Metab. 2012;14:299–303. - PubMed

Publication types

LinkOut - more resources