. 2020 Apr 14;14(4):648-662.
doi: 10.1016/j.stemcr.2020.02.006. Epub 2020 Mar 19.

Generation of Retinal Pigment Epithelial Cells Derived from Human Embryonic Stem Cells Lacking Human Leukocyte Antigen Class I and II

Affiliations

Generation of Retinal Pigment Epithelial Cells Derived from Human Embryonic Stem Cells Lacking Human Leukocyte Antigen Class I and II

Sandra Petrus-Reurer et al. Stem Cell Reports. .

Abstract

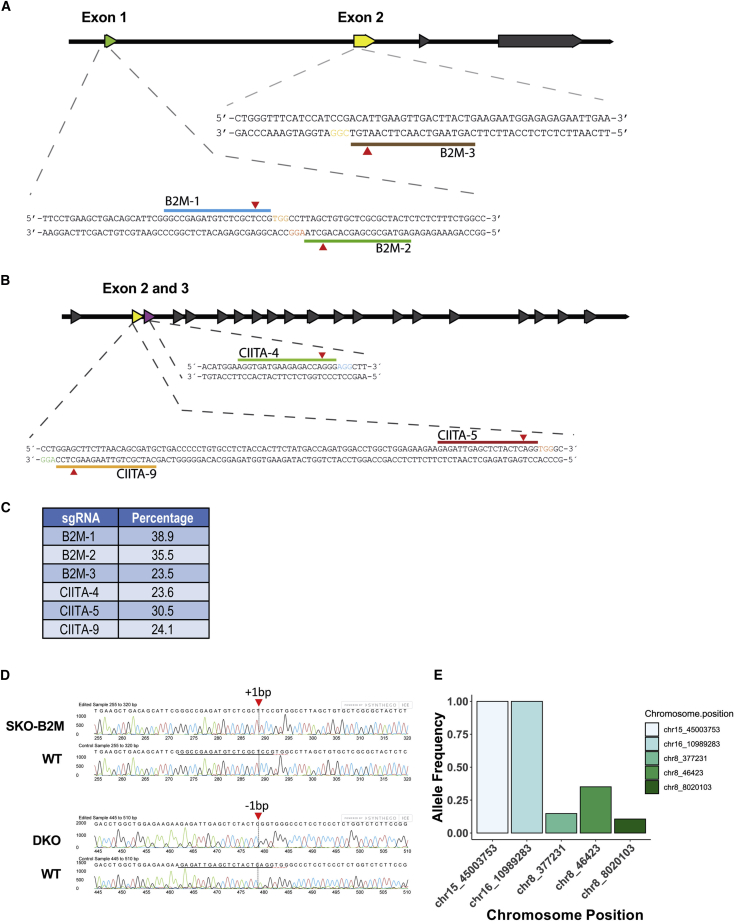
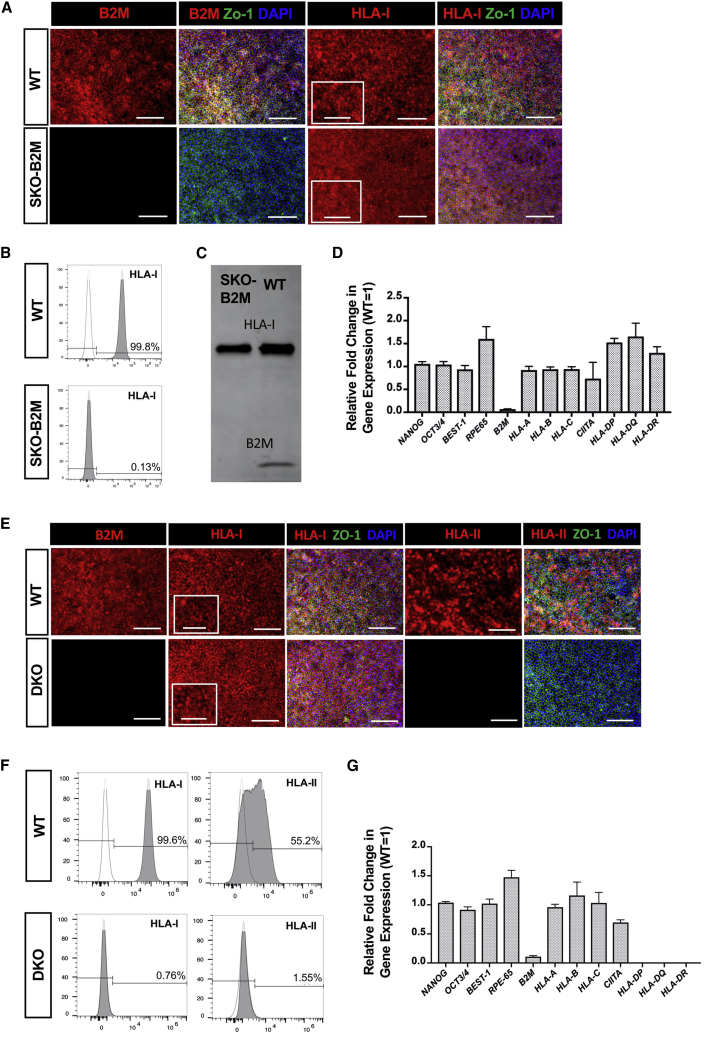
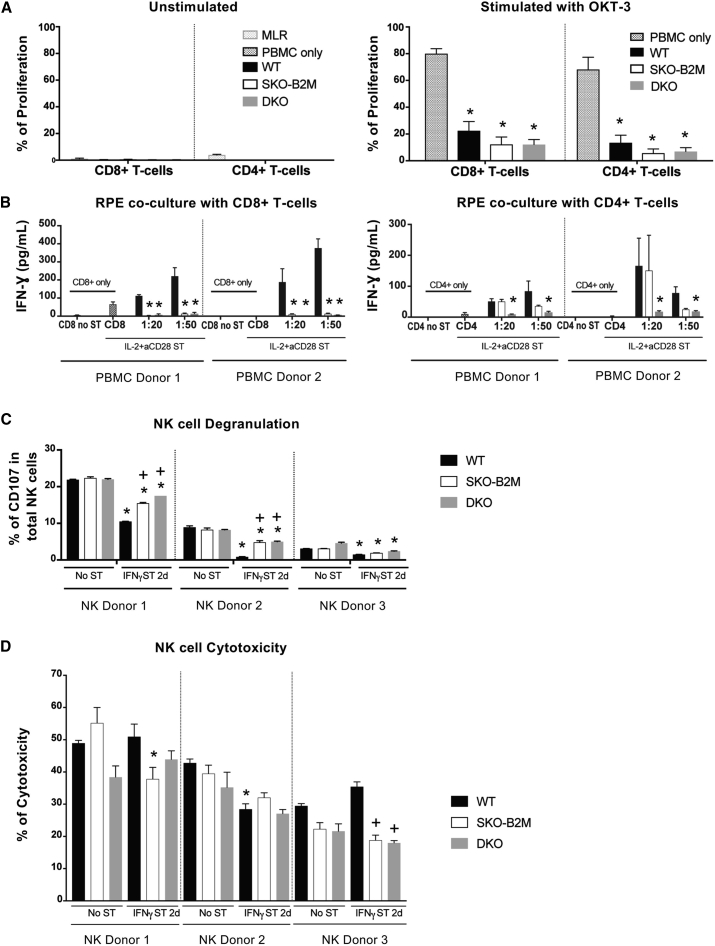
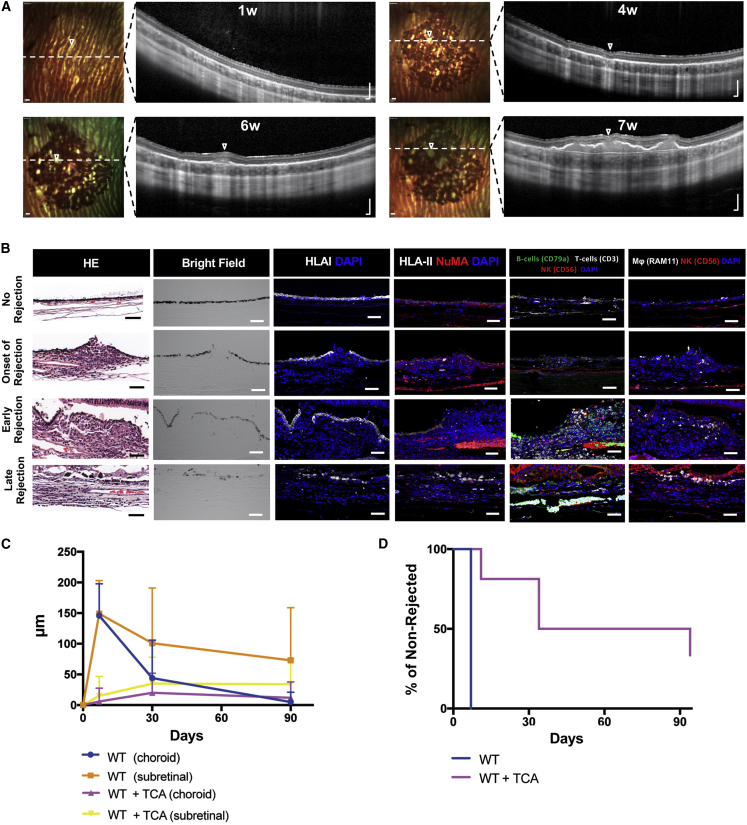
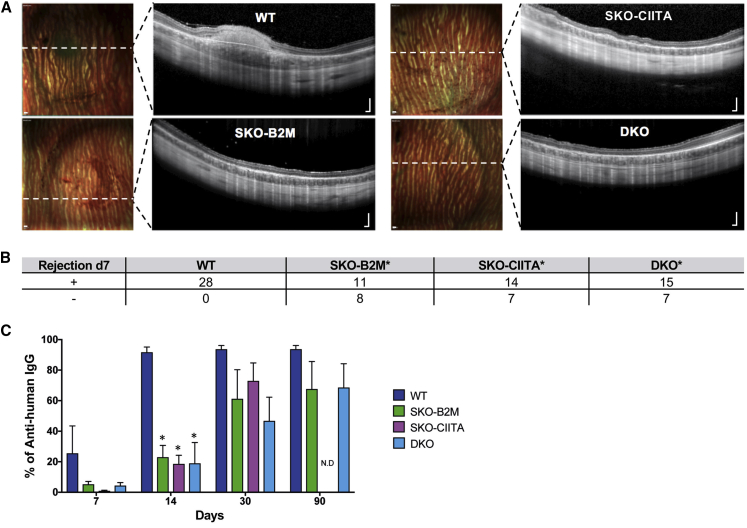
Human embryonic stem cell-derived retinal pigment epithelial (hESC-RPE) cells could serve as a replacement therapy in advanced stages of age-related macular degeneration. However, allogenic hESC-RPE transplants trigger immune rejection, supporting a strategy to evade their immune recognition. We established single-knockout beta-2 microglobulin (SKO-B2M), class II major histocompatibility complex transactivator (SKO-CIITA) and double-knockout (DKO) hESC lines that were further differentiated into corresponding hESC-RPE lines lacking either surface human leukocyte antigen class I (HLA-I) or HLA-II, or both. Activation of CD4+ and CD8+ T-cells was markedly lower by hESC-RPE DKO cells, while natural killer cell cytotoxic response was not increased. After transplantation of SKO-B2M, SKO-CIITA, or DKO hESC-RPEs in a preclinical rabbit model, donor cell rejection was reduced and delayed. In conclusion, we have developed cell lines that lack both HLA-I and -II antigens, which evoke reduced T-cell responses in vitro together with reduced rejection in a large-eyed animal model.

Keywords: HLA-I knockout; HLA-II knockout; cellular therapy; human embryonic stem cells; immune evasion; retinal pigment epithelium; subretinal injection; transplantation rejection; xenogeneic transplant; xenograft model.


Figures

Figure 1
Figure 1
B2M and CIITA sgRNA Evaluation (A) Schematic illustration of the human B2M locus, including sgRNA target sites. (B) Schematic illustration of the human CIITA locus, including sgRNA target sites. (C) Frequency of indel occurrence generated by each sgRNA in CRISPR/Cas9-edited HEK293T cells. (D) Indel analysis obtained by Sanger sequencing in hESC SKO-B2M (top chromatogram) and hESC DKO (bottom chromatogram). (E) Bar graph representing allele frequency in specific chromosomal positions from off-target analysis of whole-genome sequencing data. See also Figure S1, Tables S3, and S4.
Figure 2
Figure 2
Characterization of the SKO-B2M and DKO hESC-RPEs (A) Immunofluorescence images of WT and SKO-B2M showing B2M, HLA-I, and ZO-1 expression. Magnified box for HLA-I shows dotted extracellular pattern in WT cells. (B) Representative flow cytometry histogram showing the percentage of WT and SKO-B2M expressing extracellular HLA-I. Dotted line histogram shows HLA-I FMO (negative control used for gating). (C) Western blot showing the HLA-I and B2M protein expression of WT and SKO-B2M cells. (D) Gene expression analysis of HLA- and RPE-related genes in the targeted hESC-RPEs. Values are normalized to GAPDH and displayed as relative to WT cells. (E) Immunofluorescence images of WT and DKO cells showing B2M, HLA-I, and ZO-1 expression. Magnified box for HLA-I shows dotted extracellular pattern in WT cells. (F) Representative flow cytometry histogram showing the percentage of WT and DKO cells expressing extracellular HLA-I. Dotted line histogram shows HLA-I FMO (negative control used for gating). (G) Gene expression analysis of pluripotent and HLA-related genes in the targeted hESC-RPEs. Values are normalized to GAPDH and displayed as relative to WT. Bars represent mean ± SEM from three independent experiments. Scale bars, 100 μm (A and E) and 50 μm zoom-in (A and E). Molecular weight of HLA-I = 43 kDa; B2M = 12 kDa. See also Figure S2.
Figure 3
Figure 3
In Vitro Immunogenicity Assessment of WT, SKO-B2M, and DKO hESC-RPEs (A) Graphs representing the percentage of proliferative CD8+ or CD4+ cells upon 5 days co-culture of PBMCs from three different donors with 2 days IFN-γ 100 ng/mL pre-stimulated WT, SKO-B2M, and DKO cells at 1:1 hESC-RPE:PBMC ratio with (right panel) or without (left panel) OKT-3 stimulation. Unstimulated PBMCs only and mixed allogenic PBMC donors (mixed lymphocyte reactions [MLR]) were used as negative and positive controls, respectively, to assess T-cell induction upon hESC-RPE co-culture; and OKT-3 stimulated PBMCs were used as positive control to evaluate suppression of T-cell proliferation upon hESC-RPE co-culture. (B) Bar graphs showing the secretion of IFN-γ produced by either CD8+ or CD4+ isolated T-cells from two different donors after 5 days co-culture with WT, SKO-B2M, or DKO cells at 1:20 and 1:50 ratios (hESC-RPE:PBMC) with the presence of IL-2+aCD28 stimulation (and 2 days IFN-γ 100 ng/mL hESC-RPE pre-stimulation). CD8+ or CD4+ only were used as negative controls unstimulated (No ST) or IL2+aCD28 stimulated (ST). (C) Bar graphs showing the percentage of NK degranulation by CD107-positive expression in the total NK cells when co-cultured with WT, SKO-B2M, and DKO cells unstimulated or 2 days IFN-γ 100 ng/mL pre-stimulation from three different donors. (D) Bar graph showing the percentage of cytotoxicity of the unstimulated or 2 days IFN-γ 100 ng/mL pre-stimulated WT, SKO-B2M, or DKO cells (target) measured by chromium release of the killed cells by the freshly isolated and overnight IL-2-stimulated NK cells (effector) from three different donors at 10:1 effector:target ratio. NK cells were freshly isolated from human blood PBMCs, further separated (CD56 MACS isolation kit) and activated with IL-2 overnight before co-culture with hESC-RPEs. Bars represent mean ± SEM from three independent experiments. (A) p < 0.0001 compared with PBMC only with OKT-3; (B) p < 0.0001 (CD8+), +p < 0.05 (CD4+) compared with respective WT; (C) p < 0.0001 compared with respective No ST cell line per donor, +p < 0.0001 compared with respective WT per donor; and (D) p < 0.01 compared with respective No ST cell line per donor, +p < 0.001 compared with respective WT per donor. See also Figures S3 and S4.
Figure 4
Figure 4
Transplantation of WT hESC-RPEs in the Xenograft Model (A) Time course multicolor-confocal scanning laser ophthalmoscopy and SD-OCT images of the injected areas with WT cells in the subretinal space under TCA treatment. Dashed white lines indicate SD-OCT scan plane. Open arrowheads indicate focal areas of rejection. (B) Bright-field, H&E, and immunofluorescence images representing different rejection patterns after subretinal injection of WT cells. Images show the expression of human HLA-I, HLA-II, and NuMA, in addition to rabbit immune cells: CD3 for T-cells, CD56 for NK cells, CD79a for B cells, and RAM11 for macrophages. (C) Graph showing the thickness of either the choroidal or the subretinal space of eyes transplanted with WT cells with or without TCA immunosuppression through time (days d0, d30, d60, and d90). The rejection thickness was obtained by subtracting the values of a non-rejected area as described in the Experimental Procedures section. (D) Kaplan-Meyer graph representing the number of non-rejected eyes up to 90 days after transplantation of WT cells or WT cells + TCA. Bars represent mean ± SEM from WT = 18; WT + TCA = 15 eyes for all time points in (C) (the value of four eyes in the d90 time point was carried forward from the last observation due to their planned enucleation at d30); and WT = 18; WT + TCA = 15 eyes in (D). Scale bars, 200 μm (A) and 50 μm (B).
Figure 5
Figure 5
Transplantation of SKO-B2M, SKO-CIITA, and DKO hESC-RPEs in the Xenograft Model (A) Day 7 multicolor-confocal scanning laser ophthalmoscopy and SD-OCT images of representative rabbits that received WT, SKO-B2M, SKO-CIITA, or DKO cells without TCA treatment. Dashed white lines indicate the SD-OCT scan plane. (B) Table summarizing the number of rejected or non-rejected eyes at day 7 upon transplantation of WT, SKO-B2M, SKO-CIITA, or DKO cells. (C) Bar graph showing the percentage of anti-human immunoglobulin G antibodies measured by flow cytometry present in rabbit serums after transplantation of WT, SKO-B2M, SKO-CIITA, or DKO without TCA that bound to WT cells at 7, 14, 30, and 90 days. Bars represent mean ± SEM from five rabbits per condition. In (B), p < 0.001 compared with WT; and (C), p < 0.001 compared with respective WT per time point. Scale bars, 200 μm (A). N.D., no data available. See also Figure S5.

References

    1. Bae S., Park J., Kim J.S. Cas-OFFinder: a fast and versatile algorithm that searches for potential off-target sites of Cas9 RNA-guided endonucleases. Bioinformatics. 2014;30:1473–1475. - PMC - PubMed
    1. Bradley J.A., Bolton E.M., Pedersen R.A. Stem cell medicine encounters the immune system. Nat. Rev. Immunol. 2002;2:859–871. - PubMed
    1. Choudhary P., Booth H., Gutteridge A., Surmacz B., Louca I., Steer J., Kerby J., Whiting P.J. Directing differentiation of pluripotent stem cells toward retinal pigment epithelium lineage. Stem Cells Transl. Med. 2017;6:490–501. - PMC - PubMed
    1. da Cruz L., Fynes K., Georgiadis O., Kerby J., Luo Y.H., Ahmado A., Vernon A., Daniels J.T., Nommiste B., Hasan S.M. Phase 1 clinical study of an embryonic stem cell-derived retinal pigment epithelium patch in age-related macular degeneration. Nat. Biotechnol. 2018;36:328–337. - PubMed
    1. de Rham C., Villard J. How to cross immunogenetic hurdles to human embryonic stem cell transplantation. Semin. Immunopathol. 2011;33:525–534. - PubMed

Publication types

MeSH terms

Substances