. 2020 May 1;204(9):2360-2373.
doi: 10.4049/jimmunol.2000028. Epub 2020 Mar 20.

A Defect in Thymic Tolerance Causes T Cell-Mediated Autoimmunity in a Murine Model of COPA Syndrome

Affiliations

A Defect in Thymic Tolerance Causes T Cell-Mediated Autoimmunity in a Murine Model of COPA Syndrome

Zimu Deng et al. J Immunol. .

Abstract

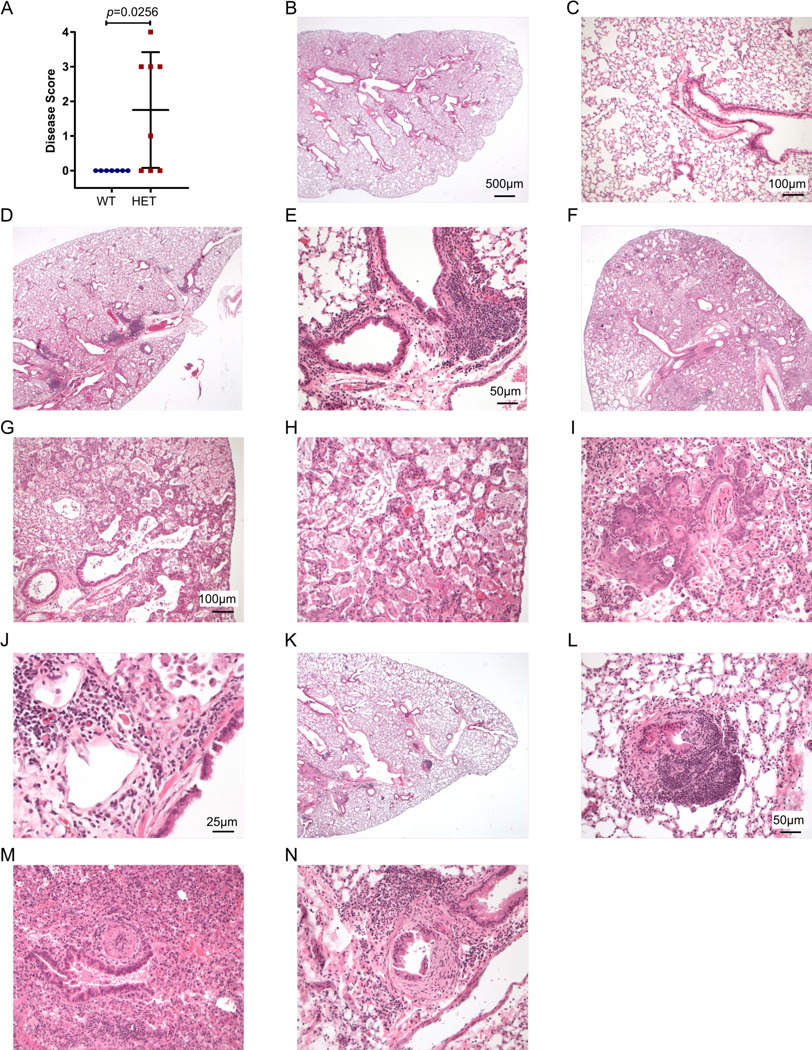
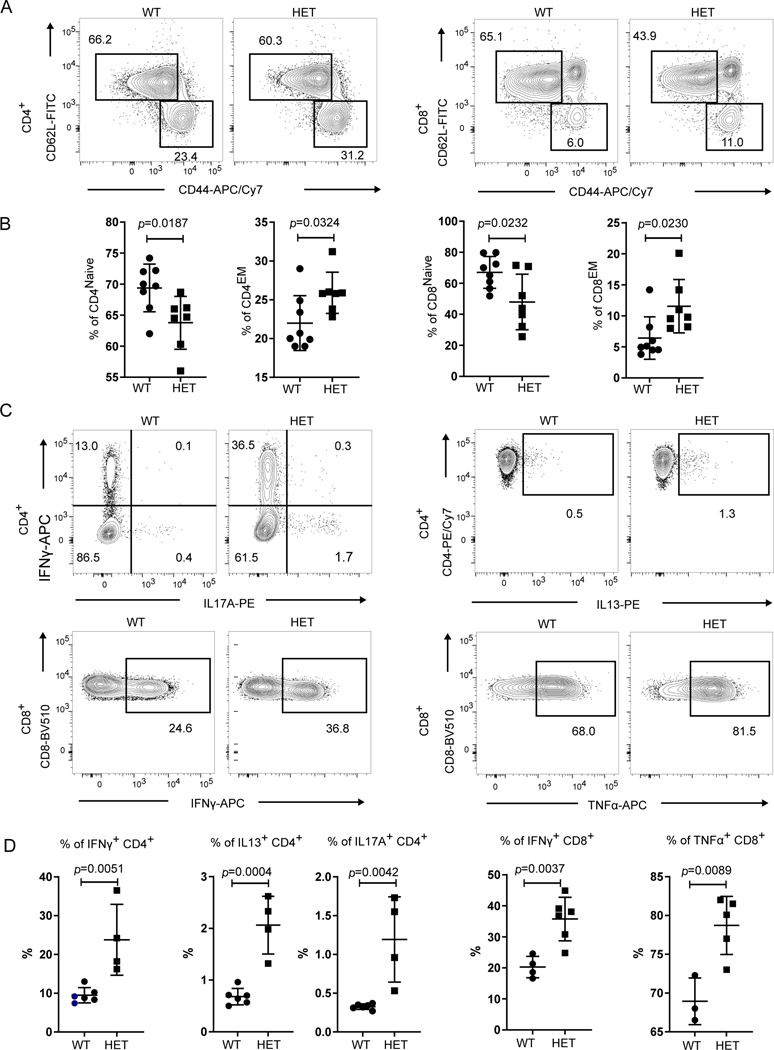
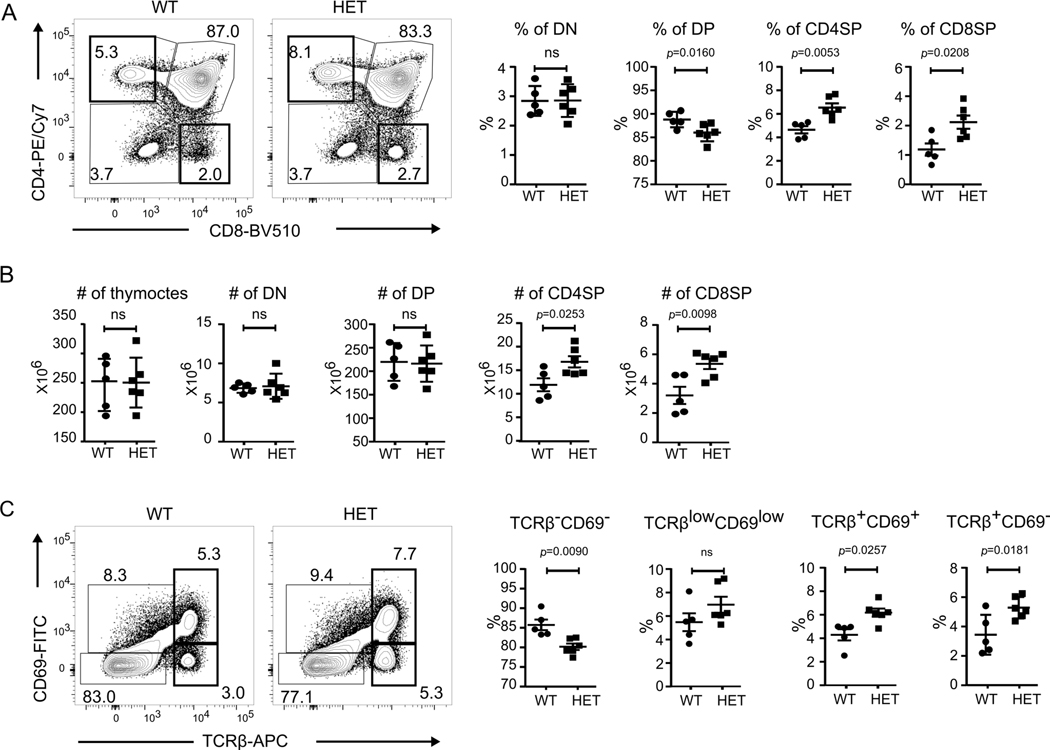
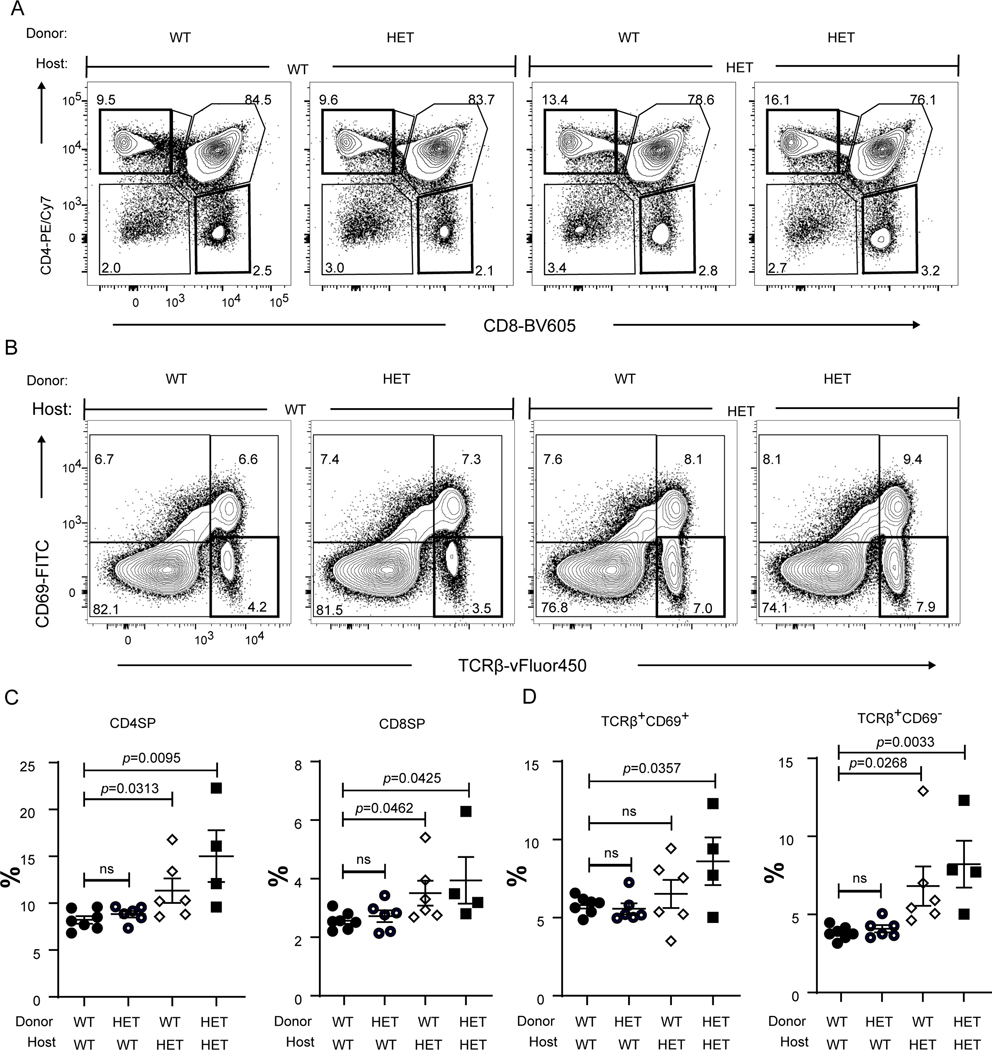
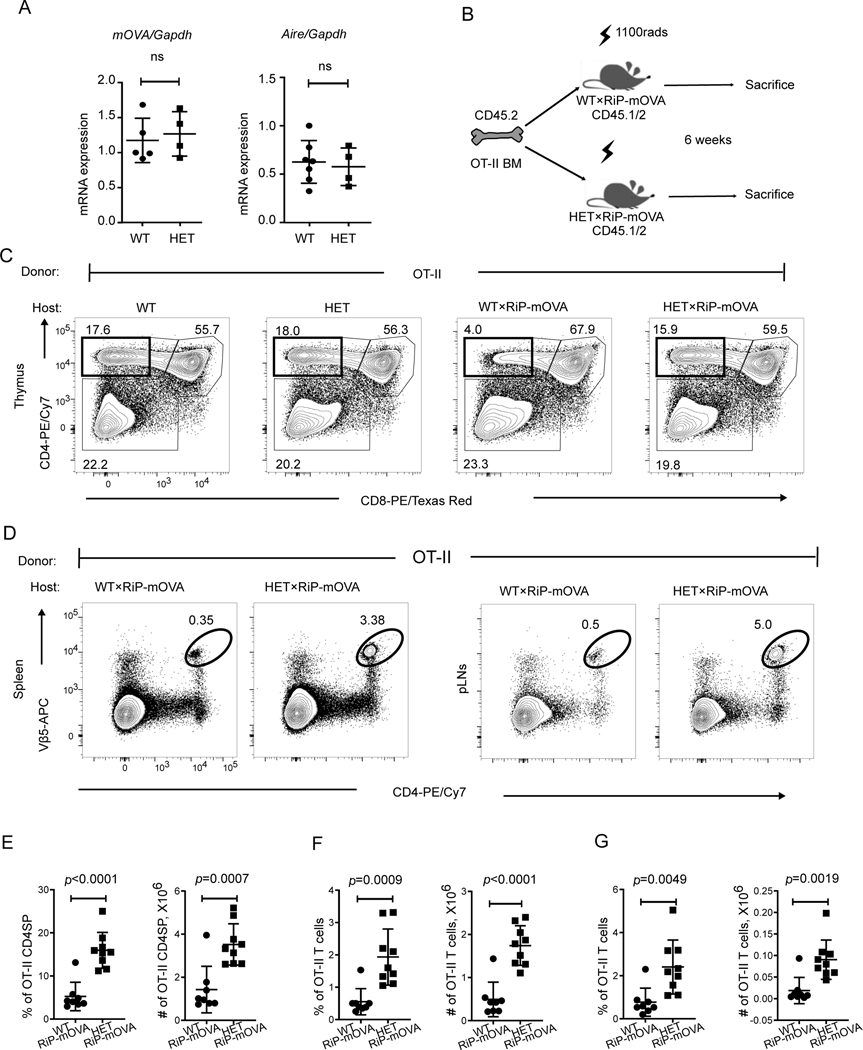
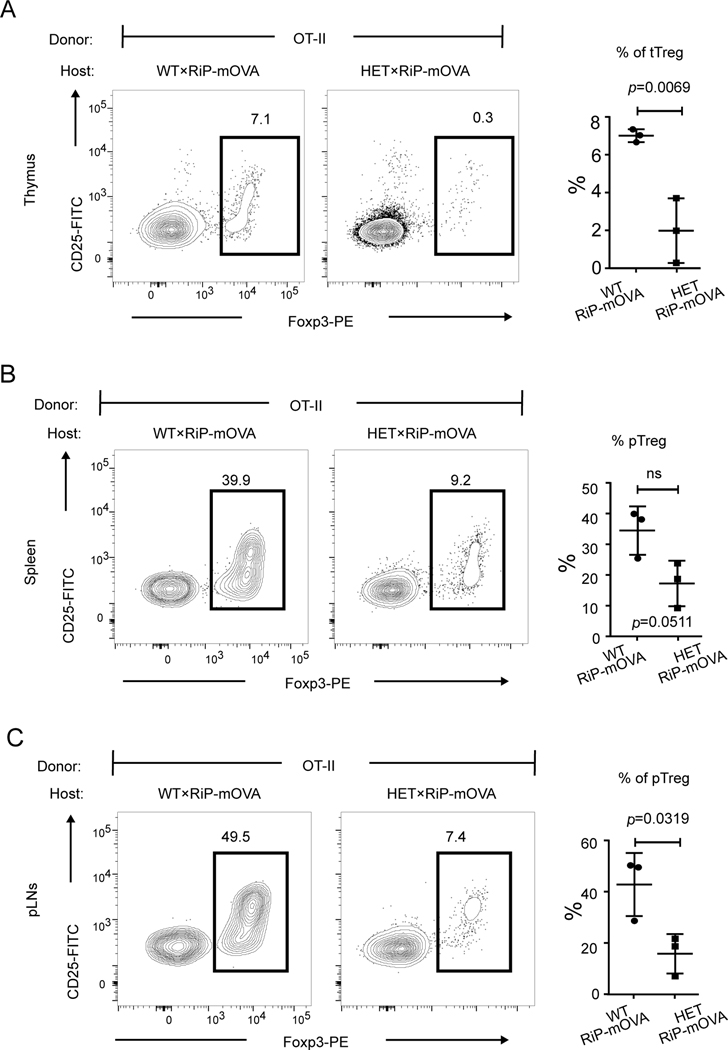
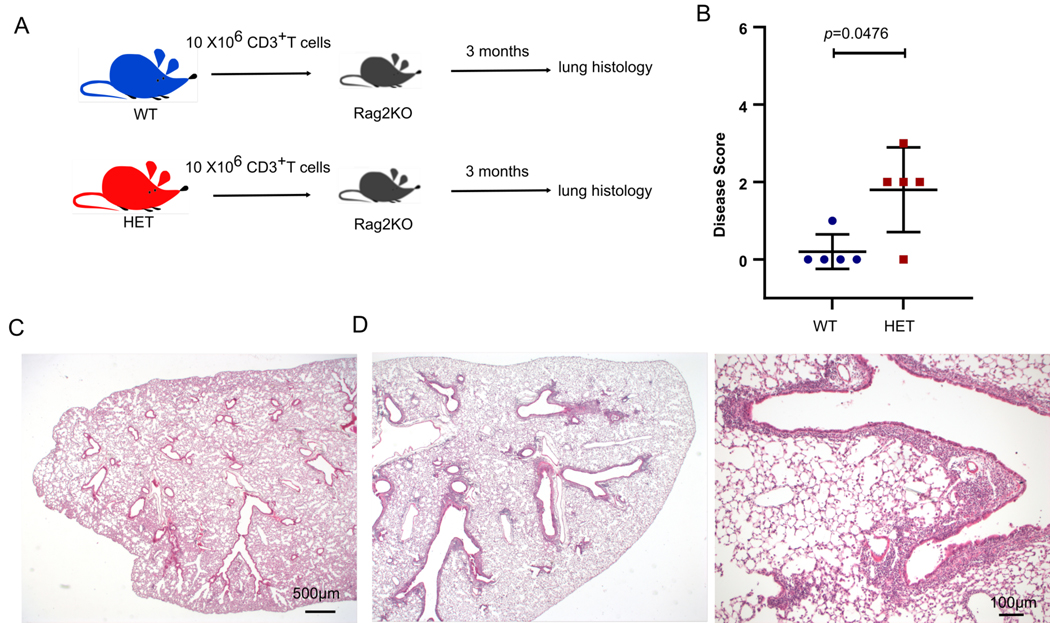
COPA syndrome is a recently described Mendelian autoimmune disorder caused by missense mutations in the coatomer protein complex subunit α (COPA) gene. Patients with COPA syndrome develop arthritis and lung disease that presents as pulmonary hemorrhage or interstitial lung disease (ILD). Immunosuppressive medications can stabilize the disease, but many patients develop progressive pulmonary fibrosis, which requires life-saving measures, such as lung transplantation. Because very little is understood about the pathogenesis of COPA syndrome, it has been difficult to devise effective treatments for patients. To date, it remains unknown which cell types are critical for mediating the disease as well as the mechanisms that lead to autoimmunity. To explore these issues, we generated a CopaE241K/+ germline knock-in mouse bearing one of the same Copa missense mutations in patients. Mutant mice spontaneously developed ILD that mirrors lung pathology in patients, as well as elevations of activated cytokine-secreting T cells. In this study, we show that mutant Copa in epithelial cells of the thymus impairs the thymic selection of T cells and results in both an increase in autoreactive T cells and decrease in regulatory T cells in peripheral tissues. We demonstrate that T cells from CopaE241K/+ mice are pathogenic and cause ILD through adoptive transfer experiments. In conclusion, to our knowledge, we establish a new mouse model of COPA syndrome to identify a previously unknown function for Copa in thymocyte selection and demonstrate that a defect in central tolerance is a putative mechanism by which COPA mutations lead to autoimmunity in patients.


Figures

Figure 1.
Figure 1.. CopaE241K/+ mice spontaneously develop lung disease.
Shown are the mouse lung disease scores and select images from 1 Copa+/+ (WT, panels B-C) and 3 CopaE241K/+ (HET-1, panels D-E; HET-2 panels F-J; HET-3 panels K-N) mice. A. Disease scores of lung sections from WT and HET mice. (10–11-month-old littermates: WT, n = 7; HET, n = 8). B. Low power image of a WT showing normal pulmonary architecture without significant inflammation, consolidation, or fibrosis. C. Higher power image of the WT lung. D. Low power image of HET-1 showing lymphocytic peribronchial and peribronchiolar inflammation. E. Higher power image of HET-1 showing peribronchiolar inflammation. F. Low power image of HET-2 showing prominent consolidation of distal alveoli by edema, fibrin, proteinosis, and macrophage accumulation. G. A higher power image of HET-2 showing alveolar septal thickening with edema, type 2 pneumocyte hyperplasia, and mild mixed acute and chronic inflammation. H. A high power image of HET-2 showing alveolar spaces filled by macrophages with foamy cytoplasm and proteinaceous granular fluid. I. Another high-power image of HET-2 showing the terminal bronchioles and alveolar ducts with prominent squamous metaplasia and keratinized epithelium being shed into air spaces. J. A 40x view of HET-2 showing the peribronchiolar inflammation with a mixed infiltrate of lymphocytes and plasma cells, including Mott cells (plasma cells with cytoplasmic immunoglobulin inclusions). K. On low power of HET-3, patchy peribronchial lymphoid hyperplasia is noted. L. Higher power image of HET-3 showing a lymphoid nodule in the bronchiolar subepithelium. Focal epithelial denudation is present with granulation tissue extending into the lumen (follicular bronchiolitis with proliferative bronchiolitis). M. Higher power image of HET-3 showing a pulmonary artery with marked luminal narrowing by endothelial hyperplasia and mild chronic inflammation. N. Higher power image of another bronchiole of HET-3 showing prominent eccentric proliferation of fibroblasts in the subepithelium (but above the muscular layer), diagnostic of constrictive bronchiolitis. Mann–Whitney U test was used in A. p < 0.05 is considered statistically significant. ns: not significant. Images B, D, F, K taken at 2x magnification, scale bar = 500 μM; images C, G, H, I taken at 10x, scale bar = 100 μM. Images E, L, M, N taken at 20x, scale bar = 50 μM. Image J taken at 40x, scale bar = 25 μM.
Figure 2.
Figure 2.. CopaE241K/+ mice have spontaneous activation of cytokine-secreting T cells.
A. Representative flow plots of CD62L versus CD44 expression on splenic CD4+ and CD8+ T cells from Copa+/+ (WT) and CopaE241K/+ (HET) mice. B. Percentages of naïve and memory CD4+ (left) and CD8+ T (right) cells from indicated mice (3-month-old littermates: WT, n = 8; HET, n = 7). C. Representative flow plots of intracellular cytokine levels in splenic CD4+ (top: IFNγ, IL17A and IL13) and CD8+ T cells (bottom: IFNγ and TNFα) after PMA/Ionomycin stimulation. D. left: Percentages of IFNγ, IL17A and IL13 producing CD4+ T cells among total CD4+ T cells from indicated mice (3-month-old littermates: WT, n = 6; HET, n = 4). right: Percentages of IFNγ and TNFα- producing CD8+ T cells among total CD8+ T cells (3-month-old littermates: WT, n = 4; HET, n = 6) Data are mean ± SD. Unpaired, parametric, two-tailed Student’s t-test was used for statistical analysis. p < 0.05 is considered statistically significant. ns: not significant.
Figure 3.
Figure 3.. CopaE241K/+ mice have increased single positive thymocytes
A. left: CD4 and CD8 profile of thymocytes. right: Percentages of double negative (DN), double positive (DP), CD4 single positive (CD4SP) and CD8 single positive (CD8SP) thymocytes from indicated mice (4–6-week-old littermates: WT, n = 5; HET, n = 6). B. Cell counts of total thymocytes, DN, DP and SP thymocytes in indicated mice (4–6-week-old littermates: WT, n = 5; HET, n = 6). C. left: CD69 and TCRβ chain on total thymocytes. right: Percentages of TCRβ-CD69-, TCRβlowCD69low, TCRβ+CD69+ and TCRβ+CD69- populations from indicated mice (4–6-week-old littermates: WT, n = 5; HET, n = 6). Data are mean ± SD. Unpaired, parametric, two-tailed Student’s t-test was used for statistical analysis. p < 0.05 is considered statistically significant. ns: not significant.
Figure 4.
Figure 4.. Bone marrow chimeras reveal a functional role for mutant Copa in the thymic stroma.
A. Representative flow analysis of CD4 and CD8 on reconstituted thymocytes in the bone marrow chimeras after 6–8 weeks of reconstitution. B. Flow analysis of CD69 and TCRβ expression on the reconstituted thymocytes. C. Percentages of CD4SP and CD8SP thymocytes among the reconstituted (6–8 weeks of reconstitution) thymocytes (WT→WT, n = 7; WT→HET, n = 6; HET→WT, n = 6; HET→HET, n = 4). D. Percentages of TCRβ+CD69+ and TCRβ+CD69- population among the reconstituted thymocytes (WT→WT, n = 7; WT→HET, n = 6; HET→WT, n = 6; HET→HET, n = 4). Data are mean ± SD. Unpaired, parametric, two-tailed Student’s t-test was used for statistical analysis. p < 0.05 is considered statistically significant. ns: not significant.
Figure 5.
Figure 5.. Lung infiltrates and effector memory T cells are increased in CopaE241K/+ host mice
A. Representative H&E stain of the lungs from bone marrow chimeras. Scale bar: 500 μM. B. Disease scores of lung sections from bone marrow chimeras after 8 weeks of reconstitution (WT→WT, n = 3; WT→HET, n = 6; HET→WT, n = 6; HET→HET, n = 3). C. left: Flow plots showing the expression of CD62L and CD44 on reconstituted splenic T cells. right: Percentages of effector memory T cell populations among the reconstituted T cells (6–8 weeks of reconstitution) in spleen (WT→WT, n = 7; WT→HET, n = 8; HET→WT, n = 8; HET→HET, n = 5). Data are mean ± SD. Mann–Whitney U test was used in B. p < 0.05 is considered statistically significant. ns: not significant. A taken at 2x magnification, scale bar = 50μm.
Figure 6.
Figure 6.. Mutant Copa in the thymic stroma causes increased single positive thymocytes.
A. top: Schedule from fetal thymus organ culture (FTOC) to transplantation to analysis. bottom: An image of grafted thymi. B. left: CD4 and CD8 profile of thymocytes in transplanted thymi. right: Percentages of CD4SP and CD8SP (WT, n = 4; HET, n = 4). C. left: CD69 and TCRβ profile of thymocytes in transplanted thymi. right: Percentages of TCRβ+CD69+ and TCRβ+CD69- thymocytes (WT, n = 4; HET, n = 4). Data are mean ± SD. Unpaired, parametric, two-tailed Student’s t-test was used for statistical analysis. p < 0.05 is considered statistically significant. ns: not significant.
Figure 7.
Figure 7.. Mutant Copa impairs thymocyte negative selection and allows autoreactive T cells to escape to the periphery.
A. left: mOVA expression level in thymic epithelial cells (4–5-week-old littermates: WT×RiP-mOVA, n = 5; HET×RiP-mOVA, n = 4). right: : mRNA levels of Aire in thymic epithelial cells (4–5-week-old littermates: WT, n = 7; HET, n = 4). B. Schematic for bone marrow chimeras. C. Representative flow analysis of CD4 and CD8 profile of OT-II thymocytes in chimeric mice. D. Representative flow plots showing the presence of OT-II CD4+ T cells in spleen (left) and pancreatic lymph nodes (right). E. Percentages (left) and absolute numbers (right) of CD4SP in the reconstituted thymi (WT×RiP-mOVA, n = 8; HET×RiP-mOVA, n = 9). F. Percentage and absolute numbers of OT-II CD4+ T cells in the reconstituted spleen (WT×RiP-mOVA, n = 8; HET×RiP-mOVA, n = 9). G. Percentage and absolute numbers of OT-II CD4+ T cells in reconstituted pancreatic lymph nodes (WT×RiP-mOVA, n = 8; HET×RiP-mOVA, n = 9). Data are mean ± SD. Unpaired, parametric, two-tailed Student’s t-test was used for statistical analysis. p < 0.05 is considered statistically significant. ns: not significant.
Figure 8.
Figure 8.. Mutant Copa impairs the generation of antigen-specific Tregs.
A. left: Intracellular Foxp3 within CD4SP thymocytes (gated on: CD45+CD4+CD8-TCRβ+). right: Percentages of Foxp3+ CD4SP among total CD4SP (WT×RiP-mOVA, n = 3; HET×RiP-mOVA, n = 3). B. left: Representative flow plot of intracellular Foxp3 levels within the reconstituted splenic CD4+ T cells (gated on: CD45+CD4+CD8-TCRβ+). right: Percentages of pTregs among the reconstituted splenic CD4+ T cells (WT×RiP-mOVA, n = 3; HET×RiP-mOVA, n = 3). C. left: Intracellular Foxp3 within the reconstituted CD4+ T cells (gated on: CD45+CD4+CD8-TCRβ+) from pancreatic lymph nodes. right: Percentages of Foxp3+ CD4+ cells among reconstituted CD4+ T cells in pancreatic lymph nodes (WT×RiP-mOVA, n = 3; HET×RiP-mOVA, n = 3). Data are mean ± SD. Unpaired, parametric, two-tailed Student’s t-test was used for statistical analysis. p < 0.05 is considered statistically significant. ns: not significant.
Figure 9.
Figure 9.. T cells from CopaE241K/+ mice cause ILD.
A. Schematic of the T cell transfer strategy. B. Disease scores of lung sections from Rag2KO mice after adoptive transfer of T cells from WT or HET animals (WT CD3+ T cells transferred into Rag2KO, n = 5; HET CD3+ T cells transferred into Rag2KO, n = 5). C. Representative low power image of recipient mouse lung after WT T cell transfer. D. Recipient mouse lung after HET T cell transfer at low power (left) and high power (right) demonstrates peribronchial infiltration. Data are mean ± SD. Mann–Whitney U test was used in B. p < 0.05 is considered statistically significant. Low power images taken at 2x, scale bar = 500 μM. High power image taken at 10x, scale bar = 100 μM.

References

    1. Watkin LB, Jessen B, Wiszniewski W, Vece TJ, Jan M, Sha Y, Thamsen M, Santos-Cortez RLP, Lee K, Gambin T, Forbes LR, Law CS, Stray-Pedersen A, Cheng MH, Mace EM, Anderson MS, Liu D, Tang LF, Nicholas SK, Nahmod K, Makedonas G, Canter DL, Kwok P-Y, Hicks J, Jones KD, Penney S, Jhangiani SN, Rosenblum MD, Dell SD, Waterfield MR, Papa FR, Muzny DM, Zaitlen N, Leal SM, Gonzaga-Jauregui C, Baylor-Hopkins Center for Mendelian Genomics, Boerwinkle E, Eissa NT, Gibbs RA, Lupski JR, Orange JS, and Shum AK. 2015. COPA mutations impair ER-Golgi transport and cause hereditary autoimmune-mediated lung disease and arthritis. Nature genetics 47: 654–660. - PMC - PubMed
    1. Tsui JL, Estrada OA, Deng Z, Wang KM, Law CS, Elicker BM, Jones KD, Dell SD, Gudmundsson G, Hansdottir S, Helfgott SM, Volpi S, Gattorno M, Waterfield MR, Chan AY, Chung SA, Ley B, and Shum AK. 2018. Analysis of pulmonary features and treatment approaches in the COPA syndrome. ERJ Open Research 4: 00017–2018. - PMC - PubMed
    1. Popoff V, Adolf F, Brügger B, and Wieland F. 2011. COPI budding within the Golgi stack. Cold Spring Harbor Perspectives in Biology 3: a005231. - PMC - PubMed
    1. Vece TJ, Watkin LB, Nicholas S, Canter D, Braun MC, Guillerman RP, Eldin KW, Bertolet G, McKinley S, de Guzman M, Forbes L, Chinn I, and Orange JS. 2016. Copa Syndrome: a Novel Autosomal Dominant Immune Dysregulatory Disease. J. Clin. Immunol. 36: 377–387. - PMC - PubMed
    1. Fish F, and Ziff M. 1981. A sensitive solid phase microradioimmunoassay for anti-double stranded DNA antibodies. Arthritis Rheum 24: 534–543. - PubMed

Publication types

MeSH terms

Substances