. 2020 Jul;69(7):1439-1450.
doi: 10.2337/db19-1034. Epub 2020 Mar 20.

Integrated Pancreatic Blood Flow: Bidirectional Microcirculation Between Endocrine and Exocrine Pancreas

Affiliations

Integrated Pancreatic Blood Flow: Bidirectional Microcirculation Between Endocrine and Exocrine Pancreas

Michael P Dybala et al. Diabetes. 2020 Jul.

Abstract

The pancreatic islet is a highly vascularized endocrine micro-organ. The unique architecture of rodent islets, a so-called core-mantle arrangement seen in two-dimensional images, led researchers to seek functional implications for islet hormone secretion. Three models of islet blood flow were previously proposed, all based on the assumption that islet microcirculation occurs in an enclosed structure. Recent electrophysiological and molecular biological studies using isolated islets also presumed unidirectional flow. Using intravital analysis of the islet microcirculation in mice, we found that islet capillaries were continuously integrated to those in the exocrine pancreas, which made the islet circulation rather open, not self-contained. Similarly in human islets, the capillary structure was integrated with pancreatic microvasculature in its entirety. Thus, islet microcirculation has no relation to islet cytoarchitecture, which explains its well-known variability throughout species. Furthermore, tracking fluorescent-labeled red blood cells at the endocrine-exocrine interface revealed bidirectional blood flow, with similar variability in blood flow speed in both the intra- and extra-islet vasculature. To date, the endocrine and exocrine pancreas have been studied separately by different fields of investigators. We propose that the open circulation model physically links both endocrine and exocrine parts of the pancreas as a single organ through the integrated vascular network.


Figures

Figure 1
Figure 1
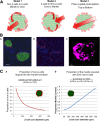
Mouse islet architecture and patterns of microcirculation. A: Three models of the direction of islet blood flow. B: (a) Two-dimensional image of mouse islets immunostained for insulin (green), glucagon (red), and nuclei (DAPI, blue). Scale bar: 50 μm. (b) α-Cells only. (c) 3D view of α-cell lining. Scale bar: 20 μm. C: (a) Proportion of non–β-cells required for the mantle formation. (b) Proportion of the mantle covered with 20% non–β-cells.
Figure 2
Figure 2
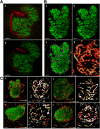
Measurement of RBC flow in mouse islets. A: (a) Fluorescent signal of dextran in mouse islet vasculature. (b) Fluorescent signal of labeled individual RBCs in mouse islet vasculature. Scale bar: 100 μm. B: (a) Fluorescent signal of labeled individual RBCs. (b) Computer-generated spheres representing tracked RBCs. (c) Computer-generated spheres showing path of RBC movement through tailing. (d) Heatmap of RBC speed within the islet (fast to slow, white to red). Scale bar: 80 μm. C: Heatmap of RBC pathways through mouse islets (β-cells in green). (a) (left) Individual pathways are color coded from slow (dark red, 0 μm/s) to fast (white, 500 μm/s). (right) Arrows depict the direction of flow and are color coded according to RBC speed in the indicated region (red, slow; orange, intermediate; yellow, fast). Scale bar: 100 μm. (b) Speed scale 0–500 μm/s. Scale bar: 70 μm. (c) Speed scale 0–400 μm/s. Scale bar: 100 μm. (d) Speed scale 0–400 μm/s. Scale bar: 100 μm. See also Supplementary Videos 17.
Figure 3
Figure 3
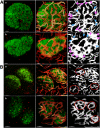
Bidirectional blood flow between endocrine (islet) and exocrine pancreas. A (a and b): (left) Fluorescent image of β-cells (green) and RBCs (red). (middle) Fluorescent image of β-cells and heatmap indicating the relative speed of the RBC flow from slow (red) to fast (white). (right) Blood flow direction at the endocrine-exocrine interface was determined by tracking each fluorescently labeled RBC. Exocrine to endocrine (blue arrows). Endocrine to exocrine (pink arrows). Scale bar: (a) 50 μm; (b) 80 μm. B (a and b): (left) Fluorescent image of β-cells (green) and RBCs (red). (middle) Fluorescent image of β-cells and heatmap of the relative speed of the RBC flow. (right) Similarly varied flow speed in intra- and extra-islet area was noted (red circles). Scale bar (a and b): 100 μm. See also Supplementary Videos 815.
Figure 4
Figure 4
Structural relationship between islets and capillary networks in mouse islets. A: Outer layer (upper row) and inner layer (lower row) views of mouse islet (β-cells in green and blood vessels in red). Islet capillaries were noted to be integrated with those in the exocrine tissue. This pattern was observed in islets of different size ranges. Feret’s diameter: 314 μm. Scale bar: 50 μm. (a) Fluorescent signals. (b) 3D-rendered β-cells and blood vessels. (c) β-Cells made transparent. (d) β-Cells. (e) Blood vessels. B: Feret’s diameter: 644 μm. Scale bar: 100 μm. C: 3D analysis of mouse islets. (Upper row) (a) Fluorescent image. β-Cells (GFP in green), blood vessels (tomato-lectin in red), and large blood vessels and arterioles (α-SMA in magenta). (b) 3D-rendered image of (a). (c) Blood vessels removed. (d) Islet enlarged and β-cells made transparent. Scale bar: 150 μm for (a–c) and 100 μm for (d). (Lower row) (e) Fluorescent image. (f) 3D-rendered β-cells, blood vessels, and arterioles. (g) 3D-rendered and clipped in half. β-Cells made transparent. (h) Blood vessels removed, β-cells made transparent, and surfaces clipped in half. Scale bar: all 50 μm.
Figure 5
Figure 5
Integrated islet capillaries with those in the exocrine pancreas in human islets. A: 3D analysis of a human islet from a 24-year-old male. (a) A 3D-rendered view of a human islet integrated in the pancreatic capillary network. Islet (HPi1, a human pan-endocrine cell marker in cyan), blood vessels (CD31 in red), and an afferent arteriole (α-SMA in yellow). Scale bar: 50 μm. (b) Blood vessels only, displaying the continuity of capillaries in the islet as well as exocrine tissue. (c) Close-up view of (a), with capillaries showing diverse routes of blood flow around the islet and one large afferent arteriole (yellow). Scale bar: 30 μm. (d) The aforementioned feeding arteriole penetrating the center of the islet. (e) Vasculature partially made transparent. (f) Islet made partially transparent without surrounding capillaries. The diverse routes of blood flow observed here within the islet contradict previous models of islet microcirculation. Scale bar: 50 μm. (g–j) Anticlockwise front to back rotation of the islet. The islet is embedded in the larger pancreatic vascular network. Scale bar: 50 μm. (k) Back view. (l) Islet made transparent. (m) Islet made transparent without capillaries, with feeding arteriole penetrating deep into the center of the islet. (n) Capillaries only. Note the continuity of the capillaries regardless of the islet border. (o) Close-up view of the interface of capillaries entering and exiting the islet. Scale bar: 20 μm. B: (a) Islet from a 46-year-old female. (b) Islet made transparent. (c) β-Cells only showing openings for capillary entry/exit. (d) Capillaries only. (e and f) Back view. Scale bar: 30 μm. C: Islet from a 57-year-old male. Scale bar: (a–c) 40 μm; (d–f) 30 μm. D: Islet from a 16-year-old female. Scale bar: 30 μm. E: (a) A cluster of four islets from a 24-year-old male. (b) Islet made transparent. (c) Islets. (d) Capillaries. Scale bar: 50 μm. (e–g) Islets in the lower left. Scale bar: 20 μm. (h–j). Islets in the upper left. Scale bar: 30 μm. See also Supplementary Video 16.
Figure 6
Figure 6
Characteristics of pancreatic capillary networks in patients with T2D. A: (a) Large-scale capture of the pancreas in a patient with T2D exhibiting clustered islets (59-year-old female, T2D duration for 15 years; HPi1, a pan-endocrine cell marker in cyan; blood vessels (CD31 in red). Scale bar: 200 μm. (b) Enlarged view of (a). Scale bar: 150 μm. B: (a) Clustered islets. (b) Islets made transparent. (c) Blood vessels only demonstrating continuity between endocrine and exocrine vasculature. Scale bar: all 50 μm. C: Comparison between a nondiabetic subject and a patient with T2D. (a) A 44-year-old female patient with T2D. Fluorescent image of islet (HPi1 in yellow) and blood vessels (CD31 in red). Scale bar: 100 μm. (b) 3D rendering of (a). Scale bar: 100 μm. (c) Enlarged view of the islet and surrounding blood vessels. Scale bar: 50 μm. (d) Blood vessels only, showing continuity between endocrine and exocrine vasculature. Scale bar: 50 μm. (e–h) The same as (a–d) but for a nondiabetic 46-year-old female. See also Supplementary Fig. 1.
Figure 7
Figure 7
Summary of findings. A: (left) Old model of islet (green) microcirculation represented as an isolated system with an afferent arteriole (red) branching into a capillary network and exiting through an efferent venule (blue). (right) New model showing open circulation where an afferent arteriole enters into the islet (green) and branches out into a capillary network integrated with the microenvironment. B: 3D prints of a human islet. (a) Side-by-side comparison of the same region of pancreas with exocrine and endocrine (intraislet) capillaries printed the same color (left, clear) and the exocrine capillaries in clear and endocrine capillaries in orange (right). (b) Another view of the same region of pancreas with exocrine and endocrine capillaries in clear (left) and endocrine capillaries in orange and exocrine capillaries in clear (right). C: 3D prints with coloration. (a) The computer-generated model from fluorescent 3D imaging used to create the 3D prints in (b) and (c). (b) Front view of a 3D-printed islet and exocrine vasculature. Note the many connections between the endocrine and exocrine vasculature at the islet border. (c) Side view of 3D-printed islet vasculature with a feeding arteriole (red) penetrating the center of the islet. Capillaries within the islet (dark blue) are integrated with vasculature in the exocrine tissue (light blue). D: A more expansive view of the endocrine/exocrine vascular network with feeding arteriole shown in C. Blood vessels within the islet (light blue) are integrated with those in the exocrine tissue (white). A feeding arteriole (red) penetrates the center of the islet. (a) A cross-sectional view of the islet capillary network within the exocrine tissue vasculature. (b) Islet capillaries with a feeding arteriole. Note the markedly larger size of the feeding arteriole compared with endocrine blood vessels. (c) Side view of the endocrine and exocrine vascular network. (d) Front view of the endocrine and exocrine vascular network. E: Human islet vascular network embedded in the exocrine vasculature. Blood vessels in five human islets (dark green) integrated with the pancreatic vascular network (white).

Comment in

Similar articles

Cited by

References

    1. Orci L, Unger RH. Functional subdivision of islets of Langerhans and possible role of D cells. Lancet 1975;2:1243–1244 - PubMed
    1. Brunicardi FC, Stagner J, Bonner-Weir S, et al. .; Long Beach Veterans Administration Regional Medical Education Center Symposium . Microcirculation of the islets of Langerhans. Diabetes 1996;45:385–392 - PubMed
    1. McCuskey RS, Chapman TM. Microscopy of the living pancreas in situ. Am J Anat 1969;126:395–407 - PubMed
    1. Nyman LR, Wells KS, Head WS, et al. . Real-time, multidimensional in vivo imaging used to investigate blood flow in mouse pancreatic islets. J Clin Invest 2008;118:3790–3797 - PMC - PubMed
    1. Bonner-Weir S, Orci L. New perspectives on the microvasculature of the islets of Langerhans in the rat. Diabetes 1982;31:883–889 - PubMed

Publication types