. 2020 Mar 20;10(1):5112.
doi: 10.1038/s41598-020-59526-x.

The distinctive structure and composition of arterial and venous thrombi and pulmonary emboli

Affiliations

The distinctive structure and composition of arterial and venous thrombi and pulmonary emboli

Irina N Chernysh et al. Sci Rep. .

Abstract

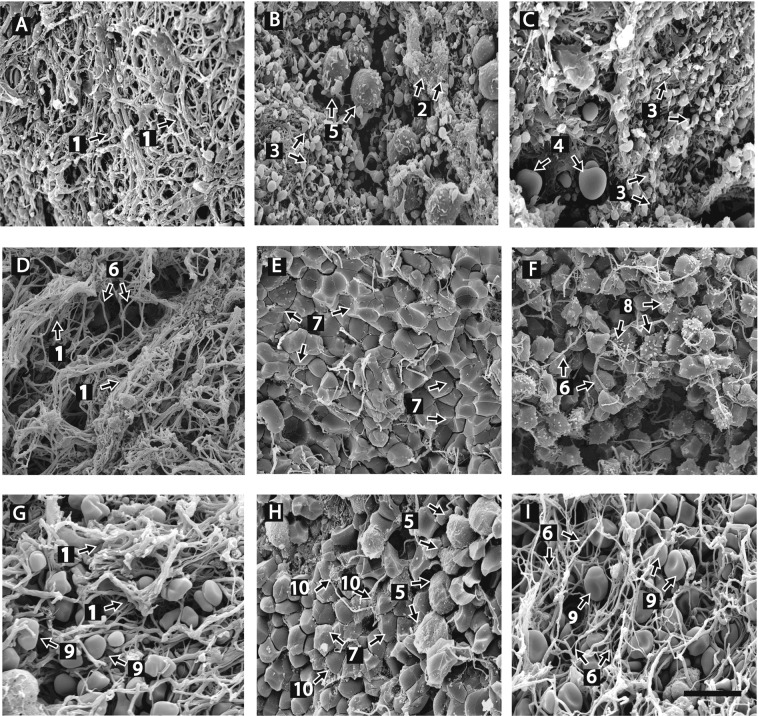
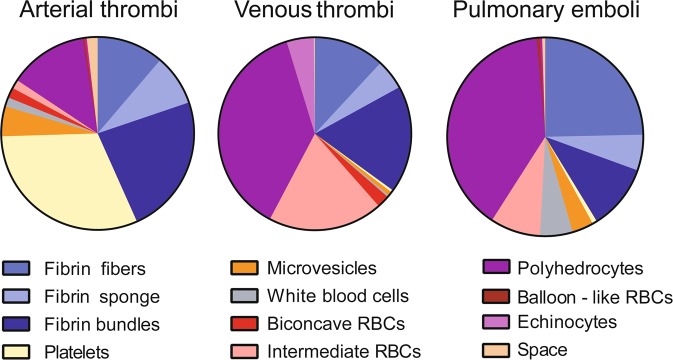
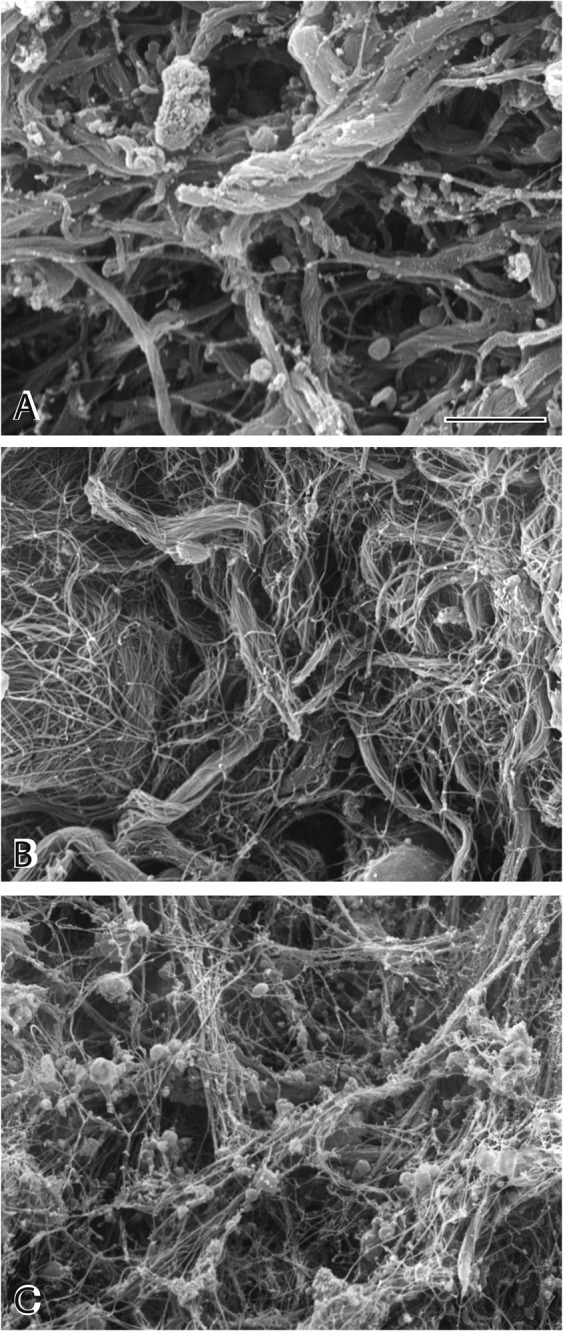
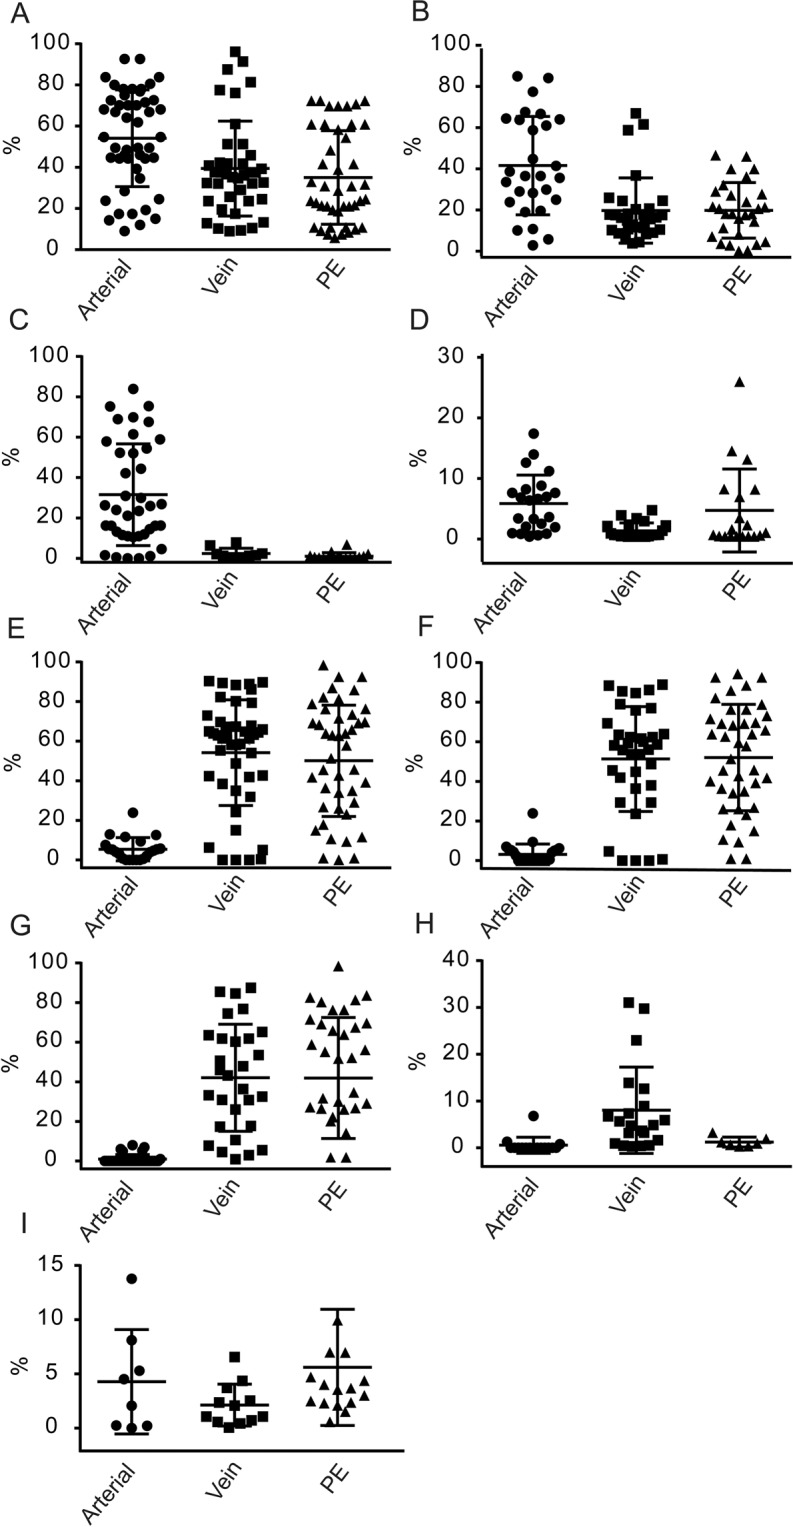
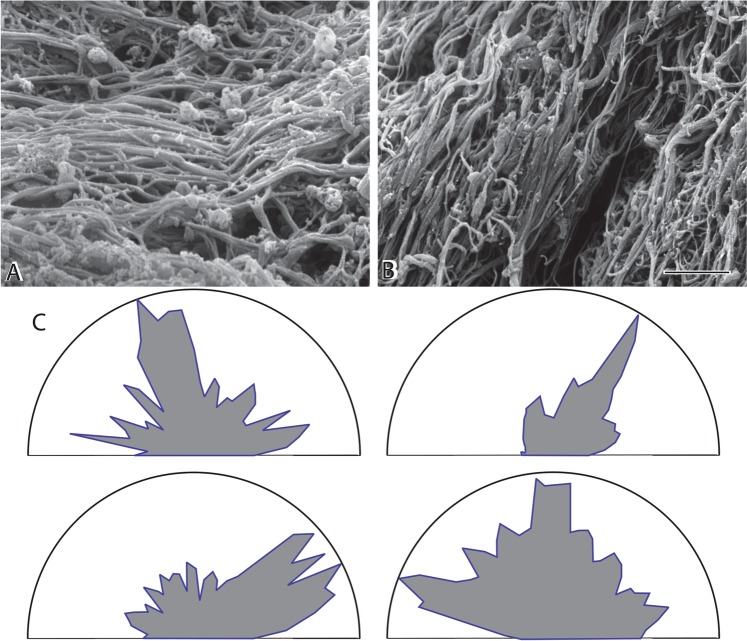
Although arterial and venous thromboembolic disorders are among the most frequent causes of mortality and morbidity, there has been little description of how the composition of thrombi and emboli depends on their vascular origin and age. We quantified the structure and composition of arterial and venous thrombi and pulmonary emboli using high-resolution scanning electron microscopy. Arterial thrombi contained a surprisingly large amount of fibrin, in addition to platelets. The composition of pulmonary emboli mirrored the most distal part of venous thrombi from which they originated, which differed from the structure of the body and head of the same thrombi. All thrombi and emboli contained few biconcave red blood cells but many polyhedrocytes or related forms of compressed red blood cells, demonstrating that these structures are a signature of clot contraction in vivo. Polyhedrocytes and intermediate forms comprised the major constituents of venous thrombi and pulmonary emboli. The structures within all of the thrombi and emboli were very tightly packed, in contrast to clots formed in vitro. There are distinctive, reproducible differences among arterial and venous thrombi and emboli related to their origin, destination and duration, which may have clinical implications for the understanding and treatment of thrombotic disorders.


Conflict of interest statement

The authors declare no competing interests.

Figures

Figure 1
Figure 1
Representative scanning electron microscope images of thrombi and emboli. Structures identified in arterial and venous thrombi and pulmonary emboli. Panels A–C are images of arterial thrombi. Panels D–F are images of venous thrombi. Panels G–I are images of pulmonary emboli. (A) Arterial thrombus: fibrin structure is primarily composed of fiber bundles (1) and (B) fibrin sponge (2). (B,C) Dense contracted thrombi with platelet aggregates (3) with fibrin on the outside and red blood cell balloons (4) trapped in the fibrin mesh; some white blood cells were also present (5). (D) Venous thrombus, mostly fibrin structure is primarily composed of fiber bundles (1) and individual fibrin fibers (6). (E) Tightly packed RBCs in the form of polyhedrocytes (7) with a few fibrin fibers. (F) Fibrin fibers (6); RBCs present as polyhedrocytes and echinocytes (8). (G) Pulmonary embolus, bundles of fibrin (1) with intermediate forms of RBCs trapped inside (9). (H) Mostly polyhedrocytes (7) and extracellular microvesicles (10) as well as many white blood cells are present (5). (I) Individual fibrin fibers (6) and intermediate forms of RBCs (9). Magnification bar = 10 µm.
Figure 2
Figure 2
Quantitation of structures identified in pulmonary emboli, arterial and venous thrombi. Thrombi were obtained from patients and prepared for scanning electron microscopy and their composition was quantified as described in the Materials and Methods section. The fibrin component was present as individual fibrin fibers, fibrin sponge and fibrin bundles; erythrocytes as biconcave, intermediate shapes, polyhedrocytes, echinocytes and balloon-like forms. The proportions of total volume occupied by these structures were calculated and presented as pie charts. RBC = red blood cell.
Figure 3
Figure 3
Fibrin structures in thrombi. There was great diversity in the structure of fibrin in thrombi and emboli. (A) Very thick bundles of fibers that are sometimes twisted with large pores. (B) Thick bundles of fibers made up of thinner fibers and large pores. (C) Thrombus with a non-uniform distribution of thin fibers with large pores and platelet aggregates and fragments. Magnification bar = 1 µm.
Figure 4
Figure 4
Quantitative analyses of structures (volume fraction, %) identified in pulmonary emboli, arterial and venous thrombi. Thrombi were visualized by scanning electron microscopy and their composition was quantified as described in the Materials and Methods section. The fibrin components, different shapes of erythrocytes as well as white blood cells, platelets and microvesicles were identified in thrombi and compared here as a percentage of the total thrombus volume. (•) – Arterial thrombi; (■) – Venous thrombi; (▲) – Pulmonary emboli. Quantitative differences were compared statistically by ANOVA test with Dunnett’s correction for multiple comparison. P values for differences between pulmonary emboli, venous and arterial thrombi are indicated by **, and *. (A) Fibrin fibers; **P = 0.0088, *P = 0.0408. (B) Fibrin bundles; **P = 0.0035, *P = 0.035. (C) Polyhedrocyte-shaped erythrocytes; **P < 0.0001, *P < 0.0001; (D) Platelets; **P < 0.001, *P = 0.002; (E) Microvesicles; **P = 0.048, *P = 0.010; (F) Echinocytes; **P = 0.0260, *P = 0.0068; (G) Total red blood cells; **P < 0.0001, *P < 0.0001; (H) Combination of polyhedrocytes and intermediate shapes of erythrocytes; **P < 0.0001, *P < 0.0001.; (I) White blood cells; **P = 0.0044, *P = 0.0034.
Figure 5
Figure 5
Orientation of fibrin fibers in thrombi. Some areas of some thrombi contained fibrin fibers largely oriented in a single direction. (A) Dense network of roughly horizontally oriented fibers. (B) Dense fibers oriented diagonally. (C) Polar plots of the frequency of fibers with different orientation. Distance ‘r’ represents the frequency of fibers with orientation at each angle between 0° and 180°, normalized to the maximum frequency. The angles are between 0°–180° rather than 0°–360°, because there is no directionality of the orientation. Each plot is from a single micrograph and the absolute value of the angle is arbitrary, but only relative to the other fibers in an individual image, which is why the values are not given on the coordinate for angles. Magnification bar = 1 µm.

References

    1. Hirsh J, Hoak J. Management of deep vein thrombosis and pulmonary embolism. A statement for healthcare professionals. Council on Thrombosis (In consultation with the Council on Cardiovascular Radiology), American Heart Association. Circulation. 1996;93:2212–2245. doi: 10.1161/01.CIR.93.12.2212. - DOI - PubMed
    1. Alper EC, et al. Risk Stratification Model: Lower-Extremity Ultrasonography for Hospitalized Patients with Suspected Deep Vein Thrombosis. J. Gen. Intern. Med. 2018;33:21–25. doi: 10.1007/s11606-017-4170-3. - DOI - PMC - PubMed
    1. Benjamin EJ, et al. Heart Disease and Stroke Statistics—2017 Update, American Heart Association. Circulation. 2017;135:146–603. doi: 10.1161/CIR.0000000000000485. - DOI - PMC - PubMed
    1. Davies MJ, Thomas AC. Plaque fissuring–the cause of acute myocardial infarction, sudden ischaemic death, and crescendo angina. Br. Heart J. 1985;53:363–373. doi: 10.1136/hrt.53.4.363. - DOI - PMC - PubMed
    1. Wolberg AS, Aleman MM, Leiderman K, Machlus KR. Procoagulant activity in hemostasis and thrombosis: Virchow’s triad revisited. Anesth. Analg. 2012;114:275–285. doi: 10.1213/ANE.0b013e31823a088c. - DOI - PMC - PubMed

Publication types

MeSH terms