. 2020 Mar 20;11(1):1491.
doi: 10.1038/s41467-020-15292-y.

The mechanism of a high-affinity allosteric inhibitor of the serotonin transporter

Affiliations

The mechanism of a high-affinity allosteric inhibitor of the serotonin transporter

Per Plenge et al. Nat Commun. .

Abstract

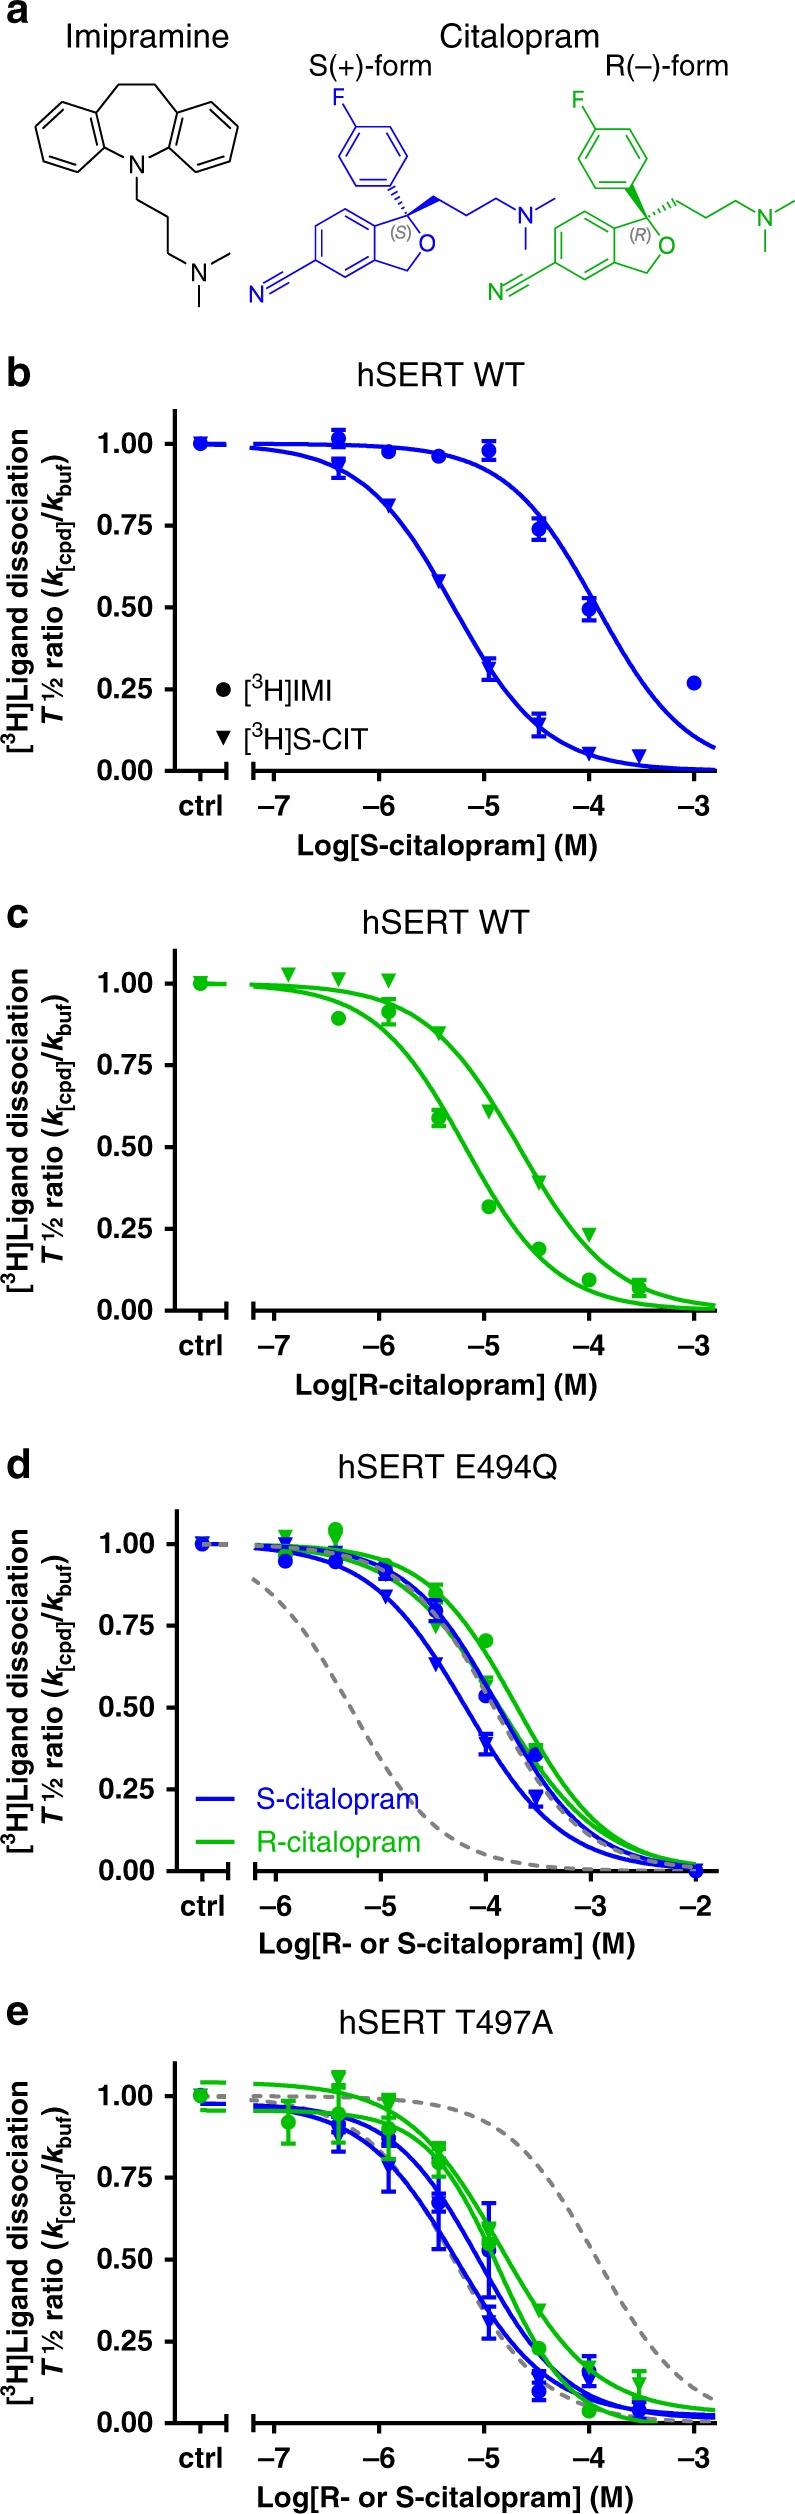
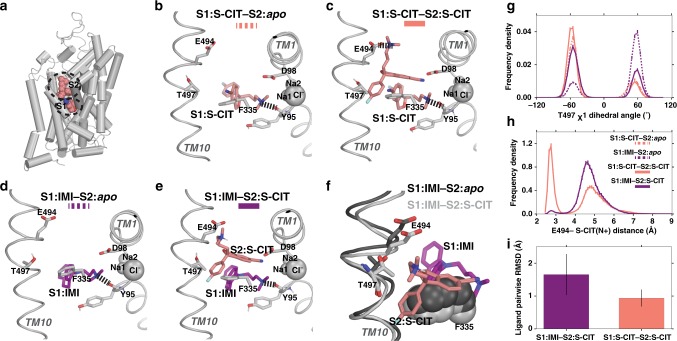
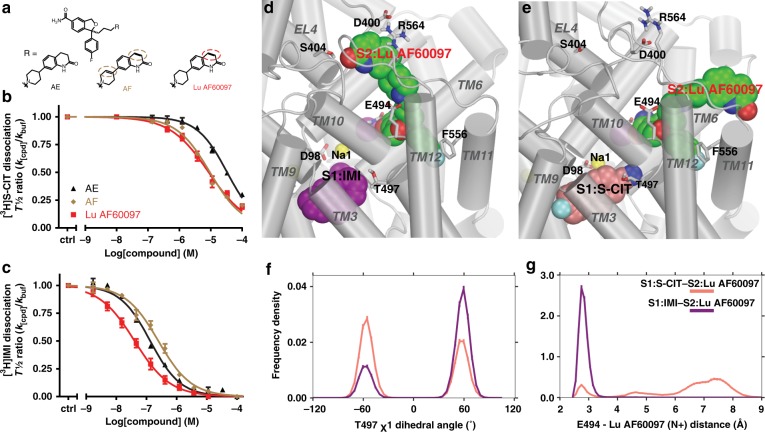
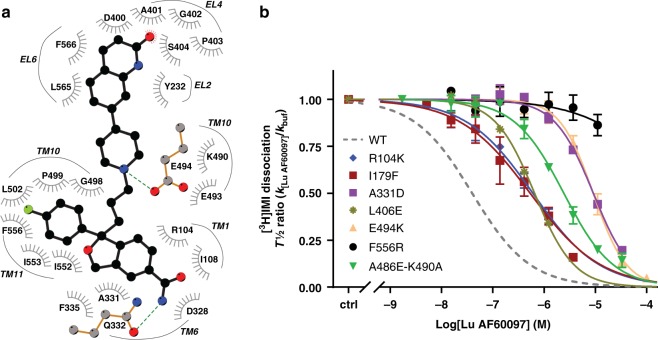
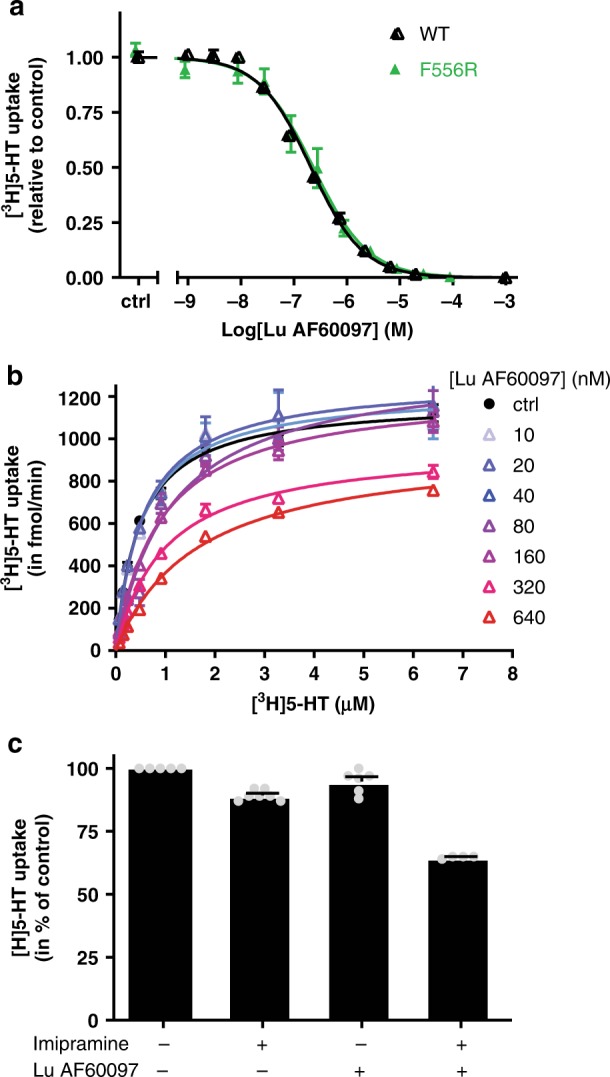
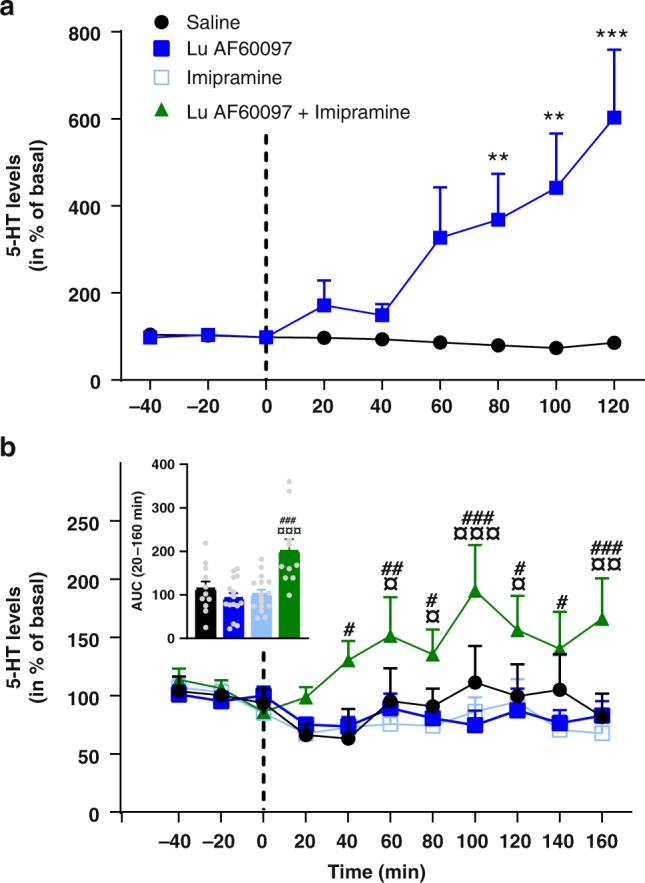
The serotonin transporter (SERT) terminates serotonin signaling by rapid presynaptic reuptake. SERT activity is modulated by antidepressants, e.g., S-citalopram and imipramine, to alleviate symptoms of depression and anxiety. SERT crystal structures reveal two S-citalopram binding pockets in the central binding (S1) site and the extracellular vestibule (S2 site). In this study, our combined in vitro and in silico analysis indicates that the bound S-citalopram or imipramine in S1 is allosterically coupled to the ligand binding to S2 through altering protein conformations. Remarkably, SERT inhibitor Lu AF60097, the first high-affinity S2-ligand reported and characterized here, allosterically couples the ligand binding to S1 through a similar mechanism. The SERT inhibition by Lu AF60097 is demonstrated by the potentiated imipramine binding and increased hippocampal serotonin level in rats. Together, we reveal a S1-S2 coupling mechanism that will facilitate rational design of high-affinity SERT allosteric inhibitors.


Conflict of interest statement

The authors declare no competing interests.

Figures

Fig. 1
Fig. 1. Experimental evidence for allosteric binding between the S1 and S2 sites in SERT.
a Chemical structure of the tested drugs. Left: imipramine (IMI). Right: R(−)- and S(+)-citalopram (R-CIT and S-CIT, respectively). b Allosteric potency of S-CIT measured as concentration-dependent inhibition of either [3H]IMI or [3H]S-CIT dissociation, prebound to SERT prior to the addition of S-CIT in the indicated concentrations. Data plotted as inhibition of [3H]ligand dissociation rate by S-CIT relative to no S-CIT added (ctrl). Prebound [3H]S-CIT (triangles) results in a 29-fold increase in S-CIT allosteric potency relative to prebound [3H]IMI (circles), with IC50 = 5.1 [4.6, 5.8] µM and 152 [125, 185] µM, respectively (mean [S.E. interval], n = 3). c Allosteric potency of R-CIT measured as in (b). Here R-CIT possesses a fourfold higher allosteric potency for prebound [3H]IMI relative to prebound [3H]S-CIT, with IC50 = 5.3 [4.9; 5.8] µM and 21.5 [20.3; 22.7] µM, respectively (mean [S.E. interval], n = 3–6). d Allosteric potency of S-CIT (blue) and R-CIT (green) in SERT E494Q predicted to dissipate the allosteric interaction between S1 and S2 sites. The allosteric potency is now collapsed around the observed allosteric potency for S-CIT inhibition of [3H]IMI dissociation (right dotted line) in SERT WT. The allosteric potency of S-CIT (blue) for inhibition of [3H]S-CIT (triangles) and [3H]IMI (circles) dissociation in E494Q is 64.8 [56.6; 74.1] µM and 131 [123; 140] µM, respectively (mean [S.E. interval], n = 5–6). The same values for R-CIT are 137 [118; 158] µM and 199 [191; 207] µM, respectively (mean [S.E. interval], n = 5). Left dotted line is allosteric potency for S-CIT with prebound [3H]S-CIT from (b), shown for comparison. e Allosteric potency for S-CIT with prebound [3H]S-CIT (triangles) or [3H]IMI (circles) in SERT T497A. Thr497 is predicted to mediate the S1:S2 allosteric interaction (see Fig. 2). The IC50 is collapsed, around the allosteric potency for [3H]S-CIT dissociation from SERT WT (dotted lines); IC50 for S-CIT: 5.10 [3.20; 8.00] µM and 8.80 [5.90; 13.4] µM for inhibition of [3H]S-CIT and [3H]IMI dissociation, respectively. The same values for R-CIT are 17.8 [15.7; 20.2] and 11.6 [10.1; 13.3], respectively (mean [S.E. interval], n = 3). Source data are provided as a Source Data file.
Fig. 2
Fig. 2. MD simulations of the allosteric interaction between SERT S1 and S1 sites.
In the presence of S1:S-CIT the Thr497 χ1 dihedral is mostly shifted towards gauche−, whereas in the presence of S1:IMI, it is in gauche+, which in turn affects the salt bridge interaction between S2:S-CIT and Glu494. In all panels, the S1:S-CIT conditions are colored in salmon, whereas the S1:IMI conditions are in purple. a A zoomed-out view of the 5I73 structure showing the S1 and S2 sites. b A zoomed-in view of the equilibrated model of WT S1:S-CIT/S2:apo, c S1:S-CIT/S2:S-CIT, d S1:IMI/S2:apo, and e S1:IMI/S2:S-CIT. g Distribution of the Thr497 χ1 rotamer for S1:S-CIT/S2:apo, S1:IMI/S2:apo (dotted lines), and S1:S-CIT/S2:S-CIT and S1:IMI/S2:S-CIT (solid lines) conditions. h Distribution of the Glu494/S2:S-CIT distance (minimum distance between the charged N of S2:S-CIT and the two carboxyl oxygens of Glu494) for S1:S-CIT/S2:S-CIT and S1:IMI/S2:S-CIT conditions. i S2:S-CIT is more stable in the presence of S1:S-CIT (salmon) than in the presence of S1:IMI (purple) measured by pairwise ligand RMSDs (see “Methods”).
Fig. 3
Fig. 3. Identification of high-affinity allosteric inhibitors for SERT.
a Chemical structure of three tested compounds, all based on S-CIT template with an amide instead of the cyano in S-CIT. They differ in having either none (AE), one (Lu AF60097) or two (AF) double bonds (stippled circles) in their N-substituent. b The allosteric potency of the compounds inhibiting the dissociation of [3H]S-CIT is within the micromolar range: Lu AF60097 (red), IC50 = 6.50 [5.07; 8.31] µM; AF (brown), IC50 = 10.4 [8.45; 12.9] µM; and AE (black), IC50 = 33.8 [30.7; 37.3] µM. Data are mean [S.E. interval], n = 3-5. c The allosteric potency increases to nanomolar concentrations when assessed by inhibition of [3H]IMI dissociation. IC50 values (in nM) for Lu AF60097, AF and AE are 31.4 [25.2; 39.1], 192 [173; 215], and 119 [103; 138], respectively (mean [S.E. interval], n = 3–6. d A zoomed-in view of S1:IMI (in purple)/S2:Lu AF60097 (in green), and e S1:S-CIT (in salmon)/S2:Lu AF60097 (in green) conditions. f Distribution of the Thr497 χ1 rotamer for S1:S-CIT/S2:Lu AF60097 (salmon) and S1:IMI/S2:Lu AF60097 (purple) conditions. g Distribution of the Glu494/S2:Lu AF60097 distance (minimum distance between the charged N of Lu AF60097 and the two carboxyl oxygens of Glu494) for S1:S-CIT/S2:Lu AF60097 (salmon) and S1:IMI/S2:Lu AF60097 (purple) conditions. Experiments in b and c are performed essentially as in Fig. 1 on membrane preparations from COS-7 cells transiently transfected with SERT WT. Data are shown as means ± SEM (error bars). Source data are provided as a Source Data file.
Fig. 4
Fig. 4. Evidence for binding of Lu AF60097 to the extracellular vestibule in SERT.
a A two-dimensional ligand interaction diagram showing the residues interacting with Lu AF60097 that have >50% interaction frequencies (see Supplementary Table 3). b Effect of SERT point mutations on Lu AF60097 allosteric potency measured as inhibition of [3H]IMI dissociation (dotted line represents effect on SERT WT for comparison). The mutations are proposed to be located to the S2 site. The mutations cause a 14- to 293-fold decrease in S2:Lu AF60097 affinity (Table 2), with F556R not possessing any measurable affinity (IC50 ≥ 10,000 nM). Allosteric potency on SERT WT is shown as dotted line. Data are shown as mean ± SEM (error bars), n = 3–6. Source data are provided as a Source Data file.
Fig. 5
Fig. 5. Pharmacologic properties of Lu AF60097 binding to SERT.
a Inhibition of [3H]5-HT uptake by Lu AF60097 in SERT WT and F556R. Intact COS-7 cells were pre-incubated with Lu AF60097 for 15 min before [3H]5-HT uptake was initiated. b Lu AF60097 inhibits [3H]5-HT uptake with a mixture of competitive and non-competitive mechanisms. Saturation uptake experiments for [3H]5-HT transport as a function of increasing Lu AF60097 concentrations (0–640 nM). The VMAX decreases with increasing Lu AF60097 (from 1180 ± 20 fmol/min (no Lu AF60097) to 920 ± 20 fmol/min (640 nM Lu AF60097). In addition, the KM-value for 5-HT increases with increasing concentration of Lu AF60097 (KM = 484 nM and 1650 nM for buffer only and 640 nM Lu AF60097, respectively (Supplementary Table 4). c Application of Lu AF60097 and imipramine together inhibits [3H]5-HT uptake synergistically. Imipramine (4 nM) and Lu AF60097 (27 nM) results in a minor inhibition of [3H]5-HT uptake (to 89.3 ± 0.8 and 94 ± 2% of control, respectively). In contrast, adding the same concentration of the two compounds together results in a significantly higher decrease of [3H]5-HT uptake (64.8 ± 0.3%). ****p < 0.001 relative to addition of either imipramine or Lu AF60097 alone (one-way ANOVA with Tukey’s multiple comparisons test). All experiments are performed on intact COS-7 cells transiently transfected with SERT WT. Data are shown as means ± SEM (error bars) of at least three experiments performed in triplicates. Source data are provided as a Source Data file.
Fig. 6
Fig. 6. Effects of Lu AF60097 and imipramine on 5-HT levels in rat hippocampus.
a Changes in extracellular 5-HT levels after injection (dotted line) of 1 µl (250 nM) Lu AF60097 (squares) or saline (circle) in ventral hippocampus of freely moving rats. The 5-HT levels show a continuous increase at all time points after the 40 min post injection bin to a maximum of 602 ± 156% of basal level (data are means ± S.E.M., n = 6). b Hippocampal perfusion of Lu AF60097 and imipramine synergistically increases extracellular 5-HT levels. Extracellular 5-HT levels were determined 40 min prior and 160 min after initiating (dotted line) a continuous perfusion of either saline (aCSF, circles), 1.9 µM Lu AF60097 (closed squares), 0.36 µM imipramine (open squares), 1.9 µM Lu AF60097 + 0.36 µM imipramine (triangles) in ventral hippocampus of freely moving rats. Inset: Area under the curve during perfusion (20–160 min) for the four conditions (matching colors to curves in main figure). The released 5-HT when perfused with both imipramine and Lu AF60097 is significantly increased (green bar). When perfused with either of the compounds alone (blue bars), the 5-HT levels are not different form saline (black bar). Data are means ± SEM (error bars), n = 9–15. The extracellular concentrations of 5-HT in both (a) and (b) are assessed by microdialysis and expressed as the percentage of the basal levels in the three fractions collected prior to perfusion start (dotted line). **P < 0.01, ***P < 0.001 vs. saline; ¤P < 0.05, ¤¤P < 0.01, ¤¤¤P < 0.001 vs. Lu AF60097; #P < 0.05, ##P < 0.01, ###P < 0.01 vs. imipramine; Bonferroni post-hoc test after significant RM two-way ANOVA or one-way ANOVA. Source data are provided as a Source Data file.

References

    1. Roth BL. Multiple serotonin receptors: clinical and experimental aspects. Ann. Clin. Psychiatry. 1994;6:67–78. doi: 10.3109/10401239409148985. - DOI - PubMed
    1. Kristensen AS, et al. SLC6 neurotransmitter transporters: structure, function, and regulation. Pharmacol. Rev. 2011;63:585–640. doi: 10.1124/pr.108.000869. - DOI - PubMed
    1. Saier MH, Jr., Tran CV, Barabote RD. TCDB: the transporter classification database for membrane transport protein analyses and information. Nucleic Acids Res. 2006;34:D181–D186. doi: 10.1093/nar/gkj001. - DOI - PMC - PubMed
    1. Gether U, Andersen PH, Larsson OM, Schousboe A. Neurotransmitter transporters: molecular function of important drug targets. Trends Pharmacol. Sci. 2006;27:375–383. doi: 10.1016/j.tips.2006.05.003. - DOI - PubMed
    1. Krishnan V, Nestler EJ. The molecular neurobiology of depression. Nature. 2008;455:894–902. doi: 10.1038/nature07455. - DOI - PMC - PubMed

Publication types

MeSH terms