. 2020 Mar 20;11(1):1485.
doi: 10.1038/s41467-020-15238-4.

Chromosome organization by a conserved condensin-ParB system in the actinobacterium Corynebacterium glutamicum

Affiliations

Chromosome organization by a conserved condensin-ParB system in the actinobacterium Corynebacterium glutamicum

Kati Böhm et al. Nat Commun. .

Abstract

Higher-order chromosome folding and segregation are tightly regulated in all domains of life. In bacteria, details on nucleoid organization regulatory mechanisms and function remain poorly characterized, especially in non-model species. Here, we investigate the role of DNA-partitioning protein ParB and SMC condensin complexes in the actinobacterium Corynebacterium glutamicum. Chromosome conformation capture reveals SMC-mediated long-range interactions around ten centromere-like parS sites clustered at the replication origin (oriC). At least one oriC-proximal parS site is necessary for reliable chromosome segregation. We use chromatin immunoprecipitation and photoactivated single-molecule localization microscopy to show the formation of distinct, parS-dependent ParB-nucleoprotein subclusters. We further show that SMC/ScpAB complexes, loaded via ParB at parS sites, mediate chromosomal inter-arm contacts (as previously shown in Bacillus subtilis). However, the MukBEF-like SMC complex MksBEFG does not contribute to chromosomal DNA-folding; instead, this complex is involved in plasmid maintenance and interacts with the polar oriC-tethering factor DivIVA. Our results complement current models of ParB-SMC/ScpAB crosstalk and show that some condensin complexes evolved functions that are apparently uncoupled from chromosome folding.


Conflict of interest statement

The authors declare no competing interests.

Figures

Fig. 1
Fig. 1. Chromosome organization hub at oriC domain in C. glutamicum.
a Top: genomic region including ten parS sites of C. glutamicum with 16 bp consensus sequences. Below: ChIP-seq data on ParB-mCherry DNA-binding protein confirm parS sites shown above. Exponentially growing C. glutamicum parB::parB-mCherry cells (CBK006) were used for in vivo anti-mCherry ChIP-seq experiments. Shown is the ratio of ChIP signal relative to the input (fold-enrichment IP/control) in 5 Kb bins in linear scale along the chromosome with an x-axis centered at oriC. Red labels indicate minor enrichment signals at highly transcribed regions, such as rRNA operons (letters A–F). b ParB-ChIP-seq enrichment encompassing 3.1–3.2 Mb genomic region; parS sites 1–10 are indicated (green lines). c Normalized genomic contact map derived from asynchronously grown cells (fast growth, growth rate (µ) ≥ 0.6 h−1, exponential phase). X- and Y-axes indicate chromosomal coordinates binned in 5 Kb; oriC-centered (purple bar—coordinate 0). Color scales, indicated beside the contact map, reflect contact frequency between two genomic loci from white to red (rare to frequent contacts). White dashed line on the contact matrix indicate the mean signal of the secondary diagonal and black triangles on the side of the contact matrix indicate the “cross like” signal. d Structural chromosome organization of the oriC region. Magnification of contacts within 500 Kb surrounding oriC; oriC is indicated as a purple line and parS sites are indicated by dashed lines. ParB-enrichment zones at parS are shown above the contact map (ChIP signal relative to the input in 5 Kb bins). White dashed line on the contact matrix indicate the mean signal of the secondary diagonal.
Fig. 2
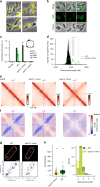
Fig. 2. A single parS site mediates chromosome folding.
a One parS site is necessary and sufficient for wild type-like morphology and nucleoid segregation. Phase-contrast images of exponentially grown cells harboring either all (WT), one (parS2-10mut, CBK023), or none (parS1-10mut, CBK024) parS site(s), or lacking parBparB, CDC003) are shown. DNA is stained with Hoechst (yellow). Scale bar, 2 µm. b Fluorescence microscopy analysis of parBparB-mCherry (shown in green) in wild type (CBK006), parS2-10mut (CBK027), and parS1-10mut backgrounds (CBK028). Absence of parS leads to diffuse cellular ParB localizations. Scale bar, 2 µm. c ChIP-qPCR for strains described before, normalized to wild-type parS1 signal (mean + SD, n = 3). d ChIP-seq of C. glutamicum parBparB-mCherry parS2-10mut (black) at a 3.1–3.2 Mb chromosomal range. Wild-type-like propagation (green) of ParB protein around parS1-4; 0.5 Kb bin size. Location of parS sites present in wild type or mutant sequences are indicated (gray lines). e Normalized contact maps of ΔparB, parS1-10mut, and parS2-10mut mutants centered at oriC (CDC003, CBK024, and CBK023). Color codes as in Fig. 1. f Differential maps correspond to the log2 of the ratio (wild-type norm/mutant norm); color scales indicate contact enrichment in mutant (blue) or wild type (red) (white indicates no differences between the two conditions). g Single-molecule localization microscopy of representative wild-type and parS2-10mut cells (CBK009 and CBK029). Top: Gaussian rendering of ParB-PAmCherry signals (0.71 PSF, 1 px = 10 nm), below: color-coded representation of ParB-PAmCherry events within corresponding cells; all events (light blue), macroclusters (dark blue) and subclusters (yellow) are indicated. Scale bar, 0.5 µm. See Methods and Supplementary Fig. 7 for details. h Comparison of ParB-PAmCherry cluster properties. Only the two biggest clusters per cell were taken into account for analyses; significant differences between conditions are indicated by small letters above datasets. Left: events per macrocluster, medians are indicated as solid lines, and whiskers mark 1.5 IQRs (interquartile ranges); clusterswild type: n = 130, clustersparS2-10mut: n = 143. Right: subcluster numbers per macrocluster shown as overlay bar chart for both strains. Number of subcluster per macrocluster (two-tailed Kruskal–Wallis rank-sum test: χ2 = 12.284, df = 1, p = 0.0004569) and macroclusters size (two-tailed Kruskal–Wallis rank-sum test: χ2 = 27.582, df = 1, p = 1.506e − 07) differ significantly between. Source data are provided as a Source Data file.
Fig. 3
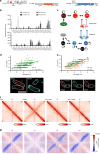
Fig. 3. Functional characterization of two SMC-like complexes in C. glutamicum.
a Sections of the C. glutamicum genome map indicating localizations of condensin subunit genes. b Confirmation of protein–protein interactions via bacterial two-hybrid screen. Interactions were quantified by β-galactosidase assays in all combinations of hybrid proteins: C/C- (18C/T25), N/C- (18/T25), C/N- (18C/NT25), and N/N- (18/NT25) terminal fusions of adenylate cyclase fragments, ParBRA: ParB mutant R175A (mean ± SD, n = 3). c Illustration of SMC/ScpAB and MksBEFG subunit interactions based on bacterial two-hybrid data; cartoons indicate condensin complex formations. d Top: dependence of ParB foci numbers on cell length in C. glutamicum wild type (WT) and Δsmc ΔmksB (ΔΔ, CBK011) cells grown in BHI (n > 350). Linear regression lines are shown r(WT) = 0.57, r(ΔΔ) = 0.62; slopes and intercepts are equal (ANCOVA, F(1, 770) = 0.059, p = 0.808; ANCOVA, F(1, 771) = 0.60, p = 0.4391). Below: cellular localization of condensin subunits in C. glutamicum smcsmc-mCherry and mksBmksB-mCherry cells (CBK012, CBK015). Microscopy images exemplify cellular mCherry fluorescence of SMC (left) and MksB (right); white lines indicate cell outlines. Scale bar, 2 µm. e Top: SMC and ParB foci numbers positively correlate with cell length in double labeled strain smcsmc-mCherry parBparB-mNeonGreen (CBK013), r(ParB) = 0.74, r(SMC) = 0.53 (n > 350). Below: subcellular localization of ParB and SMC is exemplified in representative cells shown in overlays between mNeonGreen and mCherry fluorescence, and in separate channels. Scale bar, 2 µm. f Normalized contact maps of Δsmc, ΔmksB, ΔparBsmc, and ΔsmcmksB mutants (CDC026, CBK001, CBK002, and CBK004), displayed as in Fig. 1. g Corresponding differential maps between WT and mutant contact maps, indicating the log of the ratio (wild-type norm/mutant norm) are presented as in Fig. 2. Source data are provided as a Source Data file.
Fig. 4
Fig. 4. Chromosomal SMC loading is mediated by ParB at parS sites.
a SMC enrichment at parS sites (gray) is ParB-dependent. ChIP-seq of ParB-mCherry (green; CBK006 and CBK047) and SMC-mCherry (orange; CBK012, CBK014, CBK051, and CBK049) in strain backgrounds as indicated. Depicted are chromosomal ranges of 3.1–3.2 Mb, bin size 0.5 Kb. b Whole-genome ChIP-seq data of strains harboring SMC-mCherry wild type (gray, CBK012) or E1084Q mutant (orange, CBK050). SMC enrichment at parS sites and at other loci (red letters), in particular tRNA gene clusters and at rRNA genes (af) is illustrated in 0.5 Kb bins in linear scale along the chromosome with an x-axis centered at oriC. c Normalized contact map of mutant strains parBparBR175A (CBK047) and d the corresponding differential map indicating the log of the ratio (wild-type norm/mutant norm) as in Fig. 2.
Fig. 5
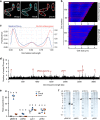
Fig. 5. MksB localizes with DivIVA and impacts on plasmid copy numbers.
a Epifluorescence microscopy images of CBK092 cells; MksB-mCherry (cyan) and DivIVA-mNeonGreen fluorescence (red) are shown as overlay and in separate channels; cell outlines are indicated by white lines. Scale bar, 2 µm. b Demographs show fluorescence profiles of DivIVA and MksB in strain CBK092 along cell axes sorted by length. Fluorescence intensities are illustrated relative to maximal intensity values per cell by a color gradient ranging from dark blue (low intensities) to red (high intensities). c Averaged fluorescence (a.u.) of MksB-mCherry (blue) and DivIVA-mNeonGreen (red) along the longitudinal cell axis of CBK092 cells (n > 200 cells). Fluorescence values of profiles were normalized in length and fluorescence intensity per cell. The resulting values were then binned (bin = 0.05 µm). d Anti-mCherry-ChIP-seq analysis of mksBmksB-mCherry strain CBK015 as described in Supplementary Fig. 4. e Plasmid copy numbers of low-copy (pBHK18 and pWK0) and high-copy number vectors (pJC1 and pEC0) relative to oriC numbers per cell, assayed by qPCR. Ratios were compared between C. glutamicum wild type, ΔmksB, and Δsmc mutant cells grown in BHI medium without addition of plasmid selection antibiotic after overnight pre-incubation with antibiotic (mean ± SD, n = 3). One-way ANOVAs yielded significant variations among strains harboring pBHK18 (F(2, 6) = 233.3, p = 2.05e − 06) and pWK0 (F(2, 6) = 98.66, p = 2.57e − 05), but not among strains harboring pEK0 (F(2, 6) = 2.496, p = 0.163) and pJC1 plasmids (F(2, 6) = 51.75, p = 0.0739). Letters indicate significant differences between data sets determined by post-hoc Bonferroni analysis at p < .05. f Plasmids named in a were extracted from C. glutamicum wild type and mksB deletion strains grown in BHI medium including selection antibiotic, visualization of extracted DNA on 1% agarose gels (corresponds to yield from ~1 × 109 cells each). Arrows indicate size of plasmid DNA. Source data are provided as a Source Data file.

References

    1. Sazer S, Schiessel H. The biology and polymer physics underlying large-scale chromosome organization. Traffic. 2018;19:87–104. doi: 10.1111/tra.12539. - DOI - PMC - PubMed
    1. Badrinarayanan A, Le TBK, Laub MT. Bacterial chromosome organization and segregation. Annu. Rev. Cell Dev. Biol. 2015;31:171–199. doi: 10.1146/annurev-cellbio-100814-125211. - DOI - PMC - PubMed
    1. Gruber S. Multilayer chromosome organization through DNA bending, bridging and extrusion. Curr. Opin. Microbiol. 2014;22:102–110. doi: 10.1016/j.mib.2014.09.018. - DOI - PubMed
    1. Kleckner N, et al. The bacterial nucleoid: nature, dynamics and sister segregation. Curr. Opin. Microbiol. 2014;22:127–137. doi: 10.1016/j.mib.2014.10.001. - DOI - PMC - PubMed
    1. Livny J, Yamaichi Y, Waldor MK. Distribution of centromere-like parS sites in bacteria: insights from comparative genomics. J. Bacteriol. 2007;189:8693–8703. doi: 10.1128/JB.01239-07. - DOI - PMC - PubMed

Publication types

MeSH terms

LinkOut - more resources