. 2020 Mar 20;10(1):5089.
doi: 10.1038/s41598-020-61560-8.

The genetic legacy of extreme exploitation in a polar vertebrate

Affiliations

The genetic legacy of extreme exploitation in a polar vertebrate

Anneke J Paijmans et al. Sci Rep. .

Erratum in

Abstract

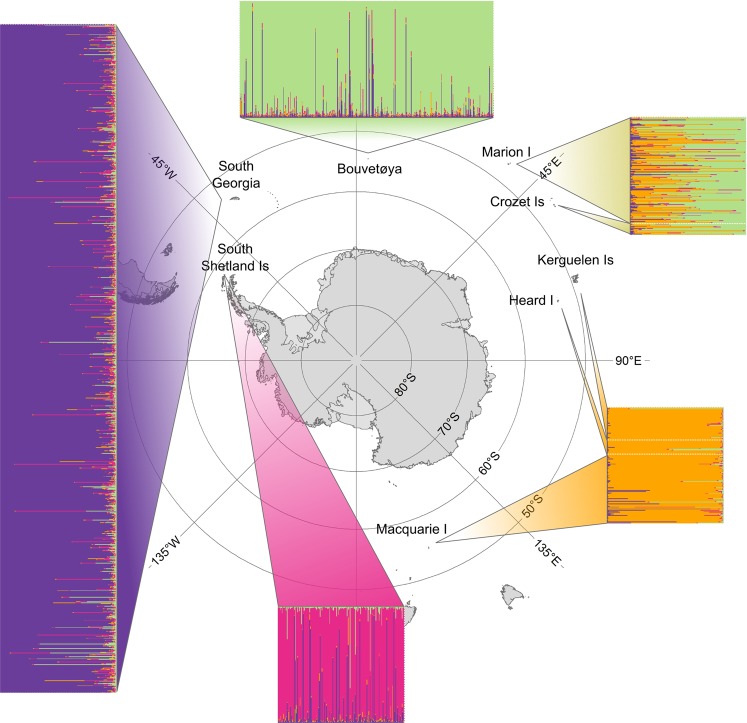
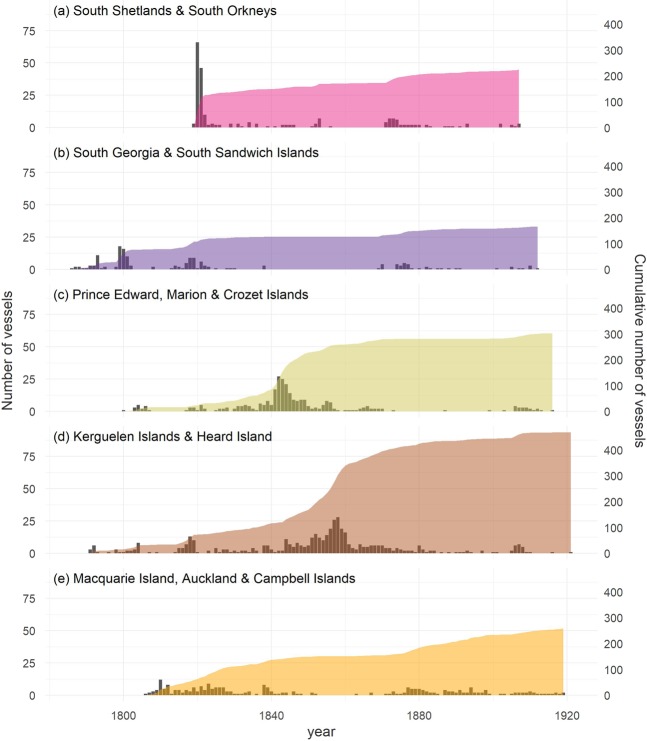
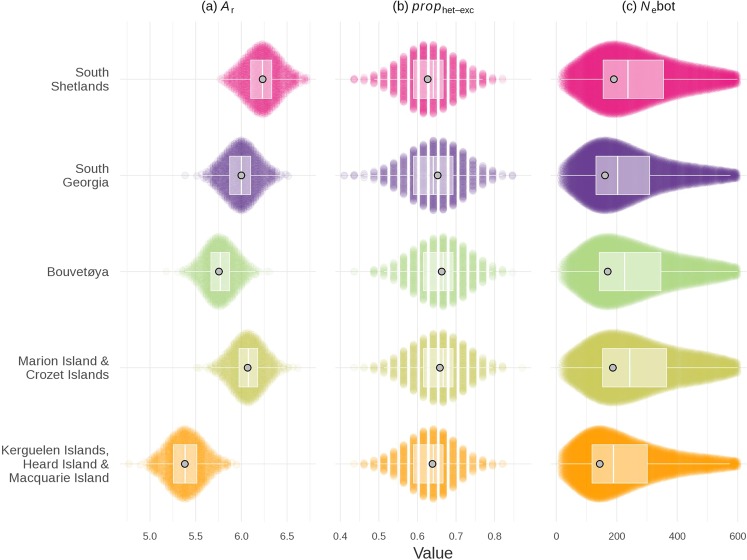
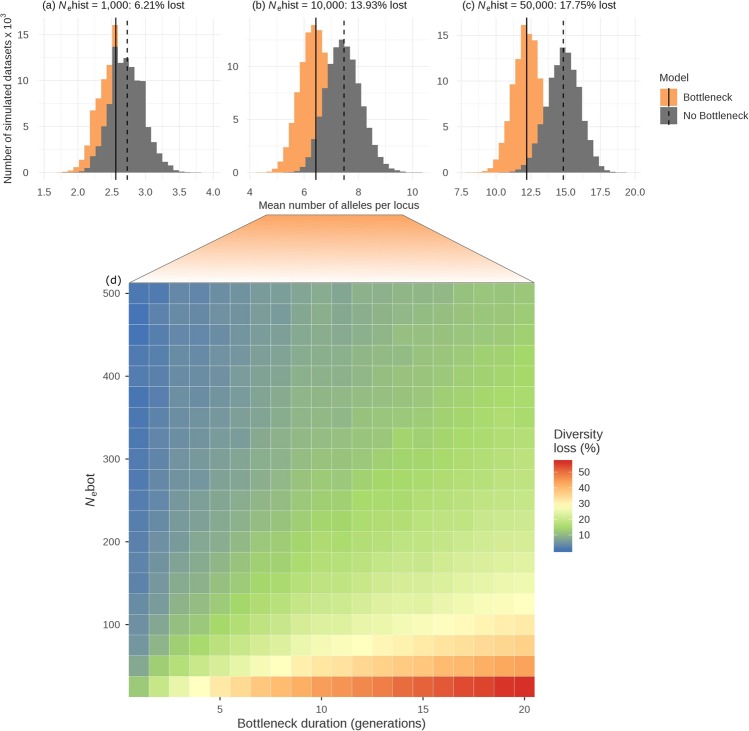
Understanding the effects of human exploitation on the genetic composition of wild populations is important for predicting species persistence and adaptive potential. We therefore investigated the genetic legacy of large-scale commercial harvesting by reconstructing, on a global scale, the recent demographic history of the Antarctic fur seal (Arctocephalus gazella), a species that was hunted to the brink of extinction by 18th and 19th century sealers. Molecular genetic data from over 2,000 individuals sampled from all eight major breeding locations across the species' circumpolar geographic distribution, show that at least four relict populations around Antarctica survived commercial hunting. Coalescent simulations suggest that all of these populations experienced severe bottlenecks down to effective population sizes of around 150-200. Nevertheless, comparably high levels of neutral genetic variability were retained as these declines are unlikely to have been strong enough to deplete allelic richness by more than around 15%. These findings suggest that even dramatic short-term declines need not necessarily result in major losses of diversity, and explain the apparent contradiction between the high genetic diversity of this species and its extreme exploitation history.


Conflict of interest statement

The authors declare no competing interests.

Figures

Figure 1
Figure 1
Global population structure of the Antarctic fur seal inferred by STRUCTURE analysis of 2,000 individuals from eight populations genotyped at 39 microsatellite loci. Each individual is represented by a bar with the proportions of the different colours indicating the estimated membership to each of four inferred genetic populations (see Results for details). The data are plotted separately for each sampling location as indicated on the map. The map was created using ArcMap v. 10.6 https://desktop.arcgis.com/en/arcmap/.
Figure 2
Figure 2
The spatial and temporal distribution of sealing effort, defined as the number of ships recorded as having visited each of the main sealing grounds. Data are replotted from Headland with the permission of the author. The islands are grouped into sealing grounds because individual ships often visited more than one island within a given geographical region; no data were available for Bouvetøya. Annual numbers of ships are shown on the left axis while the cumulative total is shown on the right axis (South Shetlands & South Orkneys = 225, South Georgia & South Sandwich Islands = 167, Prince Edward, Marion Island and Crozet Islands = 303, Kerguelen Islands and Heard Island = 469, Macquarie Island, Auckland & Campbell Islands = 259).
Figure 3
Figure 3
Patterns of genetic diversity and bottleneck signatures across the geographic range of the Antarctic fur seal. (a) Genetic diversity summarised as allelic richness (Ar); (b) The proportion of loci in heterozygosity excess (prophet-exc) calculated for the TPM80 model; (c) Estimated bottleneck effective population sizes (Nebot). Data are summarised according to the five main populations identified by the STRUCTURE analysis (see Results for details). To facilitate visual comparisons among populations with different sample sizes while incorporating sampling error, we plotted 1,000 subsets of ten randomly sampled individuals per population as Sinaplots, with the exception of the sinaplot for Nebot, which shows parameter values for 5,000 accepted simulations based on 181 individuals per population. Boxplots (centre line = median, bounds of box = 25th and 75th percentiles, upper and lower whiskers = largest and lowest value but no further than 1.5 * inter-quartile range from the hinge) are superimposed with light grey points representing maximum densities. Bottleneck measures for Marion and Crozet Islands should be interpreted with caution due to admixture.
Figure 4
Figure 4
The expected loss of genetic diversity caused by recent bottlenecks. Panels (a–c) show the distributions of mean allele numbers across loci obtained from 100,000 neutral coalescent simulations of a bottleneck to an Nebot of 200 for ten generations (orange) and a constant population size scenario (grey) with three different pre-bottleneck effective population sizes (Nehist). Panel (d) further explores the effects of bottleneck duration and strength on the expected loss of allelic diversity under the scenario shown in panel (b) as described in the Methods.

References

    1. Erickson JD. Endangering the economics of extinction. Wildl. Soc. Bull. 2000;28:34–41.
    1. Peres, C. A. Overharvesting. In Conservation biology for all (eds. Sodhi, N. S. & Ehrlich, P. R.) (Oxford University Press, 2010).
    1. IUCN red list of threatened species: a global species assessment. (IUCN, 2004). 2004
    1. Farrow S. Extinction and market forces: two case studies. Ecol. Econ. 1995;13:115–123. doi: 10.1016/0921-8009(94)00075-7. - DOI
    1. Worm B, et al. Rebuilding global fisheries. Science. 2009;325:578–585. doi: 10.1126/science.1173146. - DOI - PubMed

Publication types