. 2020 Mar 20;10(1):5095.
doi: 10.1038/s41598-020-61736-2.

Glioblastoma infiltration of both tumor- and virus-antigen specific cytotoxic T cells correlates with experimental virotherapy responses

Affiliations

Glioblastoma infiltration of both tumor- and virus-antigen specific cytotoxic T cells correlates with experimental virotherapy responses

Quazim A Alayo et al. Sci Rep. .

Abstract

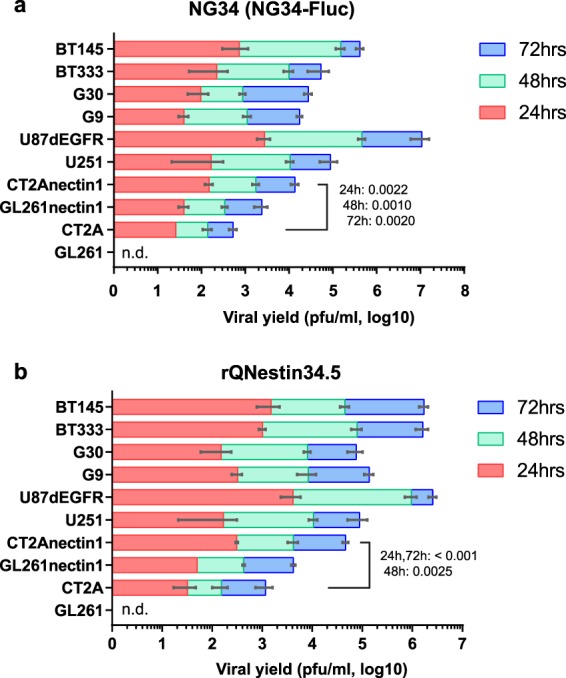
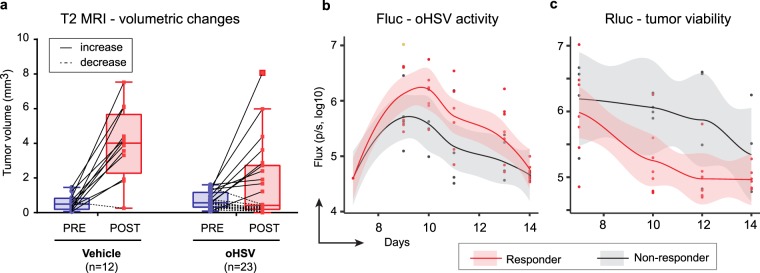
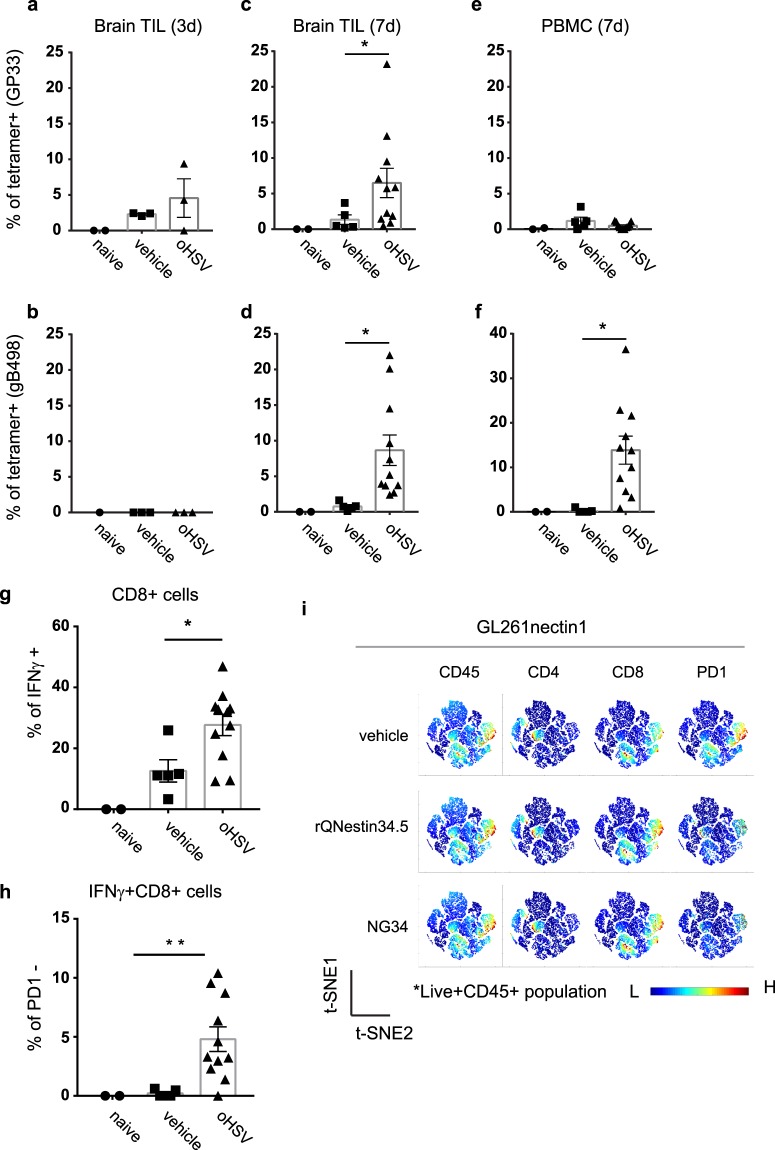
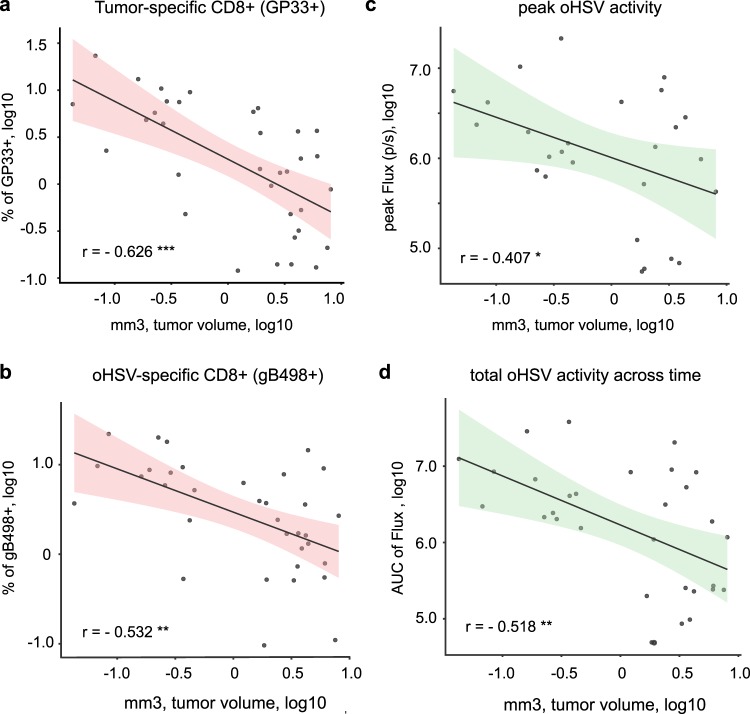
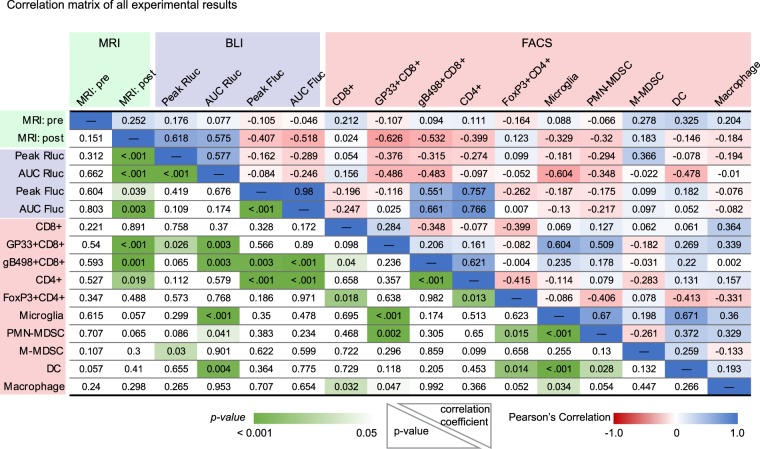
The mode of action for oncolytic viruses (OVs) in cancer treatment is thought to depend on a direct initial cytotoxic effect against infected tumor cells and subsequent activation of immune cell responses directed against the neoplasm. To study both of these effects in a mouse model of glioblastoma (GBM), we employed murine GBM cells engineered to constitutively express the type I Herpes Simplex Virus (HSV1) HSV-1 receptor, nectin-1, to allow for more efficient infection and replication by oncolytic HSV (oHSV). These cells were further engineered with a surrogate tumor antigen to facilitate assays of T cell activity. We utilized MRI-based volumetrics to measure GBM responses after injection with the oHSV and bioluminescent imaging (BLI) to determine oHSV replicative kinetics in the injected tumor mass. We found increased infiltration of both surrogate tumor antigen- and oHSV antigen-specific CD8+ T cells within 7 days after oHSV injection. There was no increase in tumor infiltrating CD8+ T cells expressing "exhaustion" markers, yet oHSV infection led to a reduction in PD-1+ CD8+ T cells in injected GBMs and an increase in IFNγ+ CD8+ T cells. There was a significant direct correlation between oHSV-mediated reduction in GBM volume and increased infiltration of both viral and tumor antigen-specific CD8+ T cells, as well as oHSV intratumoral gene activity. These findings imply that CD8+ T cell cytotoxicity against both tumor and viral antigens as well as intratumoral oHSV gene expression are important in oHSV-mediated GBM therapy.


Conflict of interest statement

E.A.C. is currently a paid advisor to Advantagene Inc., Insightec, Inc., and DNAtrix Inc. and has equity interest in DNAtrix; He has received research support from Advantagene, NewLink Genetics and Amgen. H.N. has received research support from NewLink Genetics. H.N. was a technical consultant for Oncorus INC and has received compensation. W.F.G is a consultant for Oncorus INC and has received compensation. D.A.R. (DFCI) has received research support from Acerta Phamaceuticals; Agenus; Celldex; EMD Serono; Incyte; Inovio; Midatech; Omniox; Tragara. D.A.R. is currently paid advisory/consultant for Abbvie; Advantagene; Agenus; Amgen; Bayer; Bristol-Myers Squibb; Celldex; DelMar; EMD Serono; Genentech/Roche; Inovio; Merck; Merck KGaA; Monteris; Novocure; Oncorus; Oxigene; Regeneron; Stemline; Taiho Oncology, Inc. Other authors declare no competing interests. E.A.C. has also advised Oncorus, Merck, Tocagen, Ziopharm, Stemgen, NanoTx., Ziopharm Oncology, Cerebral Therapeutics, Genenta. Merck, Janssen, Karcinolysis, Shanaghai Biotech. H.N. and E.A.C are named inventors on patents related to oncolytic HSV1.

Figures

Figure 1
Figure 1
Replication kinetics of two oncolytic HSVs (a; NG34-Fluc, b; rQNestin34.5) in mouse and human GBM cells. The day after plating cells, oHSV were added at a MOI of 0.1. Stacked bars show viral yields at 24 (red), 48 (green), and 72 hours (blue). GL261 and CT2A are parental mouse GBM cells, while GL261nectin1 and CT2Anectin1 express the HSV-1 receptor Nectin-1. Human U251, U87ΔEGFR are established human GBM lines which are readily infected by oHSV, while G9, G30, BT333, and BT145 are patient-derived human GBMs grown under GBM stem-like conditions. Error bars shows SD (n = 3).Values on the stacked bars show P-values with Holm-Sidak t-test of CT2A vs CT2Anectin1 at 24, 48 and 72 hours. n.d. = not detected.
Figure 2
Figure 2
Analysis of oHSV treatment responders vs. non-responders. (a) MRI-measured tumor volumes are plotted with bars separately for vehicle (PBS) and oHSV treatment groups. Tumor volumes before (PRE; blue) and after treatment (POST; red) are plotted with a solid line for increased volumes or dotted line for decreased or unchanged volumes. Individual experimental data and MRI schedule are detailed in Fig. S3,b, e,h. Optical bioluminescent images were captured before and after injection of the appropriate substrate for firefly luciferase (Fluc; b) and renilla (Rluc; c) at multiple-time points in experiment 2. Scatter plots (dot), non-linear regression curve (solid line) and two-sided 95% confidential intervals (shadow) are shown for each graph. oHSV treatment mice were divided in two groups based on tumor responses by MRI from panel a: Non-responder (gray shadow with solid black line) and responder (light red shadow with solid red line). BLI and MRI results of Individual mouse on the time-course are also shown in Fig. S3.
Figure 3
Figure 3
Immune cell analyses. (af) CD8+ T cells against GP33 (GBM antigen; panel a,c,e) or gB498 (oHSV antigen; panel b,d,f), 3 (left panels) or 7 (middle and right) days after oHSV or PBS injection in GBMs (labeled as CT2Agp33nectin1) implanted in mouse brains. CD8+ T cells were gated from CD45+TCRβ+ population isolated by Percoll gradient-enriched leukocytes from excised brains (Brain TIL) and PBMCs. GP33 or gB498+ CD8+ T-cells were stained with corresponding tetramers. Controls were from tumor-free native mouse brains (Naïve) compared to vehicle or oHSV injected mouse brains. Each dot represents an individual mouse sample. The bars represent the mean and the range represents the SEM. (g) Percent of GBM-infiltrating whole CD8+ T cells and (h) PD-1-negative CD8+ T cells that express IFNγ, 7 days after oHSV injection. *p < 0.05, one-way ANOVA; (i) Unbiased immune marker analysis by t-Distributed Stochastic Neighboring viSNE revealed PD-1 downregulation on the cytotoxic CD8+ T cells in brains from murine GL261nectin1 GBM-bearing C57Bl/6 mice after oHSV treatment (rQNestin34.5 and NG3420) at day 7 compared to naïve control group.
Figure 4
Figure 4
Tumor volume correlations with tumor- and oHSV-specific CD8+ T-cell infiltrates and oHSV gene expression. MRI and BLI data from three separate experiments were combined to generate scatter dot plots and a linear regression line with the two-sided 95% confidence interval (pink or green shadows). Timing of MRI scans and BLI at various times post-treatment in each experiment are summarized in Fig. S3a. Tumor volumes measured by MRI were tested as follows; FACS analyzed data of (a) GP33 tetramer+ CD8+TCRβ+CD45+live+ cell population, (b) gB498 tetramer+ CD8+TCRβ+CD45+live+ cells population, or BLI-based data of (c) peak signals of Fluc flux or (d) AUC of Fluc across time-points (Fig. S3a). Each plot includes the Pearson’s correlation coefficient (r) and p-value (* < 0.05, **<0.01, *** < 0.001) which are detailed further in Fig. 5.
Figure 5
Figure 5
Statistical tests of significance and Pearson’s correlation coefficients between measured variables in the tumor microenvironment. Three independent experiments from MRI, BLI and FACS were aggregated to analyze correlations between two variables. Pearson’s correlation coefficient and p values for each variable against the other is shown in the upper right and lower left of the table, respectively. The color gradient shows the strength of correlation, as direct (blue), inverse (red), and its significance (green). Details are in the Materials and Methods section.

References

    1. Lawler SE, Chiocca EA. Oncolytic virus-mediated immunotherapy: A combinatorial approach for cancer treatment. J Clin Oncol. 2015;33:2812–4. doi: 10.1200/JCO.2015.62.5244. - DOI - PubMed
    1. Andtbacka RH, et al. Talimogene laherparepvec improves durable response rate in patients with advanced melanoma. J Clin Oncol. 2015;33:2780–8. doi: 10.1200/JCO.2014.58.3377. - DOI - PubMed
    1. Bommareddy PK, Shettigar M, Kaufman HL. Integrating oncolytic viruses in combination cancer immunotherapy. Nat Rev Immunol. 2018;18:498–513. doi: 10.1038/s41577-018-0014-6. - DOI - PubMed
    1. Chiocca EA, Rabkin SD. Oncolytic viruses and their application to cancer immunotherapy. Cancer Immunol Res. 2014;2:295–300. doi: 10.1158/2326-6066.CIR-14-0015. - DOI - PMC - PubMed
    1. Vile RG. The immune system in oncolytic immunovirotherapy: Gospel, schism and heresy. Mol Ther. 2018;26:942–946. doi: 10.1016/j.ymthe.2018.03.007. - DOI - PMC - PubMed

Publication types

MeSH terms