. 2020 Mar 20;11(1):1503.
doi: 10.1038/s41467-020-15026-0.

Dissecting the role of PfAP2-G in malaria gametocytogenesis

Affiliations

Dissecting the role of PfAP2-G in malaria gametocytogenesis

Gabrielle A Josling et al. Nat Commun. .

Abstract

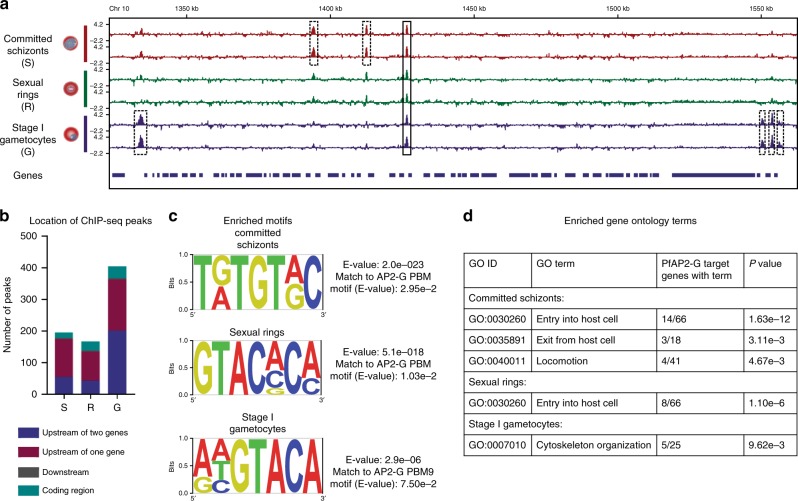
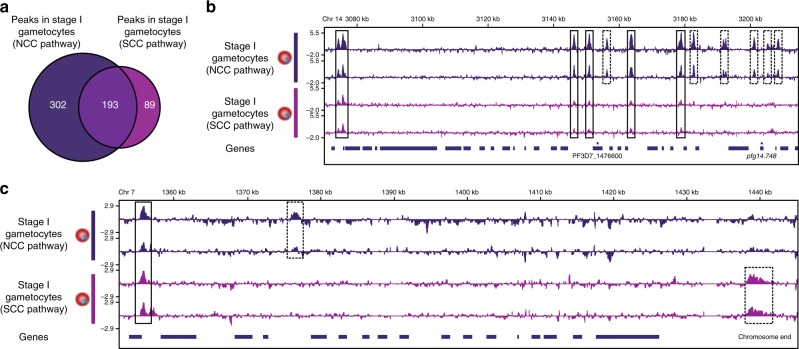
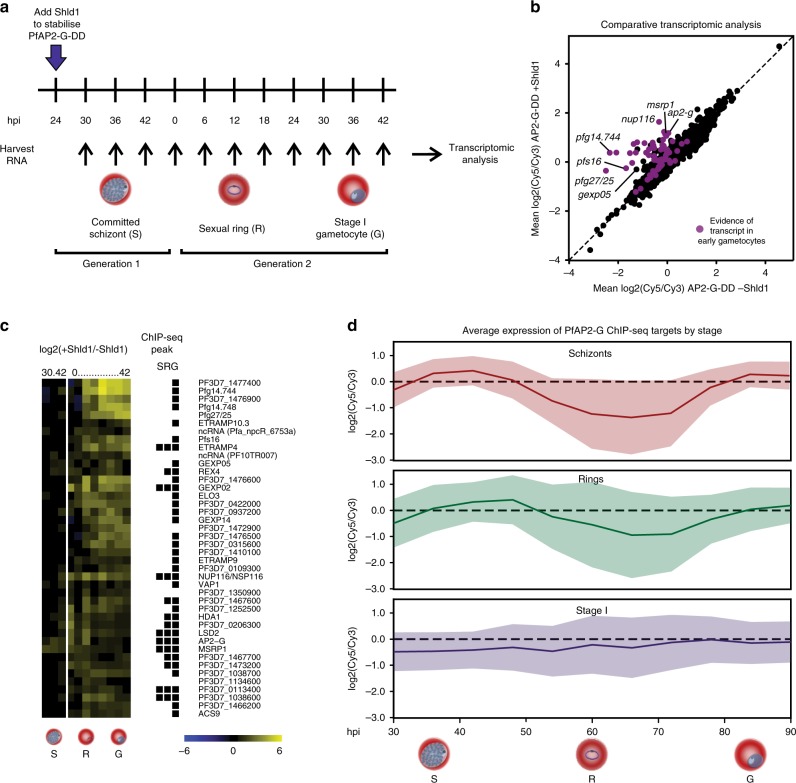
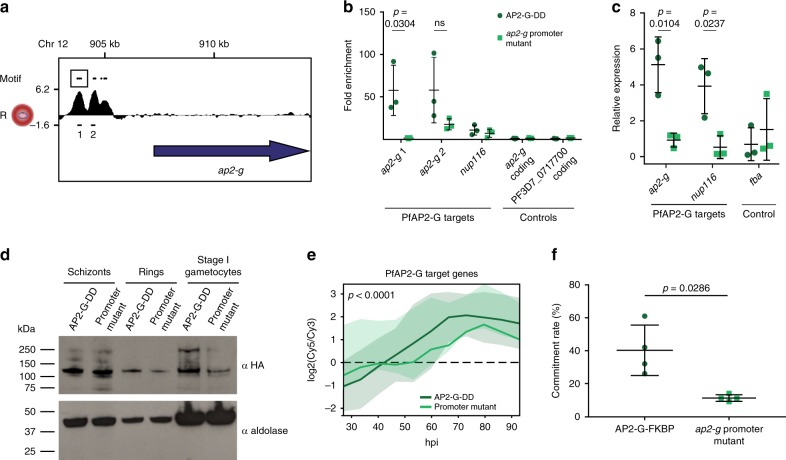
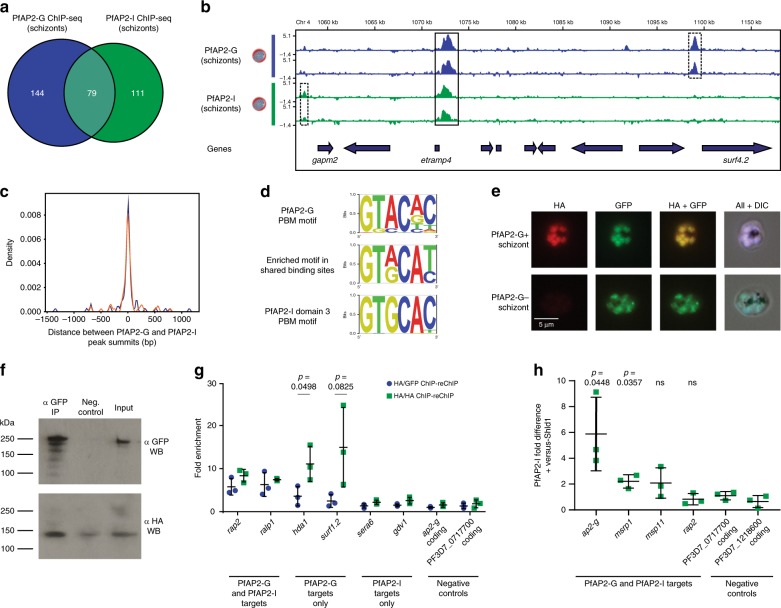
In the malaria parasite Plasmodium falciparum, the switch from asexual multiplication to sexual differentiation into gametocytes is essential for transmission to mosquitos. The transcription factor PfAP2-G is a key determinant of sexual commitment that orchestrates this crucial cell fate decision. Here we identify the direct targets of PfAP2-G and demonstrate that it dynamically binds hundreds of sites across the genome. We find that PfAP2-G is a transcriptional activator of early gametocyte genes, and identify differences in PfAP2-G occupancy between gametocytes derived via next-cycle and same-cycle conversion. Our data implicate PfAP2-G not only as a transcriptional activator of gametocyte genes, but also as a potential regulator of genes important for red blood cell invasion. We also find that regulation by PfAP2-G requires interaction with a second transcription factor, PfAP2-I. These results clarify the functional role of PfAP2-G during sexual commitment and early gametocytogenesis.


Conflict of interest statement

The authors declare no competing interests.

Figures

Fig. 1
Fig. 1. PfAP2-G dynamically binds hundreds of sites across the genome throughout commitment and early gametocytogenesis.
a Log2-transformed PfAP2-G ChIP/input ratio tracks for committed schizonts (red), sexual rings (green), and stage I gametocytes (purple) over a region of chromosome 10. Dashed boxes highlight stage-specific binding sites and solid boxes indicate common binding sites. The blue bars underneath show the locations of genes. Data are shown for each of two biological replicates per stage. b Bar plot showing the number of PfAP2-G binding sites identified in each stage using ChIP-seq, with the location of each peak indicated by colour. c DNA motif analysis of ChIP-seq peaks using DREME identified GTRC (committed schizonts) and GTAC (sexual rings and stage I gametocytes) as the top-scoring motifs. Comparison of each motif to known DNA motifs bound by recombinant AP2 domains using Tomtom showed that all three motifs match most closely to the DNA motif bound by the AP2 domain of PfAP2-G. d Gene ontology analysis of the closest genes within 2kb of a PfAP2-G binding site for each stage.
Fig. 2
Fig. 2. Stage I gametocytes resulting from next cycle conversion (NCC) and same cycle conversion (SCC) have major differences in PfAP2-G occupancy.
a Venn diagram showing that although PfAP2-G has many common targets in stage I gametocytes produced via next-cycle conversion and same-cycle conversion, there are also many differences. bandc, Log2-transformed PfAP2-G ChIP/input ratio tracks for stage I gametocytes derived via NCC (purple) and those derived via SCC (pink) across a region of chromosome 14 (b) and the end of chromosome 7 (c). The blue bars underneath show the locations of genes. Data are shown for each of two biological replicates per stage. Dashed boxes highlight stage-specific binding sites and solid boxes indicate common binding sites. Asterisks in bindicate genes known to be more highly expressed in NCC gametocytes than in SCC gametocytes.
Fig. 3
Fig. 3. PfAP2-G directly regulates many early gametocyte genes.
a Schematic showing the design of the transcriptomic timecourse using AP2-G-DD. The AP2-G-DD line8, which allows for conditional stabilisation or degradation of PfAP2-G depending on the presence of Shld1, was used to identify PfAP2-G target genes. Transcript levels were compared in parallel cultures grown in the presence and absence of Shld1. The timecourse included committed schizonts (S), sexual rings (R), and stage I gametocytes (G). b Scatterplot showing mean expression of all transcripts in AP2-G-DD +Shld1 versus AP2-G-DD -Shld1. Transcripts that have been identified in committed schizonts and early gametocytes13,18,20,27are in purple. Several genes of particular interest are highlighted. c Heatmap showing expression of significantly differentially expressed transcripts (FDR ≤ 0.1 using Significance Analysis of Microarrays, fold change ≥ 1.5) over time in AP2-G-DD +Shld1 compared to AP2-G-DD -Shld1. The black squares to the right indicate whether or not the gene has a ChIP-seq peak upstream of it in each of the three stages tested. d Plot showing mean temporal expression of schizont, ring, and stage I gametocyte ChIP-seq targets in the AP2-G-DD line +Shld1. The shaded area indicates the standard deviation. Differences in expression of the three sets of target genes were tested by two-way ANOVA (schizonts vs. rings: p = 0.0097, schizonts vs. stage I: p < 0.0001, rings vs. stage I: p < 0.0001). Source data are provided as a Source Data file.
Fig. 4
Fig. 4. PfAP2-G regulates its own transcription.
a Log2-transformed PfAP2-G ChIP/input ratio tracks for the ap2-g locus in sexual rings. The blue arrow shows the coding sequence. The positions of the PfAP2-G motifs (GTACNC) in the promoter are shown above and the box highlights the three that were mutated. The black lines below indicate the regions of the promoter tested by qPCR in panel c (not to scale). Data are shown for one of the two biological replicates. b ChIP-qPCR performed in ring-stage parasites shows that in the ap2-gpromoter mutant, PfAP2-G is no longer able to bind the region of the promoter containing the mutations. It is still able to bind two other target sites, though at a reduced level compared to its parent. The black bars indicate the mean and standard deviation. n = 3 biologically independent samples. Statistical significance was tested for using t-tests.ns = not statistically significant. c qRT-PCR performed in ring-stage parasites shows that mutation of the ap2-gpromoter leads to reduced levels of ap2-gtranscript and that of a target gene. The black bars indicate the mean and standard deviation. n = 3 biologically independent samples. Statistical significance was tested for using t-tests. d Western blot showing PfAP2-G protein levels in the AP2-G-DD line and the ap2-g promoter mutant parasite line. Aldolase (bottom panel) was used as a loading control. e Plot showing mean temporal expression of the 42 known PfAP2-G targets (from Fig. 1d) in the ap2-g promoter mutant (light green) and the parental line (dark green). The shaded regions show the standard deviation. Differences in expression between the promoter mutant and its parent were tested by two-way ANOVA. f The ap2-gpromoter mutant has a lower commitment rate than its parent. The horizontal bars indicate the mean and standard deviation. n = 4 biologically independent samples. The p-value was calculated using the two-tailed Mann-Whitney U test. Source data for panels b-f are provided as a Source Data file.
Fig. 5
Fig. 5. PfAP2-G interacts with the transcription factor PfAP2-I.
a Venn diagram showing overlap between PfAP2-G and PfAP2-I binding sites in schizonts in ChIP-seq experiments performed using a parasite line expressing both AP2-G-HA-DD and AP2-I-GFP. b Log2-transformed PfAP2-G (blue) and PfAP2-I (green) ChIP/input ratio tracks for schizonts over a region of chromosome 4. Dashed boxes highlight factor-specific binding sites and solid boxes indicate common binding sites. The blue arrows underneath show the locations of genes. Data are shown for each of two biological replicates per factor. c Plot showing the distances between PfAP2-G and PfAP2-I peak summits within the 79 regions bound by both proteins. Replicate 1 is shown in blue and replicate 2 is shown in orange. d The top enriched motif (determined by DREME) found in the regions bound by both PfAP2-G and PfAP2-I is a composite of the PfAP2-G and PfAP2-I protein-binding microarray DNA motifs. e IFA images show that AP2-G+ cells also express PfAP2-I, though not all cells express PfAP2-G. f Immunoprecipitation of AP2-I-GFP followed by Western blot with anti-HA and anti-GFP shows that PfAP2-I and PfAP2-G interact. The uncropped original image isprovided as a Source Data file. g ChIP-reChIP-qPCR shows PfAP2-G and PfAP2-I bind some gene promoters together in schizonts. Data are represented as fold enrichment relative to a negative control ChIP-reChIP with non-immune IgG. The horizontal bars indicate the mean and standard deviation. n = 3 biologically independent samples. Statistical significance was tested for using t-tests. h ChIP performed on PfAP2-I in schizonts shows that some sites have greater enrichment of PfAP2-I in the presence of PfAP2-G, indicative of cooperative binding. Data are represented as the fold change in enrichment of PfAP2-I in a cells treated with Shld1 versus those without Shld1. The horizontal bars indicate the mean and standard deviation. n = 3 biologically independent samples. t-tests were performed to compare the fold change for a region to that of the negative control (Pf3D7_071700 coding). ns = not statistically significant. Raw fold enrichment values are shown in Supplementary Fig. 12. Source data for panels g-h are provided as a Source Data file.

References

    1. World Health Organization. World Malaria Report 2017. (2017).
    1. Bruce MC, Alano P, Duthie S, Carter R. Commitment of the malaria parasite Plasmodium falciparum to sexual and asexual development. Parasitology. 1990;100 Pt 2:191–200. doi: 10.1017/S0031182000061199. - DOI - PubMed
    1. Bancells C, et al. Revisiting the initial steps of sexual development in the malaria parasite Plasmodium falciparum. Nat. Microbiol. 2019;4:144–154. doi: 10.1038/s41564-018-0291-7. - DOI - PMC - PubMed
    1. Josling GA, Llinas M. Sexual development in Plasmodium parasites: knowing when it’s time to commit. Nat. Rev. Microbiol. 2015;13:573–587. doi: 10.1038/nrmicro3519. - DOI - PubMed
    1. Josling, G. A., Williamson, K. C. & Llinas, M. Regulation of sexual commitment and gametocytogenesis in malaria parasites. Annu. Rev. Microbiol.10.1146/annurev-micro-090817-062712 (2018). - PMC - PubMed

Publication types

MeSH terms