. 2020 Jun 3;106(5):727-742.e6.
doi: 10.1016/j.neuron.2020.02.034. Epub 2020 Mar 20.

Alzheimer's Risk Factors Age, APOE Genotype, and Sex Drive Distinct Molecular Pathways

Affiliations

Alzheimer's Risk Factors Age, APOE Genotype, and Sex Drive Distinct Molecular Pathways

Na Zhao et al. Neuron. .

Abstract

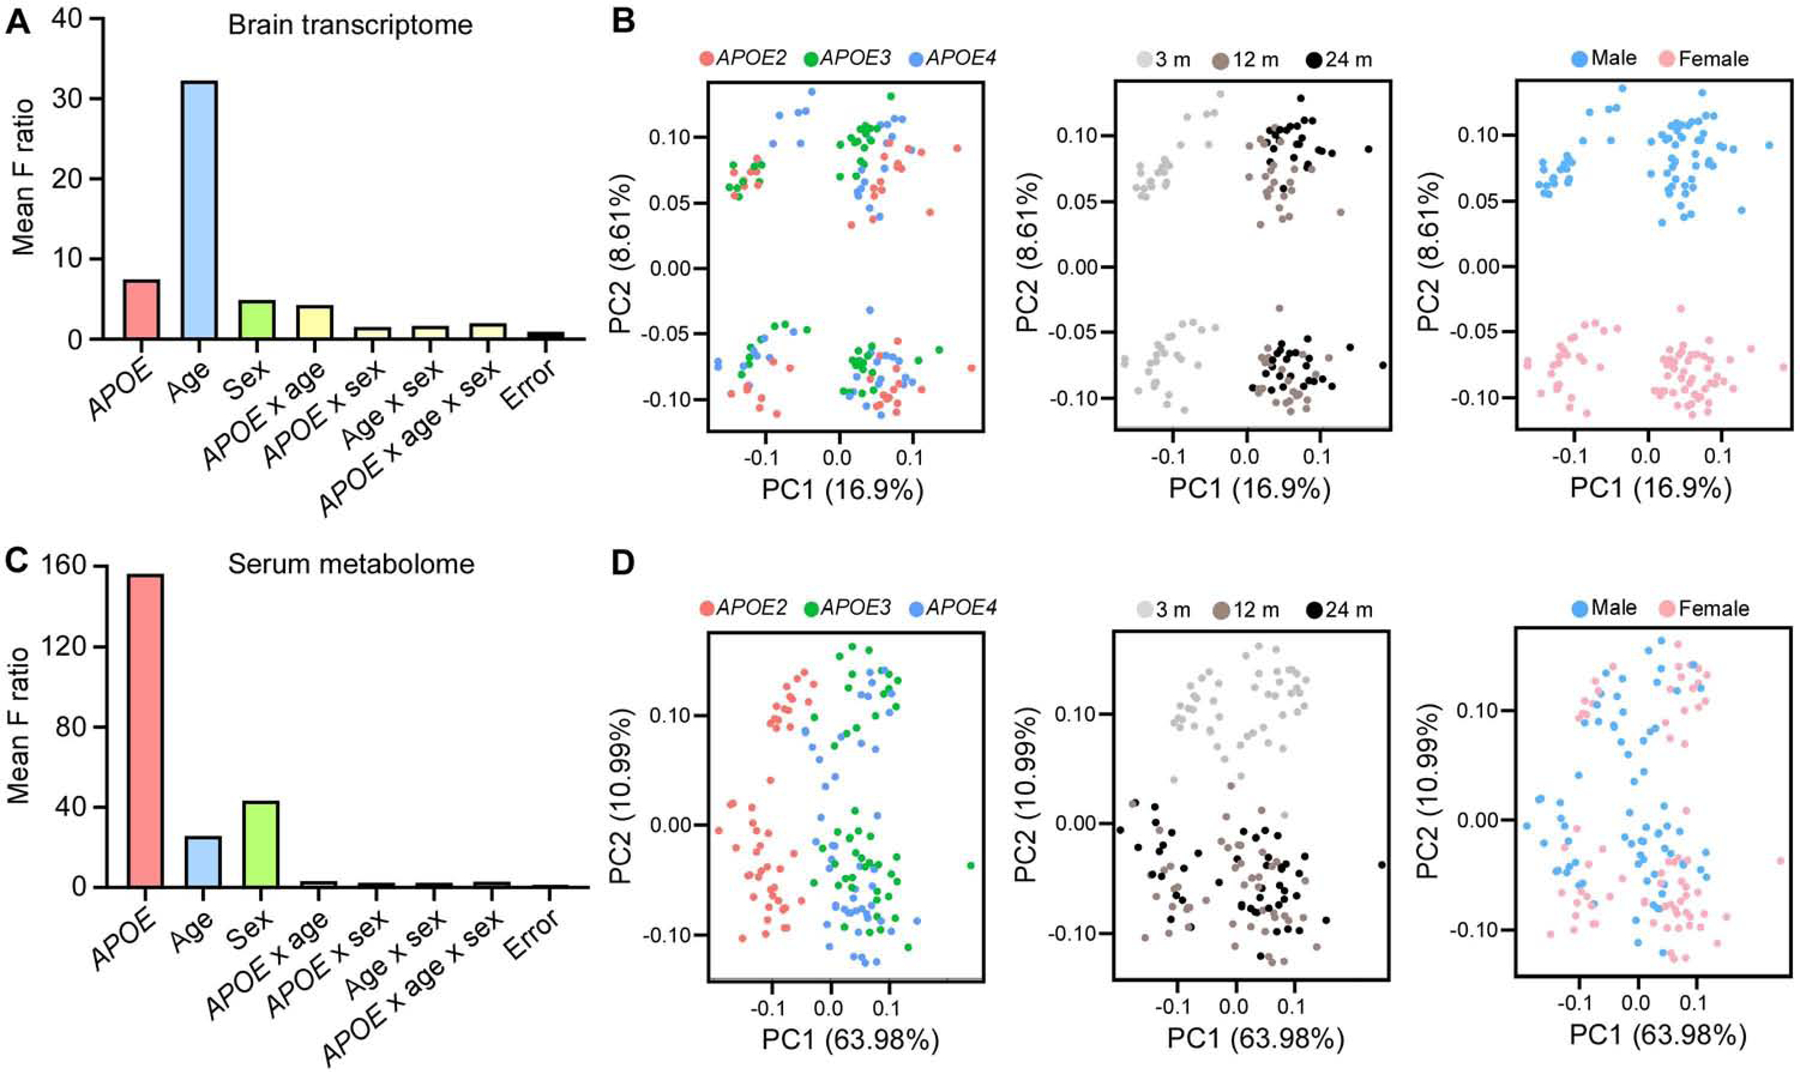
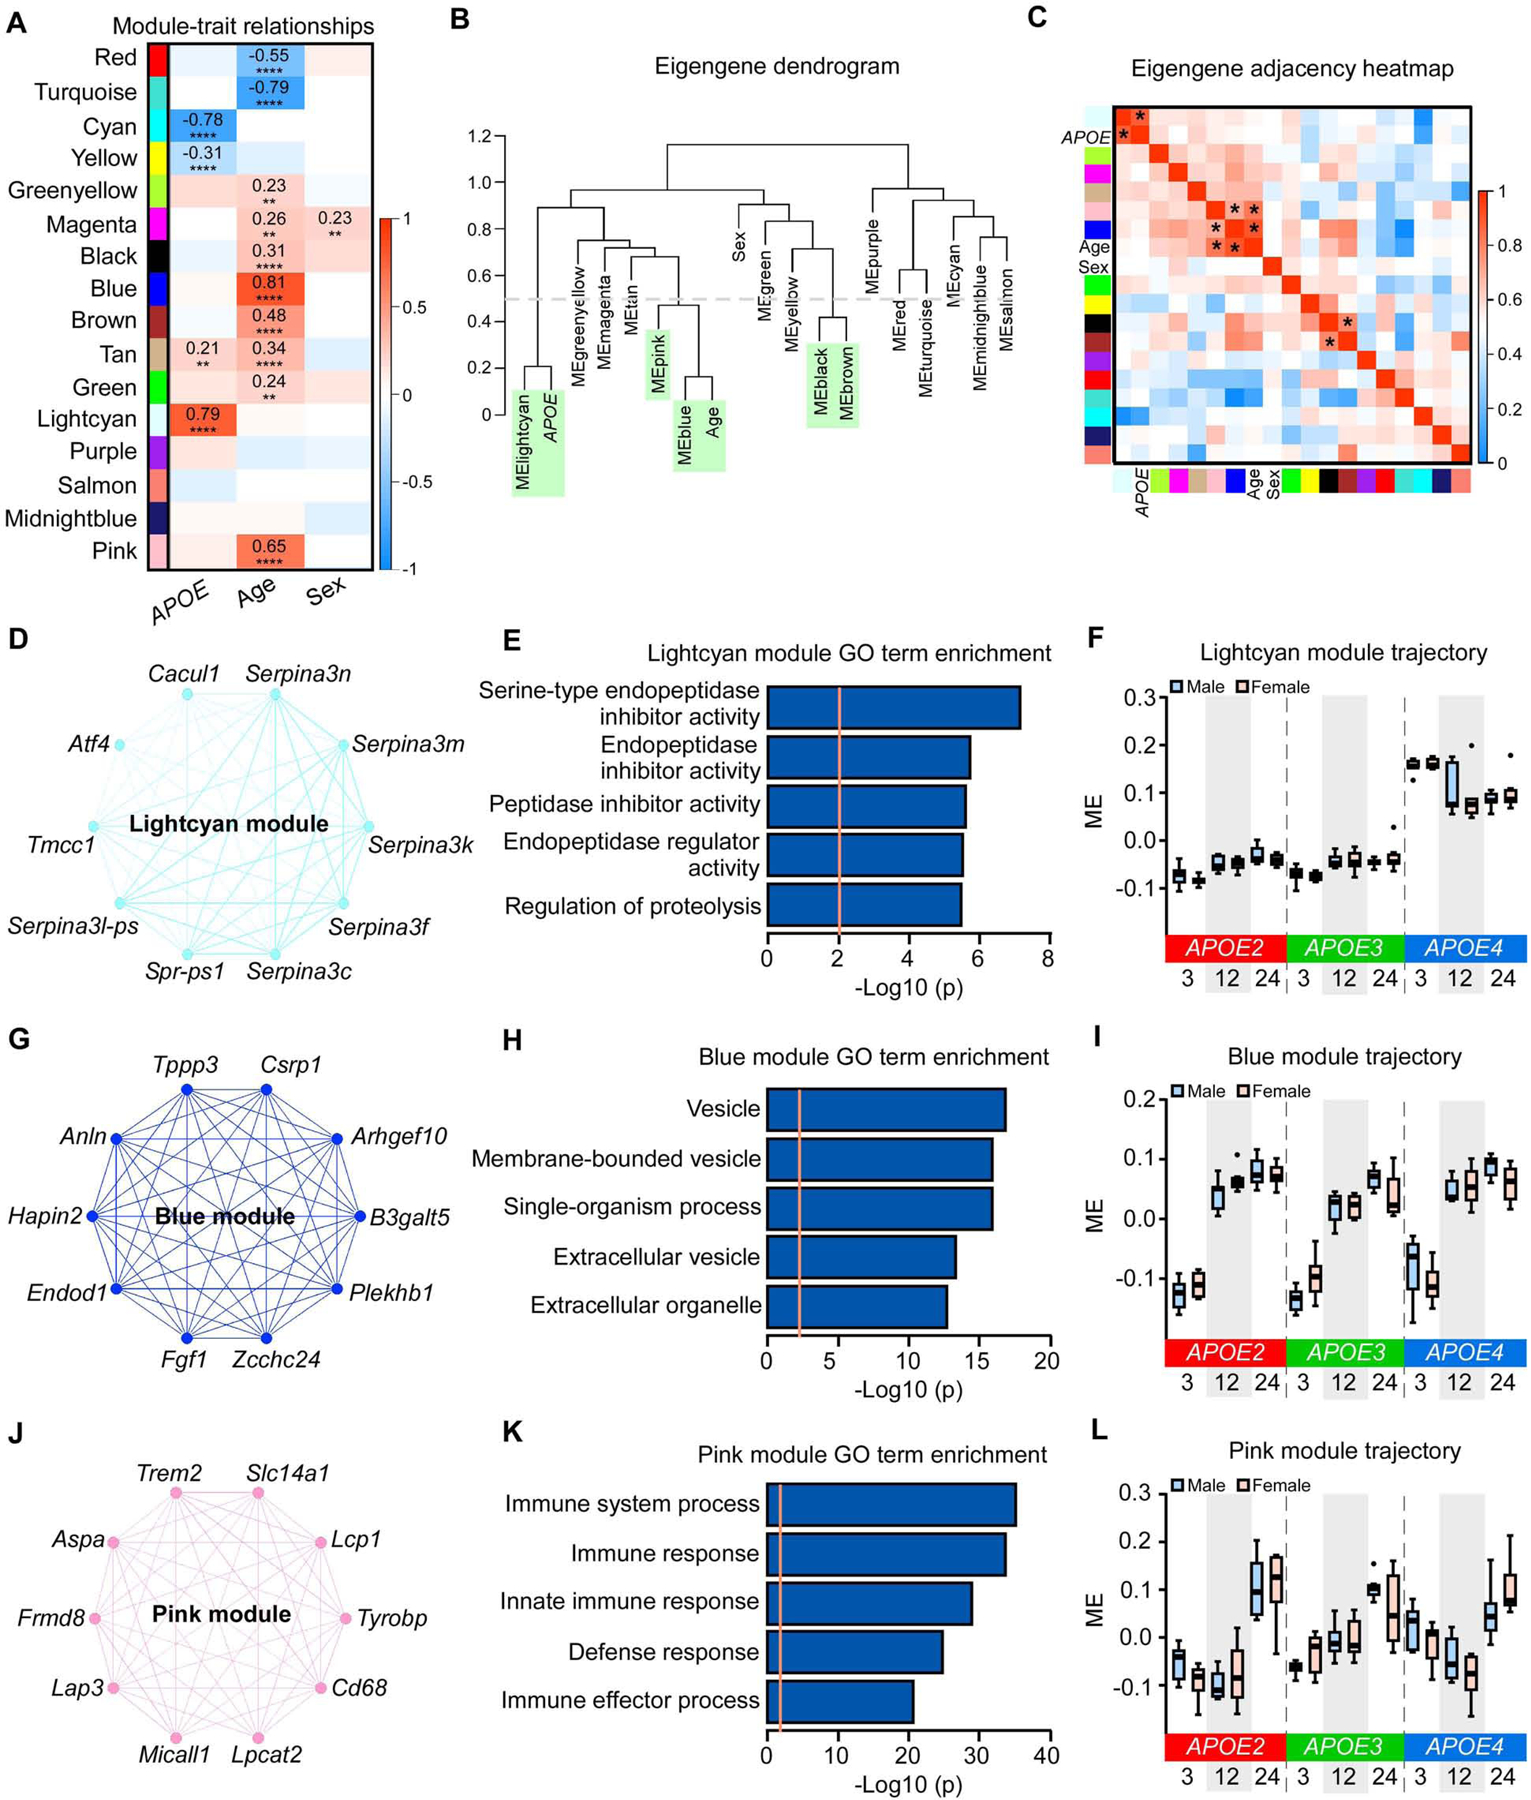
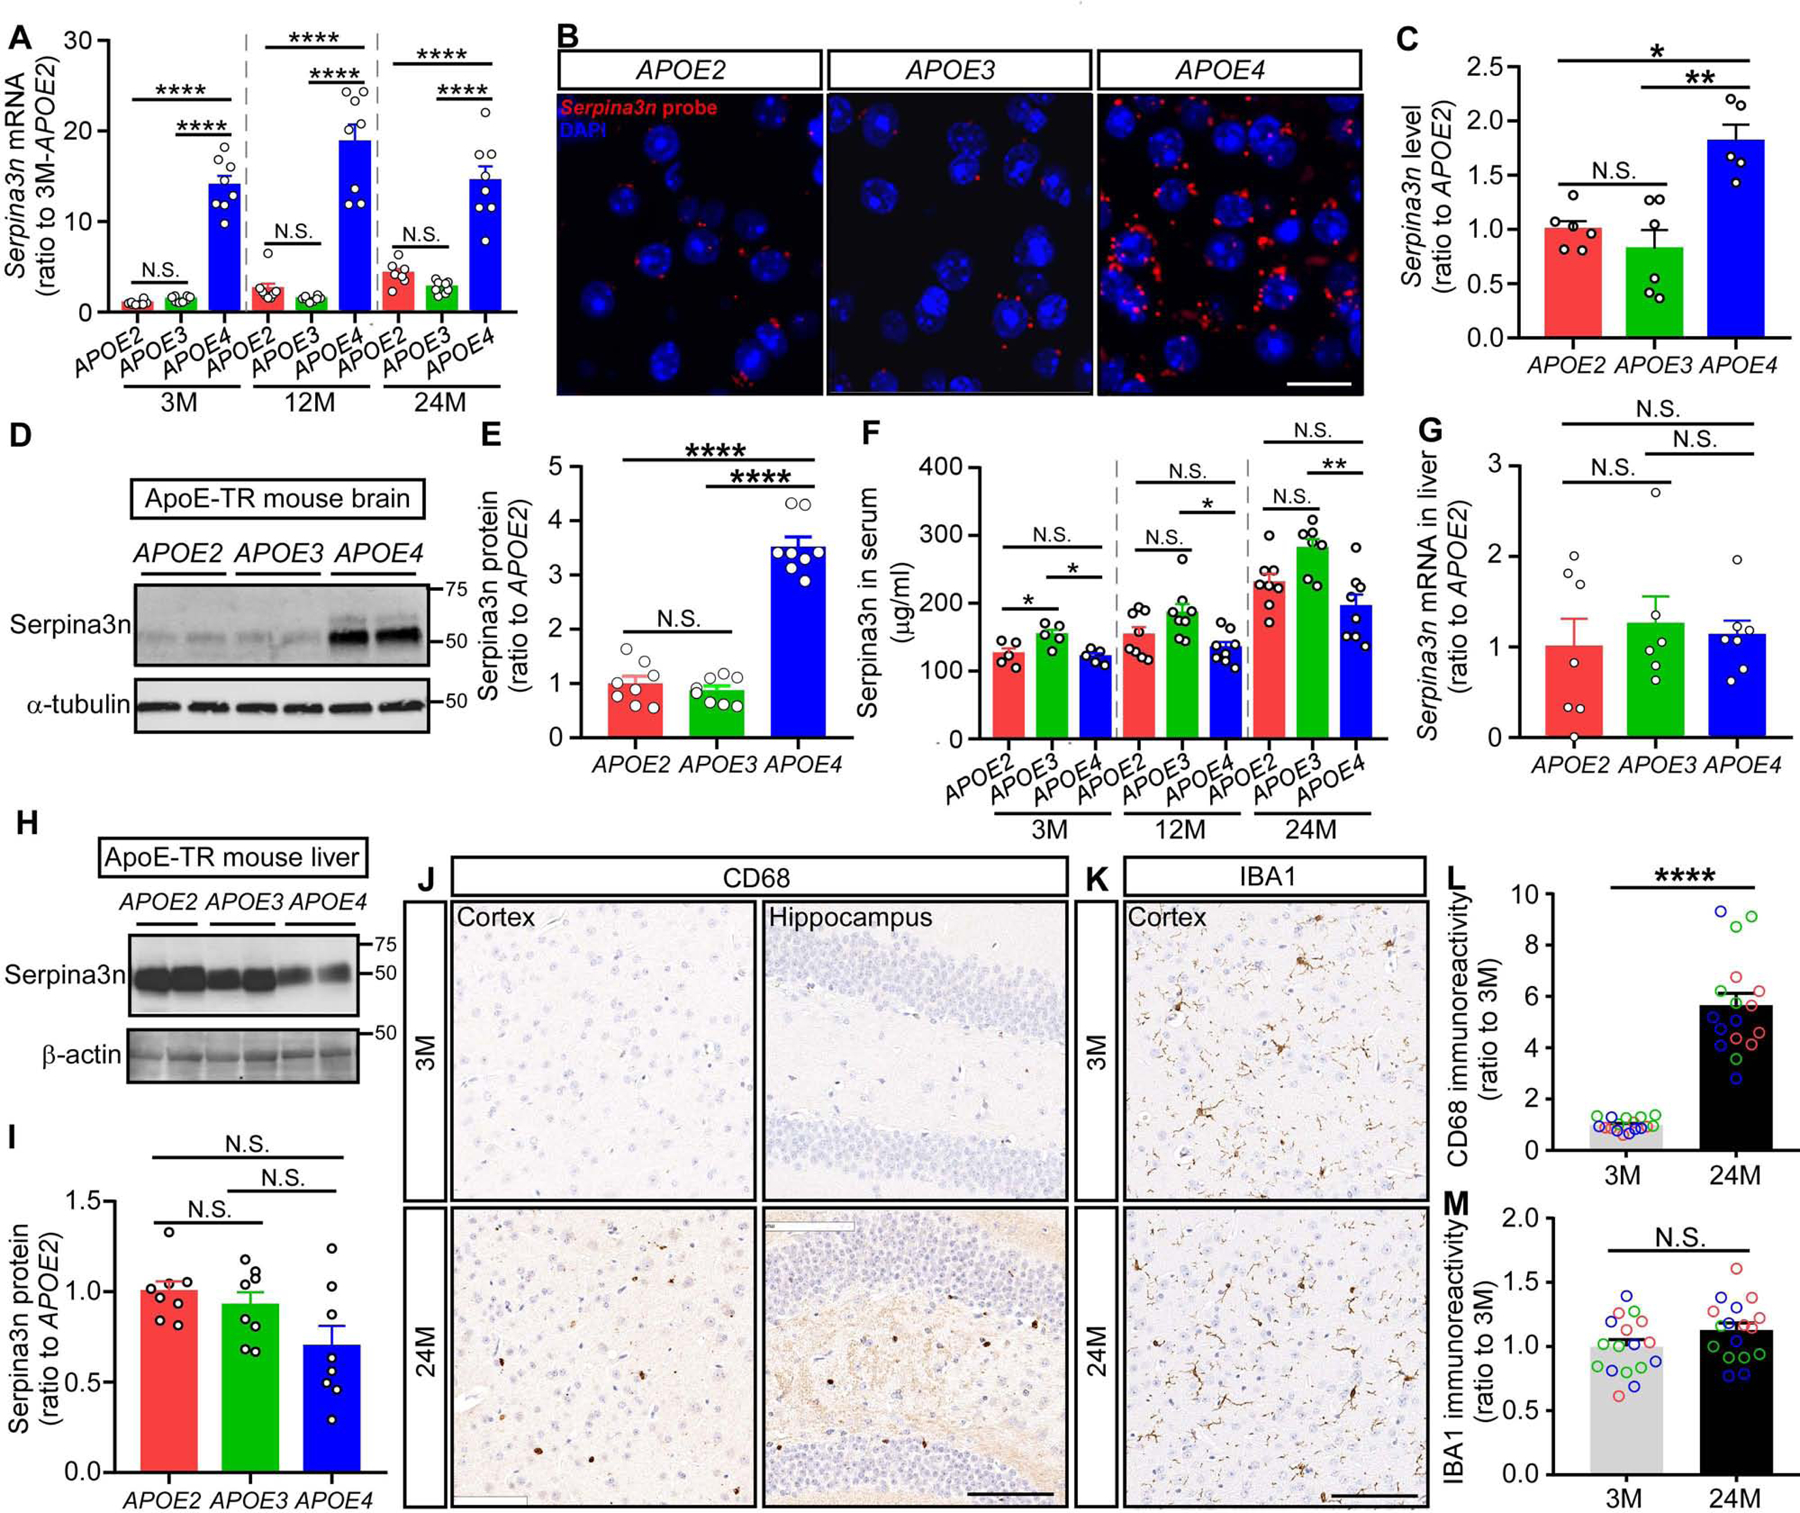
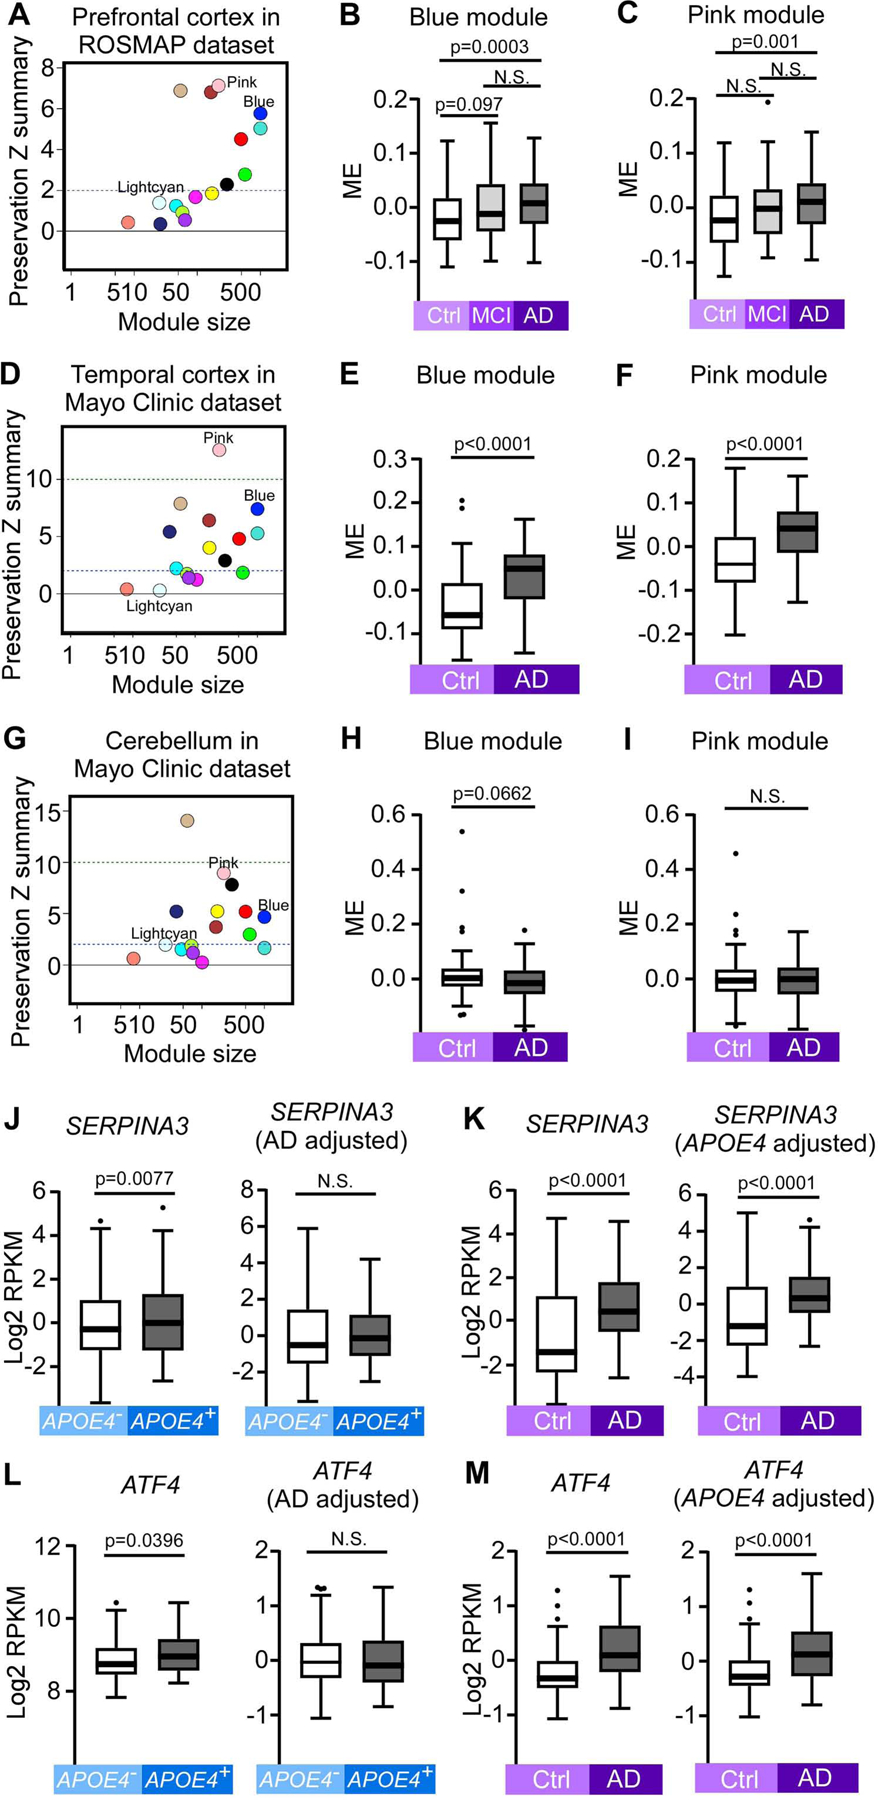
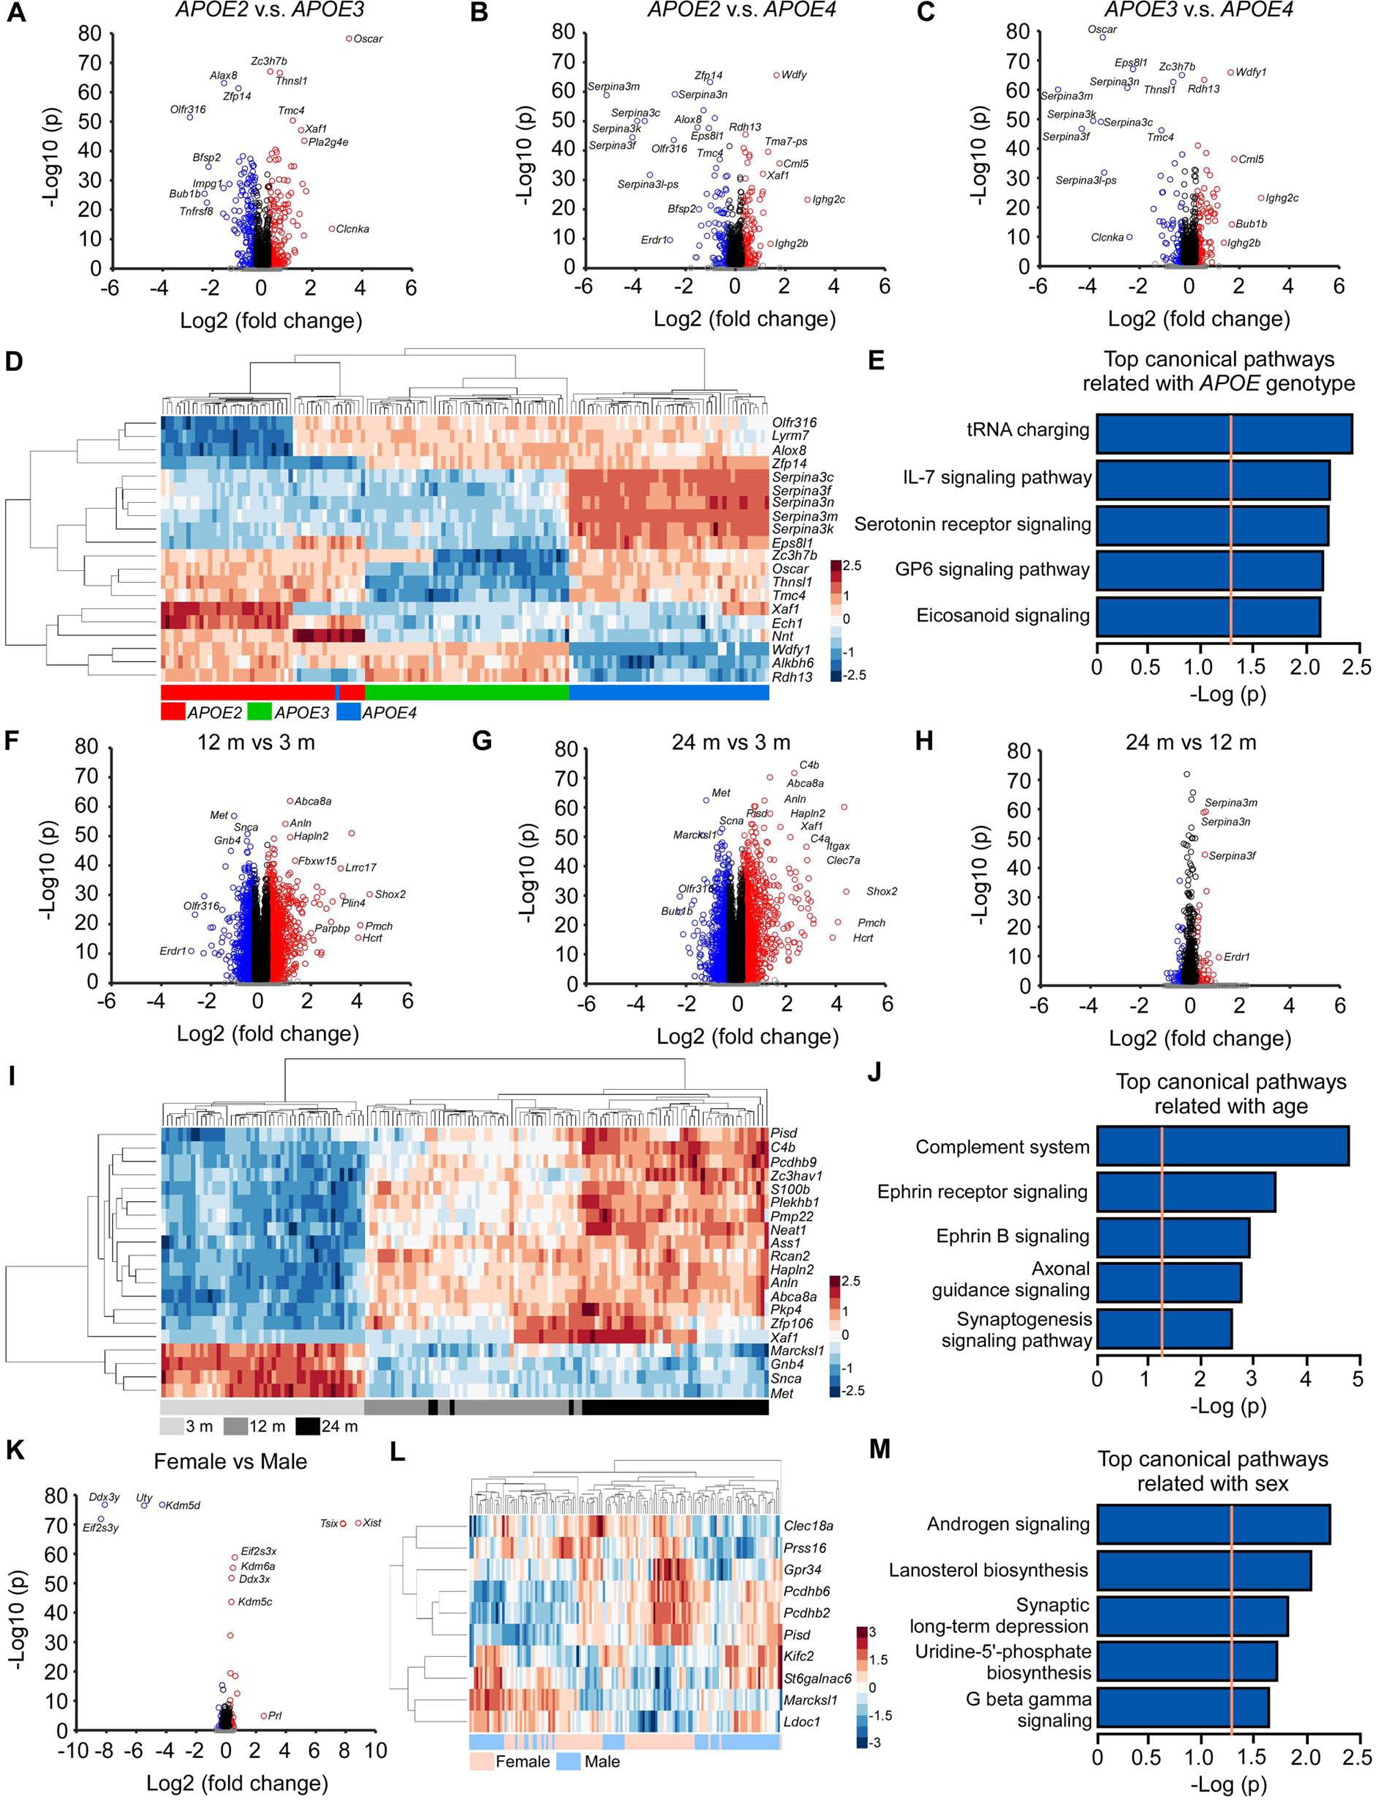
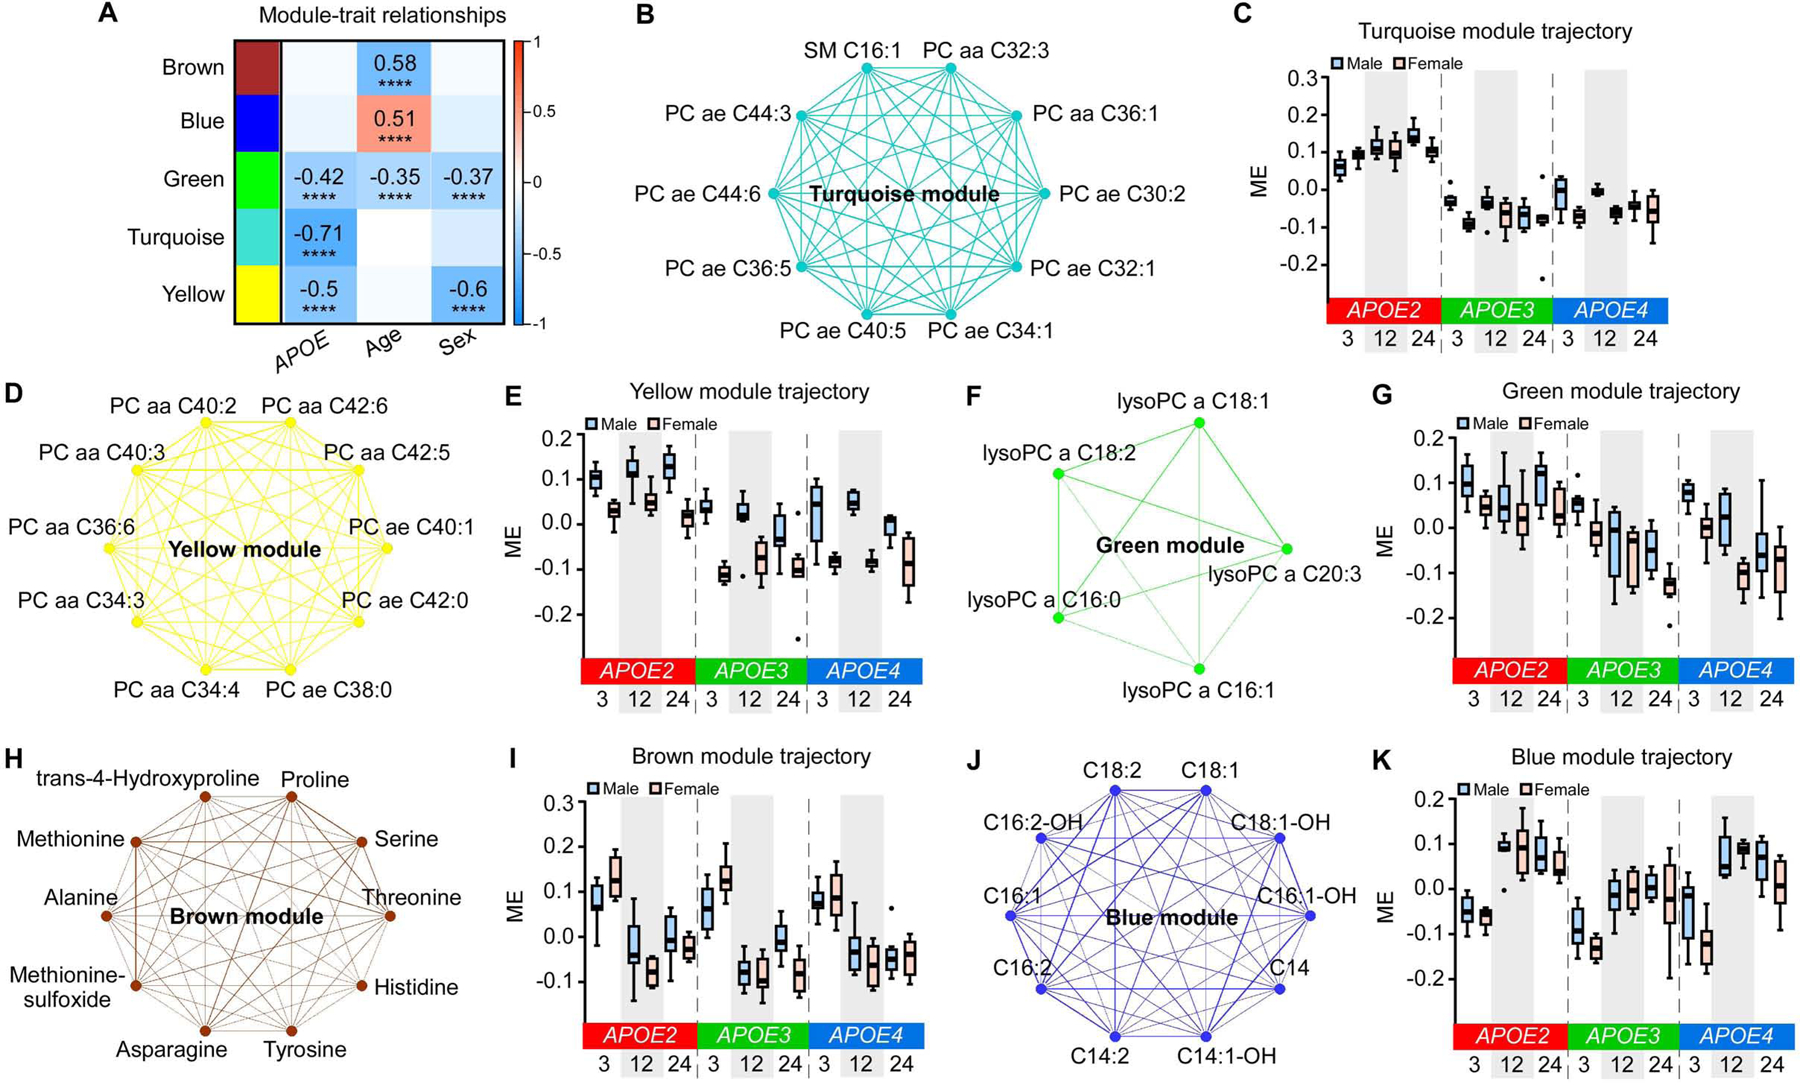
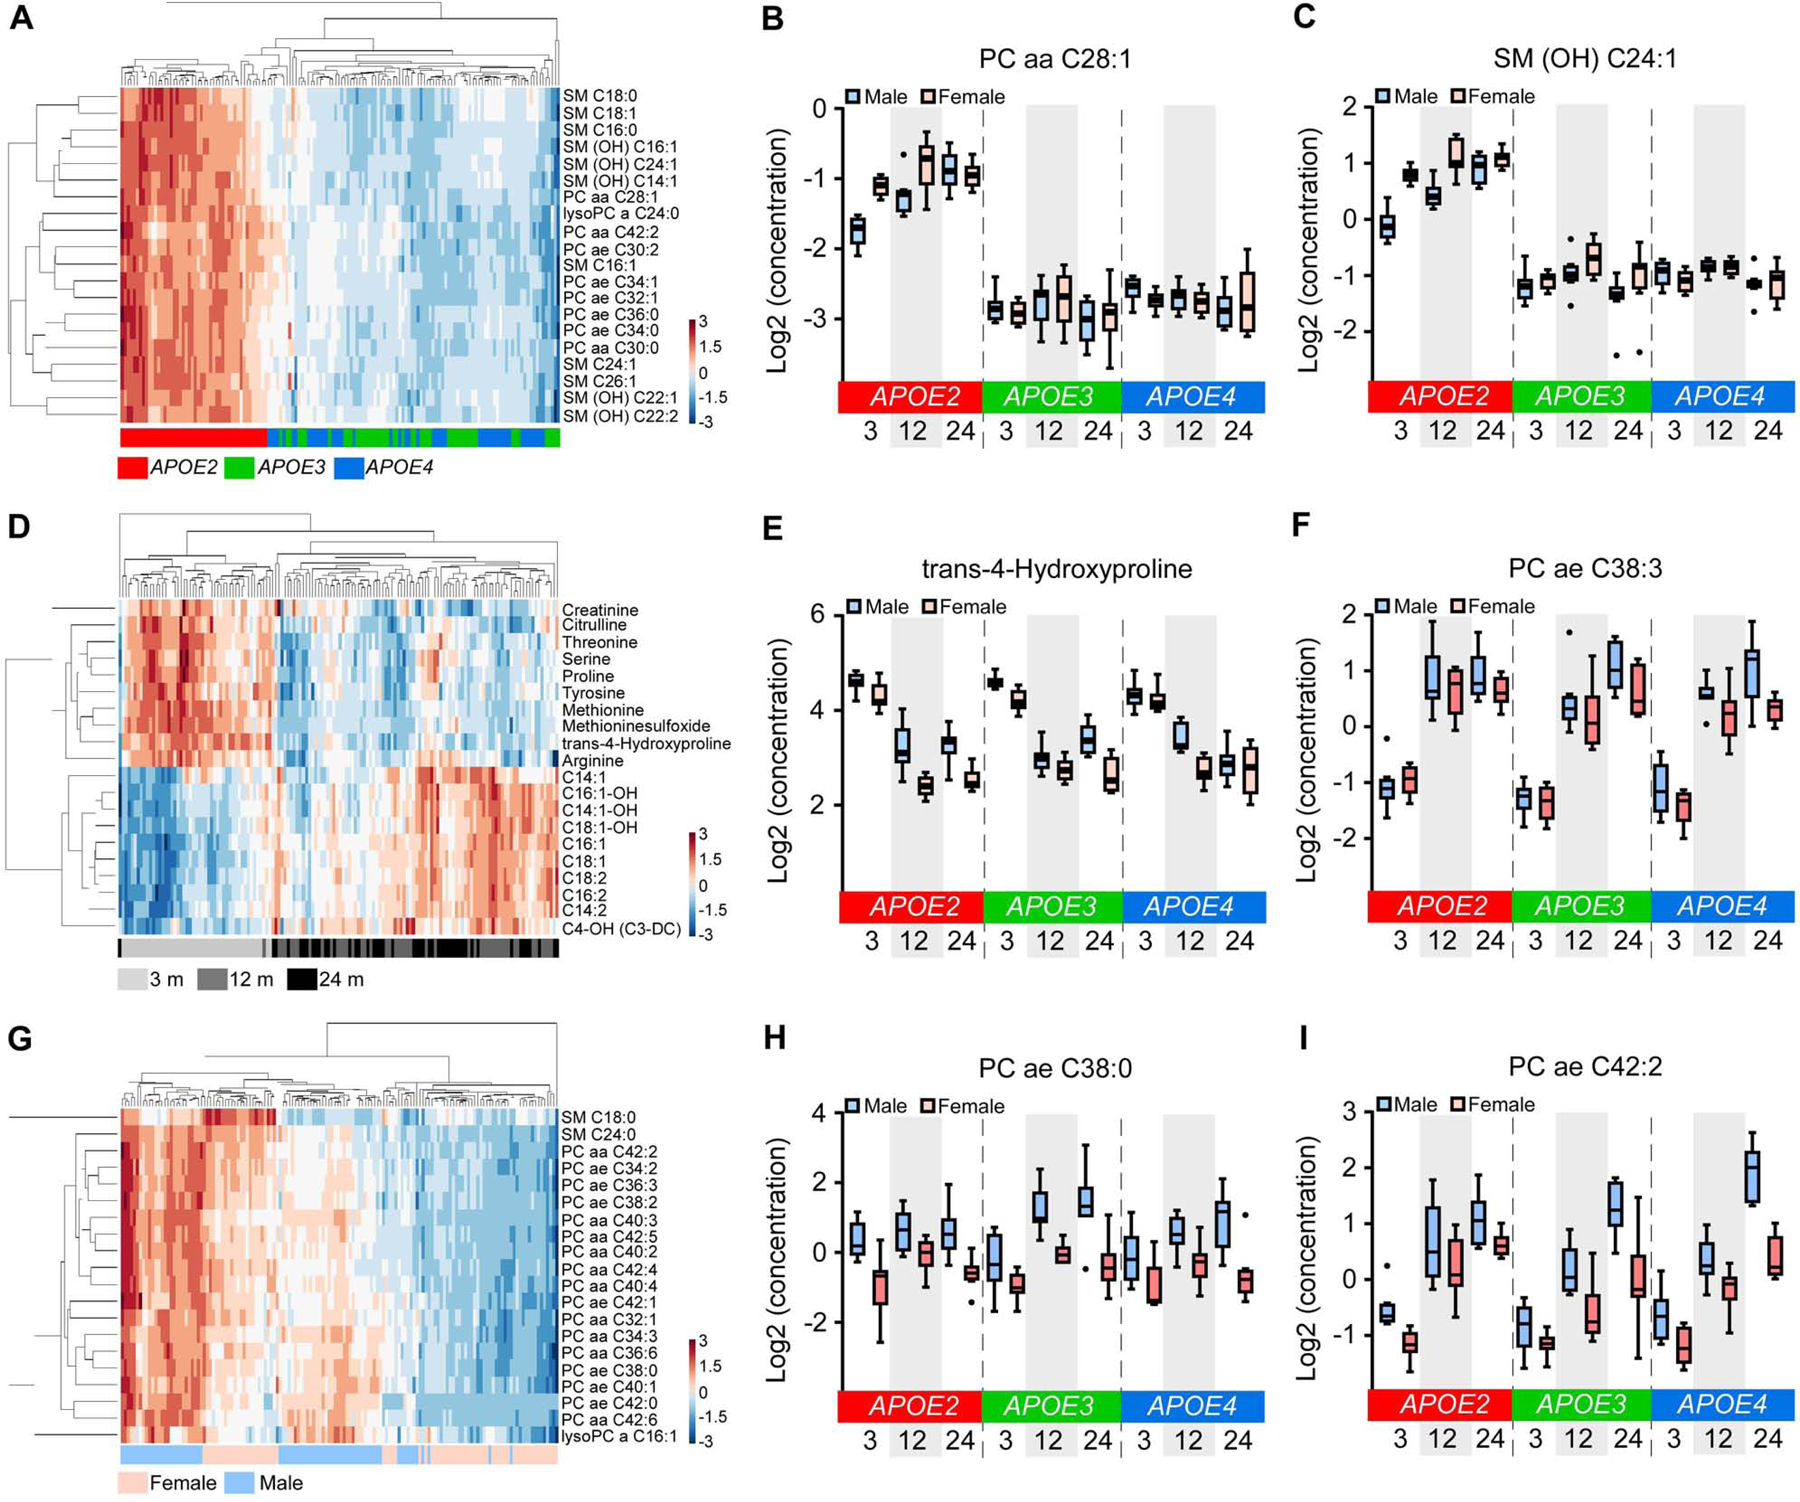
Evidence suggests interplay among the three major risk factors for Alzheimer's disease (AD): age, APOE genotype, and sex. Here, we present comprehensive datasets and analyses of brain transcriptomes and blood metabolomes from human apoE2-, apoE3-, and apoE4-targeted replacement mice across young, middle, and old ages with both sexes. We found that age had the greatest impact on brain transcriptomes highlighted by an immune module led by Trem2 and Tyrobp, whereas APOE4 was associated with upregulation of multiple Serpina3 genes. Importantly, these networks and gene expression changes were mostly conserved in human brains. Finally, we observed a significant interaction between age, APOE genotype, and sex on unfolded protein response pathway. In the periphery, APOE2 drove distinct blood metabolome profile highlighted by the upregulation of lipid metabolites. Our work identifies unique and interactive molecular pathways underlying AD risk factors providing valuable resources for discovery and validation research in model systems and humans.

Keywords: APOE; Alzheimer’s disease; Serpina3; age; extracellular vesicles; inflammation; lipid metabolism; metabolomics; sex; transcriptomics.


Conflict of interest statement

Declaration of Interests M.A. is co-inventor on patent WO2018049268 in this field. The other authors declare no competing interests.

Figures

Figure 1:
Figure 1:. Global characterization of brain transcriptome and serum metabolome profiles of apoE-target replacement (TR) mice.
(A and C) The effects of APOE genotype, age, sex and their interactions on the variation of brain gene expression (A) and serum metabolite expression (C) in the study cohort (n = 7–8 mice/genotype/age/sex). (B and D) Sample-to-sample variation among brain transcriptomes (B) and serum metabolomes (D) revealed by principal component analysis (PCA). Each circle represents a sample, colored by APOE, age and sex, respectively.
Figure 2:
Figure 2:. Impact of APOE genotype, age and sex on gene co-expression networks of the mouse brain transcriptomes.
(A) The correlation between module eigengenes (MEs) and APOE genotype, age, and sex. The values in the heatmap are Pearson’s correlation coefficients. Stars represent significant correlations: **p < 0.01; ****p < 0.0001. Modules with positive values (orange) indicate positive correlation of MEs with APOE4 genotype, older age, or female; modules with negative values (blue) indicate negative correlation of MEs with these traits. (B) The ME network representing the relationships between modules and between modules and APOE genotype, age and sex. The y axis shows the dissimilarity of eigengenes. Modules and traits with dissimilarity score < 0.5 (grey dotted line, green shadow) are considered to be tightly correlated. (C) Heatmap of the eigengene adjacency matrix. Each row and column corresponds to one eigengene (labeled by module color) or a trait of interest. Within the heatmap, orange indicates positive correlation and blue indicates negative correlation. * indicates the correlation coefficient is above 0.5. (D, G, and J) Network plots of the top 10 genes with the highest intramodular connectivity (hub genes) in the lightcyan (D), blue (G), and pink (J) modules. (E, H, and K) The top 5 Gene Ontology (GO) terms enriched by 35 module genes in lightcyan module (E), 2628 module genes in the blue module (H), and 308 module genes in the pink module (K). The orange dotted line indicates the threshold of p = 0.01. (F, I, and L) MEs in the lightcyan (F), blue (I), and pink (L) modules across different APOE genotypes (APOE2, APOE3, and APOE4), ages (3, 12, and 24 months), and sexes (male and female). The upper and lower lines in the boxplots represent the maximum and minimum values after Tukey’s test. The center line represents the median. N = 7–8 mice/genotype/age/sex.
Figure 3:
Figure 3:. Validation of Serpina3n upregulation by APOE4 and microglia activation by aging in the brain of apoE-TR mice.
(A) The expression of Serpina3n at the mRNA level was detected by qPCR using RNA samples from the cortex of apoE-TR mice at different ages (n = 7–8 mice per APOE genotype per age group, mixed gender). Data are expressed as mean ± SEM relative to APOE2 mice at 3 months of age. One-way ANOVA was used to detect differences among APOE genotypes within each age group. (B and C) Brain sections were prepared from the apoE-TR mice (n = 5–6 mice per APOE genotype, mixed gender). The expression of Serpinas3n was visualized using RNAscope probes while nuclei were visualized with DAPI. Representative images were shown from each APOE genotype, respectively. Scale bar: 20 μm. The intensity of Serpina3n staining was quantified using ImageJ software and compared among APOE genotypes using one-way ANOVA. (D and E) Proteins from the cortex of apoE-TR mice were extracted using RIPA buffer. Serpina3n level was examined by Western blotting (n = 8 mice per group, mixed gender). Results were normalized to α-tubulin expression. Data are expressed as mean ± SEM relative to APOE2 mice. One-way ANOVA tests were used. (F) Serpina3n in the serum of apoE-TR mice was examined by ELISA (n = 5 mice per APOE genotype at 3 months of age, n = 7–8 mice per APOE genotype at 12 and 24 months of age, mixed gender). One-way ANOVA tests were used to detect difference among APOE genotypes within each age group. (G-I) The expression of Serpina3n at the mRNA and protein levels was evaluated in the liver of apoE-TR mice at 24 months of age by qPCR (G) or Western blotting (H and I) (n = 5–6 mice per group, mixed gender, RIPA fraction was used for the Western blotting experiment). The immunoblotting results were normalized to β-actin expression. Data are expressed as mean ± SEM relative to APOE2 mice. One-way ANOVA tests were used. (J-M) Brain sections were prepared from the apoE-TR mice at 3 and 24 months of age. Representative images are shown for the CD68 (J) and IBA1 (K) immunohistochemical staining at different brain regions. Scale bar, 100 μm. The immunoreactivity of CD68 (L) and IBA1 (M) staining in the region of cortex was evaluated by Aperio ImageScope (n = 17–18 mice per age group, mixed APOE genotype and gender). Red, green, and blue circles represent APOE2, APOE3 and APOE4 genotype, respectively. Data represent mean ± SEM relative to 3-month-old mice. Mann-Whitney tests were used. *p < 0.05; **p < 0.01; ****p < 0.0001; N.S., not significant.
Figure 4:
Figure 4:. Module preservation analyses between mouse and human samples.
(A, D and G) Module preservation in the ROSMAP human prefrontal cortex (A, n = 313), Mayo clinic human temporal cortex (D, n = 159), and Mayo clinic human cerebellum (G, n = 158) datasets. Preservation Z summary between 2 and 10 indicates moderate preservation. Z summary >10 indicates strong preservation. (B and C) Blue (B) and pink (C) MEs in human control, MCI and AD samples in the ROSMAP prefrontal cortex dataset (n = 85 Ctrl, n = 78 MCI, and n = 150 AD). (E and F) Blue (E) and pink (F) MEs in human AD and controls samples in the Mayo Clinic temporal cortex dataset (n = 77 Ctrl and n = 82 AD). (H and I) Blue (H) and pink (I) MEs in human AD and controls samples in the Mayo Clinic cerebellum dataset (n = 76 Ctrl and n = 82 AD). (J-M) The gene expression levels (log2 transformed RPKM) of SERPINA3 and ATF4, two lightcyan module genes in the Mayo Clinic human temporal cortex dataset. (J, L) The expression levels of SERPINA3 (J) and ATF4 (L) between APOE4 (n = 108, including 69 Ctrl and 39 AD) and APOE4+ (n = 51, including 8 Ctrl and 43 AD) samples: left panel: expression values not adjusted by AD status; right panel: expression values adjusted by AD status. (K, M) The expression levels of SERPINA3 (K) and ATF4 (M) between AD (n = 82, including 39 APOE4 and 43 APOE4+) and Ctrl (n = 77, including 69 APOE4 and 8 APOE4+) samples: left panel: expression values not adjusted by APOE4 status; right panel: expression values adjusted by APOE4 status. In all box plots, the upper and lower lines in the boxplots represent the maximum and minimum values after Tukey’s test. The center line represents the median. P values were calculated by Mann-Whitney U tests.
Figure 5:
Figure 5:. Differential gene expression and pathway analyses of the mouse brain transcriptomes.
(A-C) Volcano plots of DEGs identified between the APOE2 and APOE3 (A), APOE2 and APOE4 (B), and APOE3 and APOE4 genotypes (C). The blue circles denote downregulated DEGs and the red circles denote upregulated DEGs in each comparison (Bonferroni-corrected p < 0.05 and |fold change| ≥ 1.2). The black circles denote genes with significant p values (Bonferroni-corrected p < 0.05) but |fold change| < 1.2, and the grey dots denote genes that did not meet either the p value or the fold change threshold. (D) Hierarchical clustering of the top 20 DEGs affected by APOE genotypes (Bonferroni-corrected p < 0.05). Each row corresponds to one gene and each column corresponds to one sample. (E) The top 5 pathways enriched by 1,011 DEGs affected by APOE genotypes (Bonferroni-corrected p < 0.0001). The orange dotted line indicates the threshold of p = 0.05. (F-H) Volcano plots of DEGs identified between the 12 and 3 months (F), 24 and 3 months (G), and 24 months and 12 months old mice (H). The color code of the circles is identical to figures A-C. (I) Hierarchical clustering of the top 20 DEGs affected by age (Bonferroni-corrected p < 0.05). (J) The top 5 canonical pathways enriched by the top 1,000 DEGs affected by age. (K) Volcano plot of DEGs identified between female and male mice. The color code of the circles is identical to figures A-C. (L) Hierarchical clustering of the top 10 DEGs affected by sex (the X- and Y-linked genes were excluded). (M) The top 5 pathways enriched by 102 DEGs affected by sex (Bonferroni-corrected p < 0.0001). N = 7–8 mice/genotype/age/sex.
Figure 6:
Figure 6:. Impact of APOE genotype, age and sex on co-expression network of the mouse serum metabolomes.
(A) The correlation between MEs and APOE genotype, age, and sex. The values in the heatmap are Pearson’s correlation coefficients. Stars represent significant correlations: ****p < 0.0001. Modules with positive values (orange) indicate positive correlation of MEs with APOE4 genotype, older age, or female; modules with negative values (blue) indicate negative correlation of MEs with these traits. (B, D, F, H, and J) Network plots of the top 10 hub metabolites in the turquoise (B), yellow (D), green (F, only 5 metabolites in the module), brown (H), and blue (J) modules. (C, E, G, I, and K) MEs in the turquoise (C), yellow (E), green (G), brown (I), and blue (K) modules across different APOE genotypes (APOE2, APOE3, and APOE4), ages (3, 12, and 24 months), and sexes (male and female). The upper and lower lines in the boxplots represent the maximum and minimum values after Tukey’s test. The center line represents the median. N = 7–8 mice/genotype/age/sex.
Figure 7:
Figure 7:. Differentially expressed metabolites (DEMs) in the mouse serum.
(A, D and G) Hierarchical clustering of the top 20 DEMs affected by APOE genotypes (A), age (D), or sex (G) (Bonferroni-corrected p < 0.05). (B, C, E, F, H and I) The expression levels of the top 2 DEMs in the comparison among APOE genotypes (B and C), ages (E and F), or sexes (H and I). The upper and lower lines in the boxplots represent the maximum and minimum values after Tukey’s test. The center line represents the median. N = 7–8 mice/genotype/age/sex.

Similar articles

Cited by

References

    1. Abraham CR, McGraw WT, Slot F, and Yamin R (2000). Alpha 1-antichymotrypsin inhibits A beta degradation in vitro and in vivo. Ann N Y Acad Sci 920, 245–248. - PubMed
    1. Abraham CR, Selkoe DJ, and Potter H (1988). Immunochemical identification of the serine protease inhibitor alpha 1-antichymotrypsin in the brain amyloid deposits of Alzheimer’s disease. Cell 52, 487–501. - PubMed
    1. Abraham CR, Shirahama T, and Potter H (1990). Alpha 1-antichymotrypsin is associated solely with amyloid deposits containing the beta-protein. Amyloid and cell localization of alpha 1-antichymotrypsin. Neurobiol Aging 11, 123–129. - PubMed
    1. Allen M, Carrasquillo MM, Funk C, Heavner BD, Zou F, Younkin CS, Burgess JD, Chai HS, Crook J, Eddy JA, et al. (2016). Human whole genome genotype and transcriptome data for Alzheimer’s and other neurodegenerative diseases. Sci Data 3, 160089. - PMC - PubMed
    1. Allen M, Wang X, Burgess JD, Watzlawik J, Serie DJ, Younkin CS, Nguyen T, Malphrus KG, Lincoln S, Carrasquillo MM, et al. (2018a). Conserved brain myelination networks are altered in Alzheimer’s and other neurodegenerative diseases. Alzheimers Dement 14, 352–366. - PMC - PubMed

Publication types

MeSH terms