

Unveiling the interaction profile of rosmarinic acid and its bioactive substructures with serum albumin
- PMID: 32200650
- PMCID: PMC7144280
- DOI: 10.1080/14756366.2020.1740923
Unveiling the interaction profile of rosmarinic acid and its bioactive substructures with serum albumin
Abstract
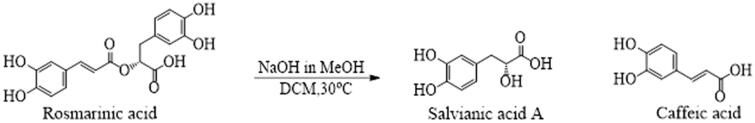
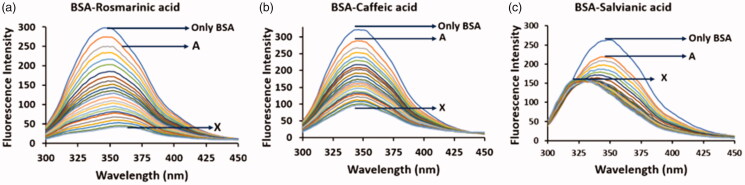
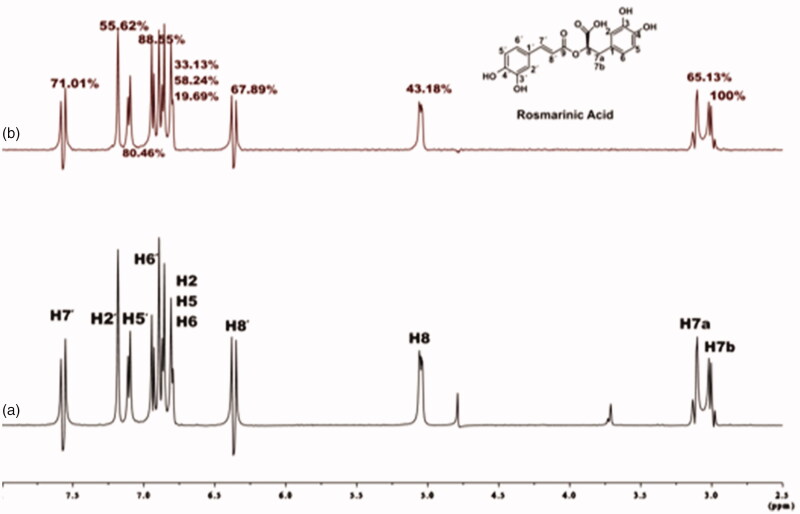
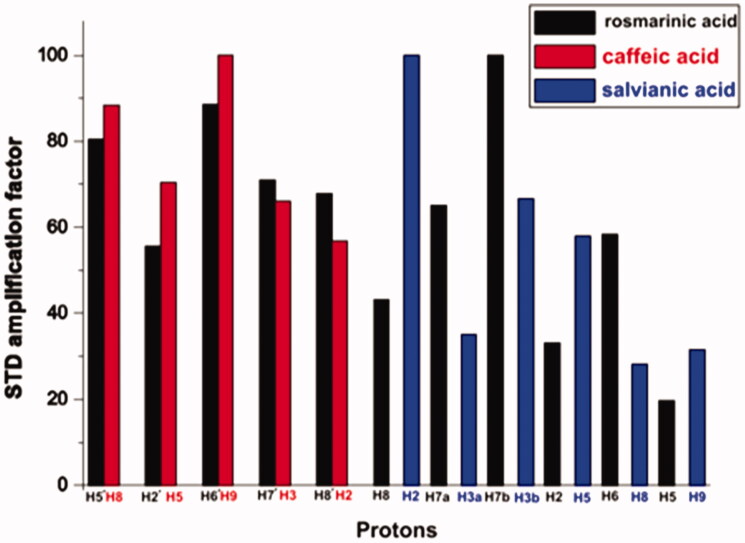
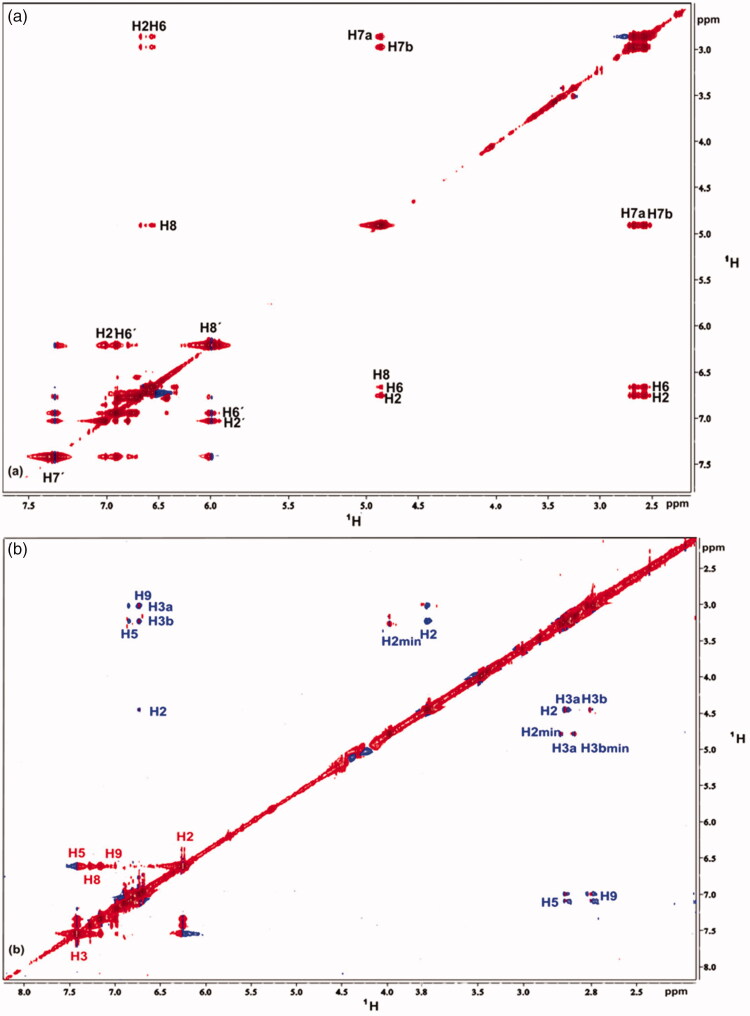
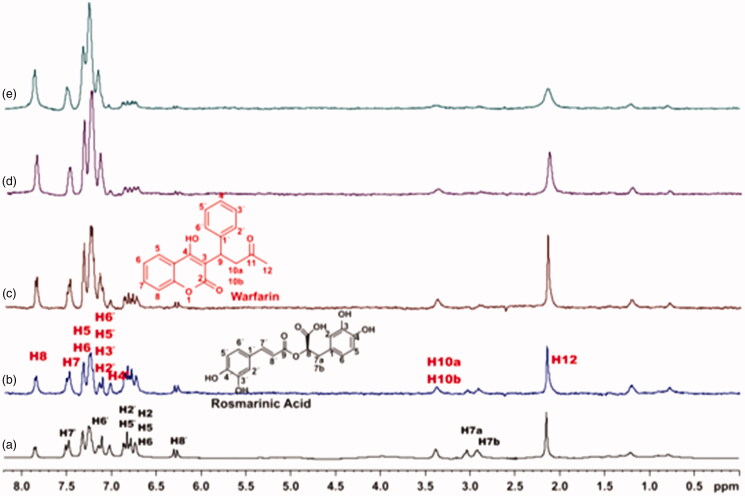
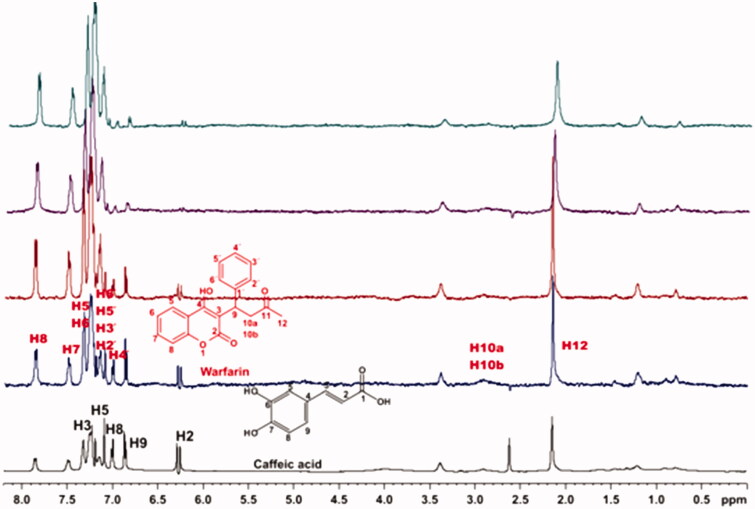
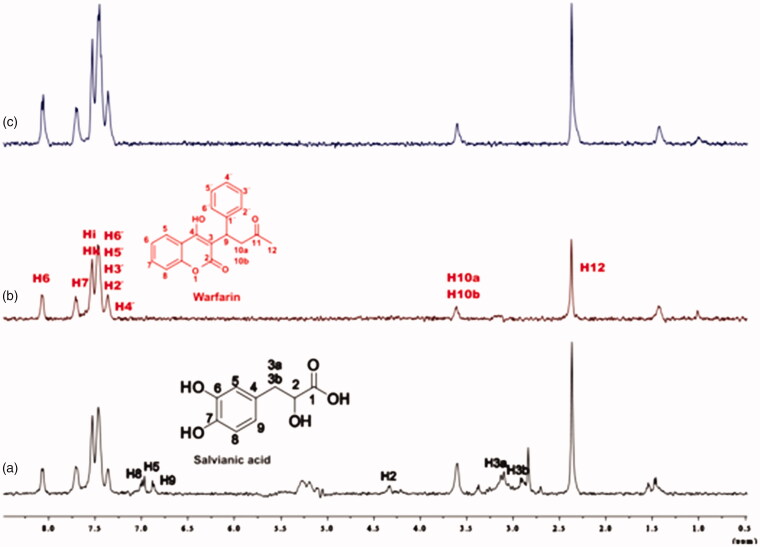
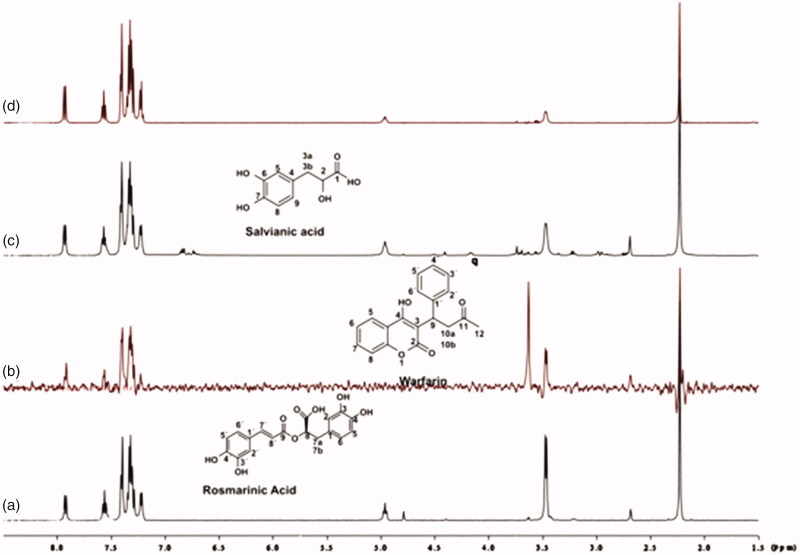
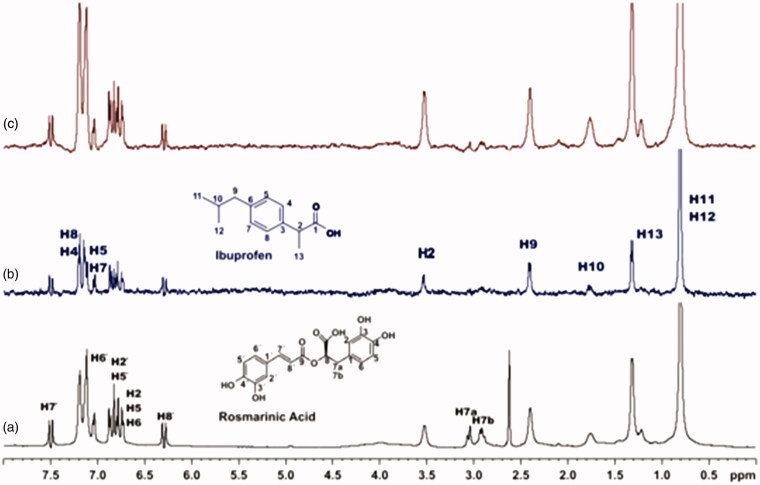
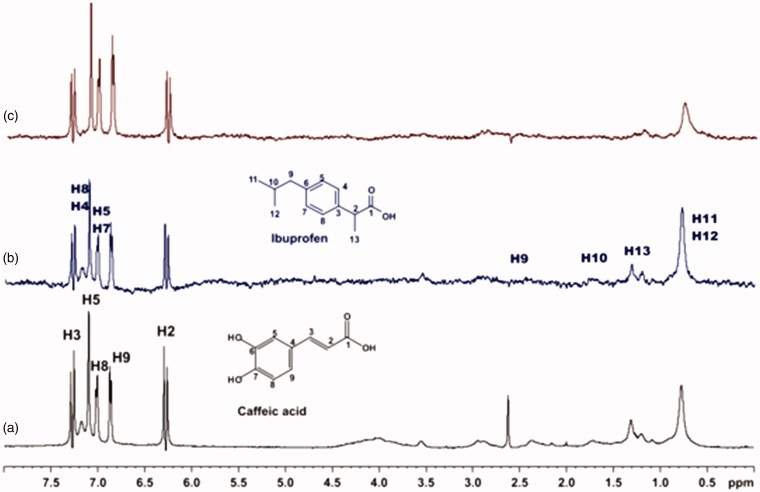
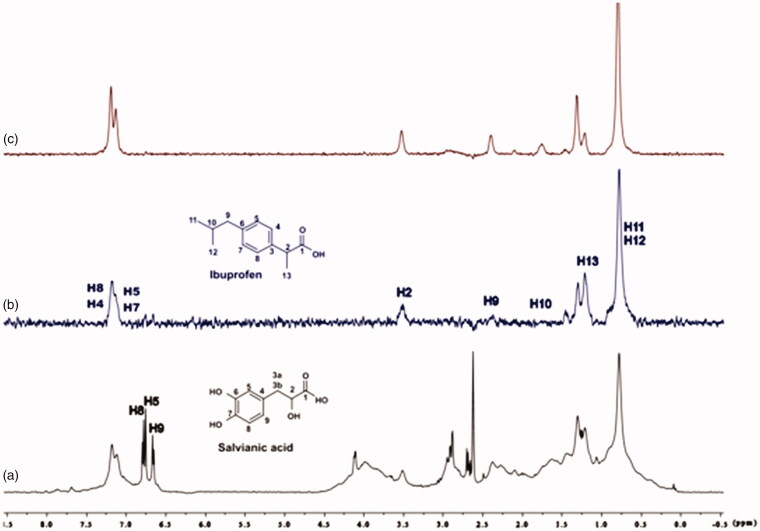
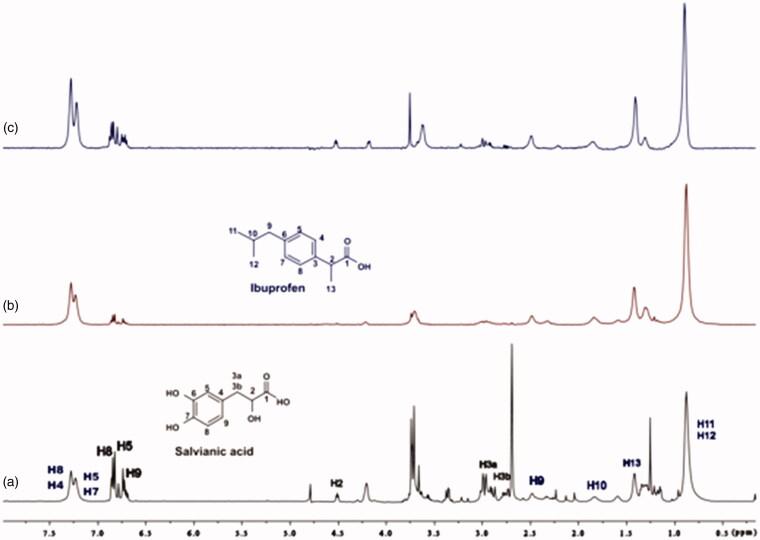
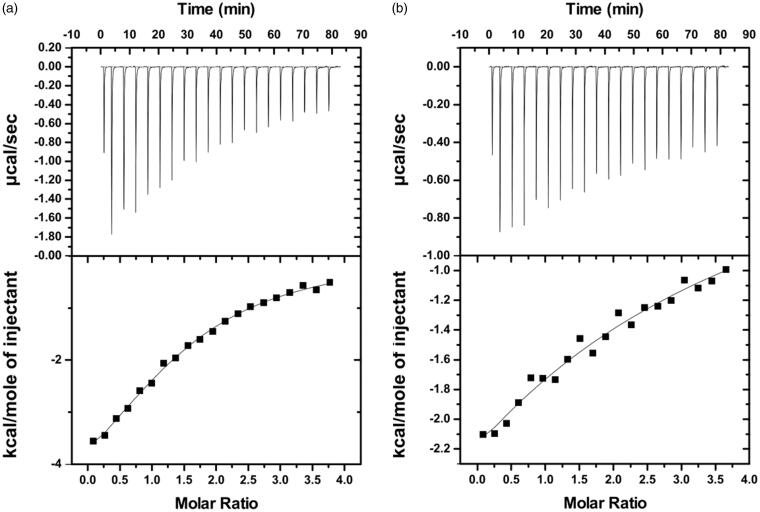
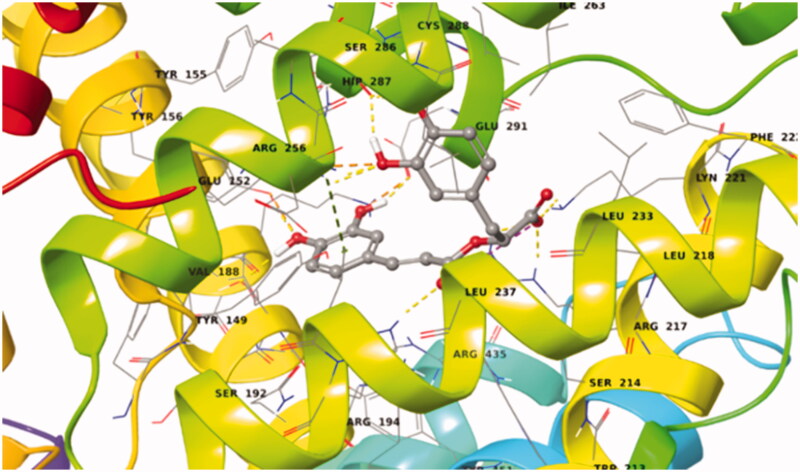
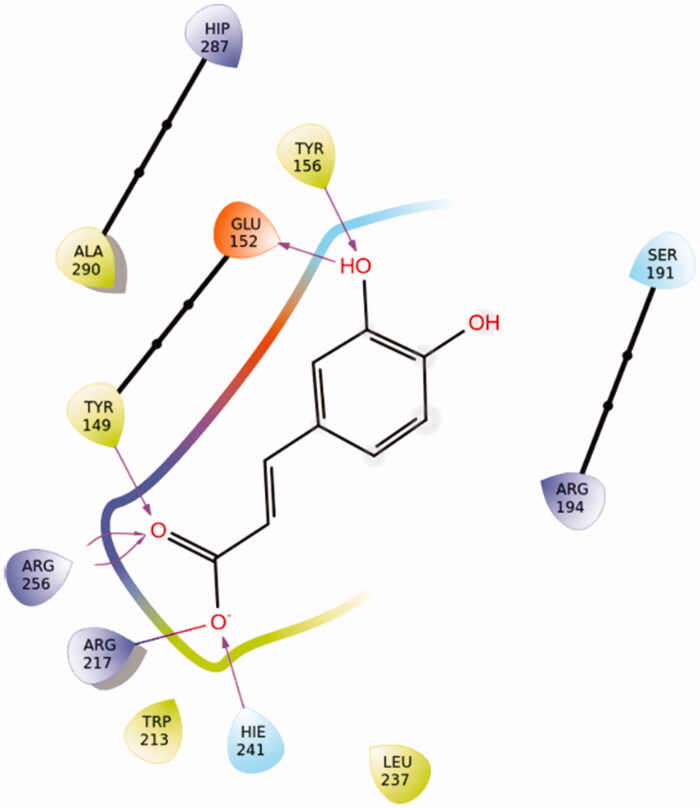
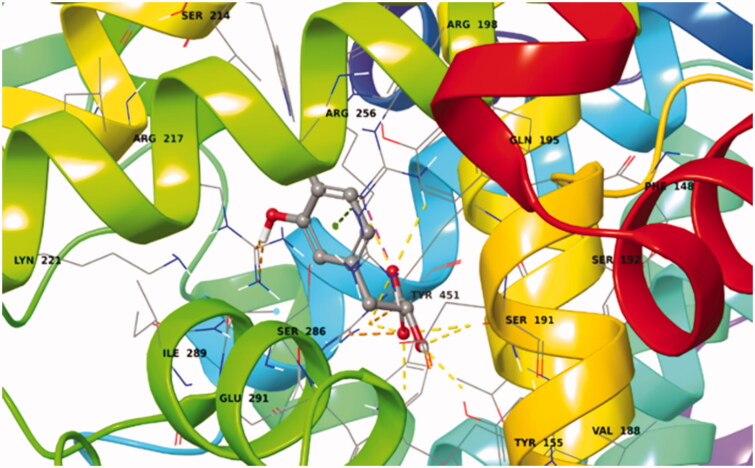
Rosmarinic acid, a phytochemical compound, bears diverse pharmaceutical profile. It is composed by two building blocks: caffeic acid and a salvianic acid unit. The interaction profile, responsible for the delivery of rosmarinic acid and its two substructure components by serum albumin remains unexplored. To unveil this, we established a novel low-cost and efficient method to produce salvianic acid from the parent compound. To probe the interaction profile of rosmarinic acid and its two substructure constituents with the different serum albumin binding sites we utilised fluorescence spectroscopy and competitive saturation transfer difference NMR experiments. These studies were complemented with transfer NOESY NMR experiments. The thermodynamics of the binding profile of rosmarinic acid and its substructures were addressed using isothermal titration calorimetry. In silico docking studies, driven by the experimental data, have been used to deliver further atomic details on the binding mode of rosmarinic acid and its structural components.
Keywords: Rosmarinic acid; STD-NMR; caffeic acid; salvianic acid; serum albumin.
Conflict of interest statement
The authors declare no conflict of interest.
Figures

Similar articles
-
Elucidating the influence of gold nanoparticles on the binding of salvianolic acid B and rosmarinic acid to bovine serum albumin.PLoS One. 2015 Apr 10;10(4):e0118274. doi: 10.1371/journal.pone.0118274. eCollection 2015. PLoS One. 2015. PMID: 25861047 Free PMC article.
-
Deciphering the binding patterns and conformation changes upon the bovine serum albumin-rosmarinic acid complex.Food Funct. 2015 Aug;6(8):2712-26. doi: 10.1039/c5fo00597c. Epub 2015 Jul 6. Food Funct. 2015. PMID: 26146359
-
Molecular recognition of rosmarinic acid from Salvia sclareoides extracts by acetylcholinesterase: a new binding site detected by NMR spectroscopy.Chemistry. 2013 May 17;19(21):6641-9. doi: 10.1002/chem.201203966. Epub 2013 Mar 27. Chemistry. 2013. PMID: 23536497
-
The cellular protective effects of rosmarinic acid: from bench to bedside.Curr Neurovasc Res. 2015;12(1):98-105. doi: 10.2174/1567202612666150109113638. Curr Neurovasc Res. 2015. PMID: 25578431 Review.
-
Rosmarinic acid.Phytochemistry. 2003 Jan;62(2):121-5. doi: 10.1016/s0031-9422(02)00513-7. Phytochemistry. 2003. PMID: 12482446 Review.
Cited by
-
Molecular mechanism of Fe3+ binding inhibition to Vibrio metschnikovii ferric ion-binding protein, FbpA, by rosmarinic acid and its hydrolysate, danshensu.Protein Sci. 2024 Feb;33(2):e4881. doi: 10.1002/pro.4881. Protein Sci. 2024. PMID: 38143427 Free PMC article.
-
Probing the biological efficacy and mechanistic pathways of natural compounds in breast cancer therapy via the Hedgehog signaling pathway.J Pharm Anal. 2025 Apr;15(4):101143. doi: 10.1016/j.jpha.2024.101143. Epub 2024 Nov 13. J Pharm Anal. 2025. PMID: 40291019 Free PMC article. Review.
-
Sensitive Detection of Rosmarinic Acid Using Peptide-Modified Graphene Oxide Screen-Printed Carbon Electrode.Nanomaterials (Basel). 2022 Sep 22;12(19):3292. doi: 10.3390/nano12193292. Nanomaterials (Basel). 2022. PMID: 36234420 Free PMC article.
-
Analyzing Amylin Aggregation Inhibition Through Quantum Dot Fluorescence Imaging.Int J Mol Sci. 2024 Oct 17;25(20):11132. doi: 10.3390/ijms252011132. Int J Mol Sci. 2024. PMID: 39456914 Free PMC article.
-
Synthesis of Anti-Inflammatory Drugs' Chalcone Derivatives and a Study of Their Conformational Properties Through a Combination of Nuclear Magnetic Resonance Spectroscopy and Molecular Modeling.Pharmaceuticals (Basel). 2025 Jan 13;18(1):88. doi: 10.3390/ph18010088. Pharmaceuticals (Basel). 2025. PMID: 39861151 Free PMC article.
References
-
- Rothman JE, Orci L.. Molecular dissection of the secretory pathway. Nature 1992;355:409–15. - PubMed
-
- Bujacz A. Structures of bovine, equine and leporine serum albumin. Acta Crystallogr D Biol Crystallogr 2012;68:1278–89. - PubMed
-
- Fielding L, Rutherford S, Fletcher D.. Determination of protein-ligand binding affinity by NMR: observations from serum albumin model systems. Magn Reson Chem 2005;43:463–70. - PubMed
-
- Ashbrook JD, Spector AA, Santos EC, Fletcher JE.. Long chain fatty acid binding to human plasma albumin. J Biol Chem 1975;250:2333–8. - PubMed
-
- Ashbrook JD, Spectro AA, Fletcher JE.. Medium chain fatty acid binding to human plasma albumin. J Biol Chem 1972;247:7038–42. - PubMed
MeSH terms
Substances
LinkOut - more resources
Full Text Sources
Other Literature Sources
Research Materials