. 2020 Mar 23;18(1):71.
doi: 10.1186/s12916-020-01515-y.

Identifying potential causal effects of age at menarche: a Mendelian randomization phenome-wide association study

Affiliations

Identifying potential causal effects of age at menarche: a Mendelian randomization phenome-wide association study

Maria C Magnus et al. BMC Med. .

Abstract

Background: Age at menarche has been associated with various health outcomes. We aimed to identify potential causal effects of age at menarche on health-related traits in a hypothesis-free manner.

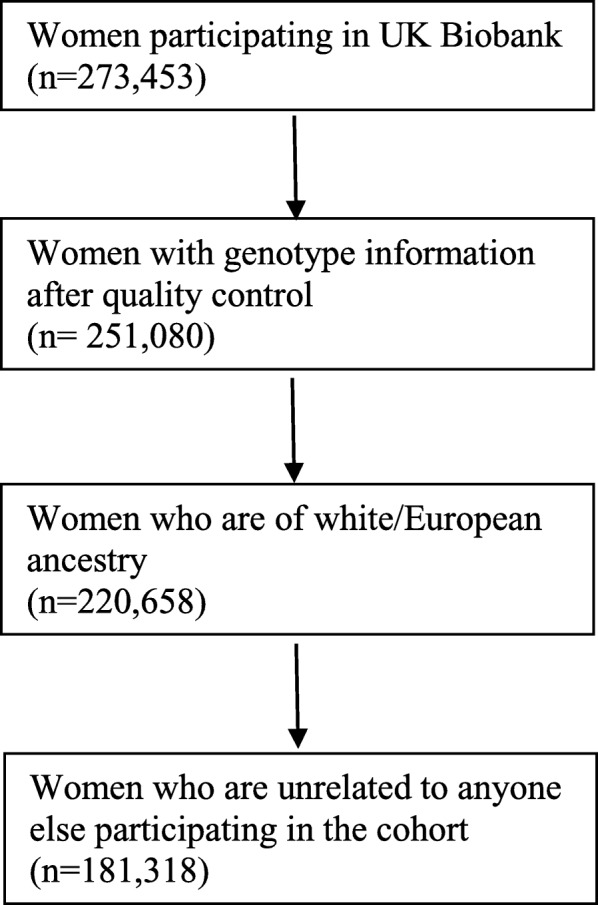
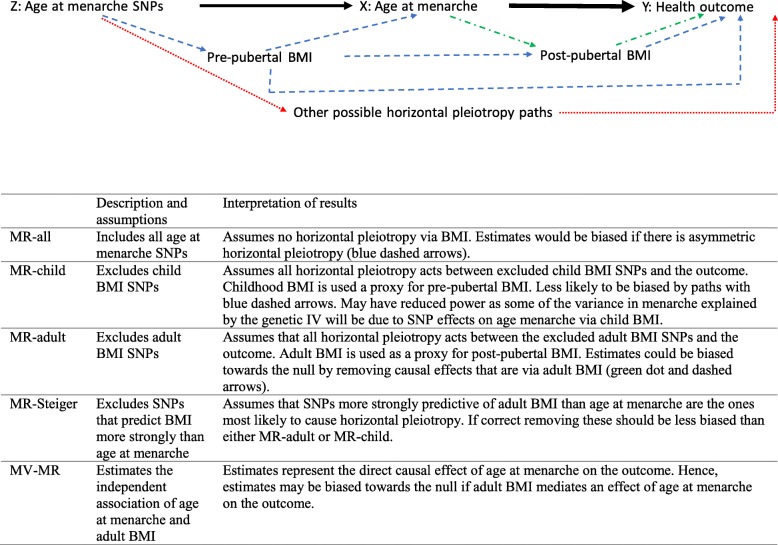
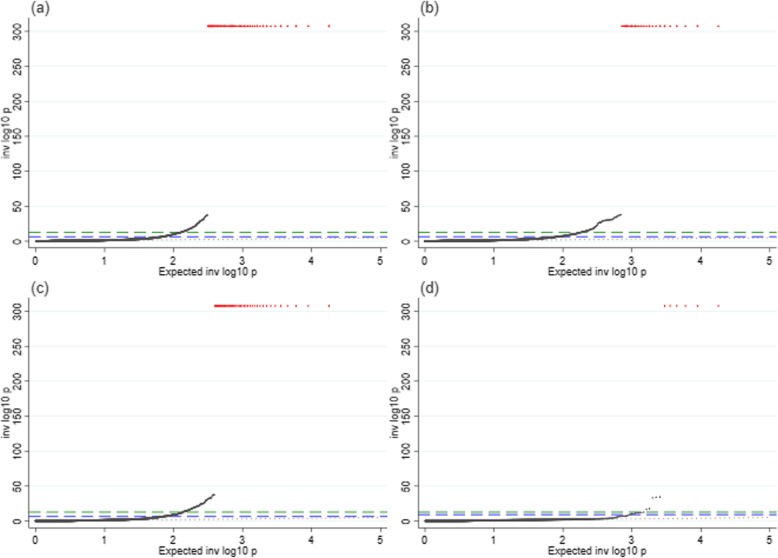
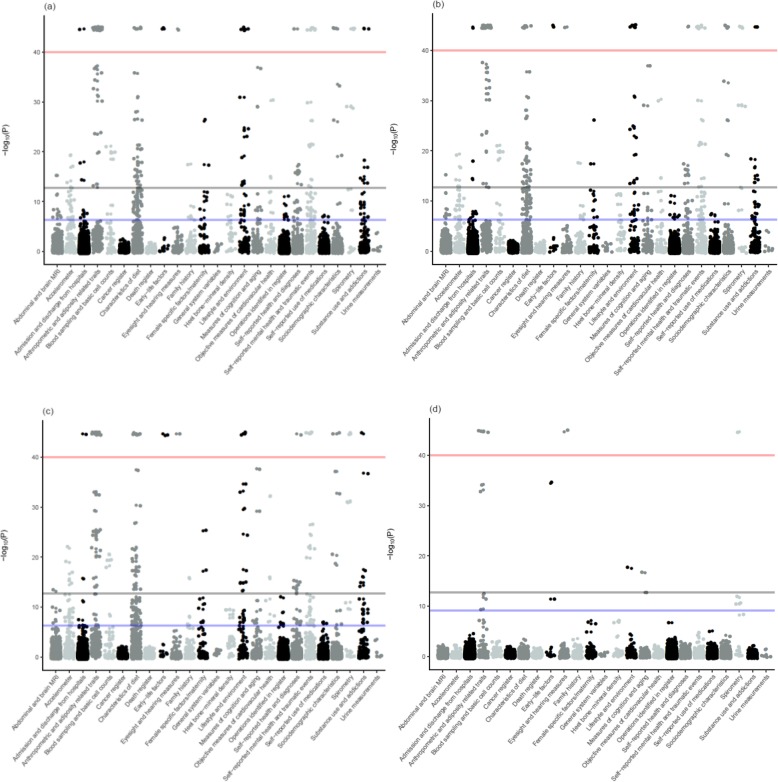
Methods: We conducted a Mendelian randomization phenome-wide association study (MR-pheWAS) of age at menarche with 17,893 health-related traits in UK Biobank (n = 181,318) using PHESANT. The exposure of interest was the genetic risk score for age at menarche. We conducted a second MR-pheWAS after excluding SNPs associated with BMI from the genetic risk score, to examine whether results might be due to the genetic overlap between age at menarche and BMI. We followed up a subset of health-related traits to investigate MR assumptions and seek replication in independent study populations.

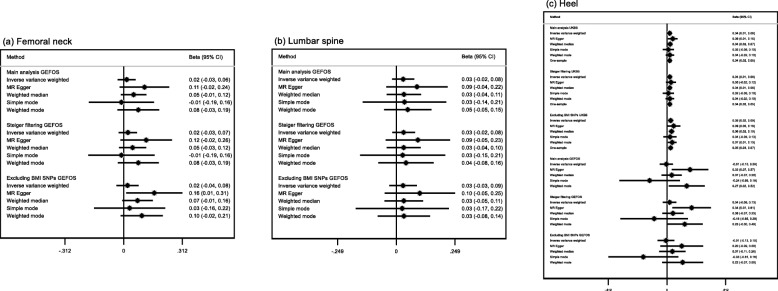
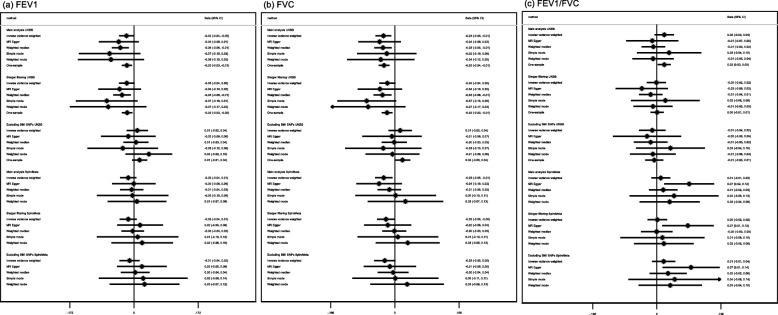
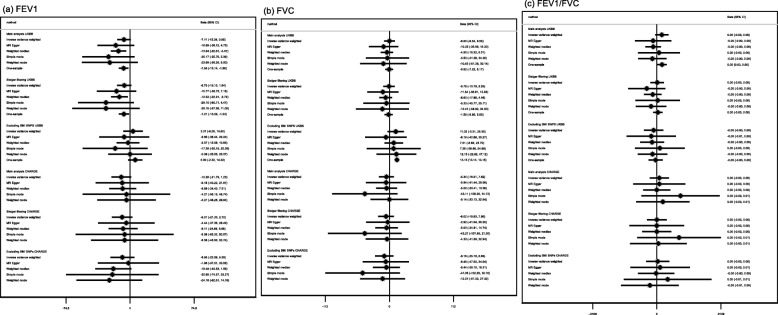
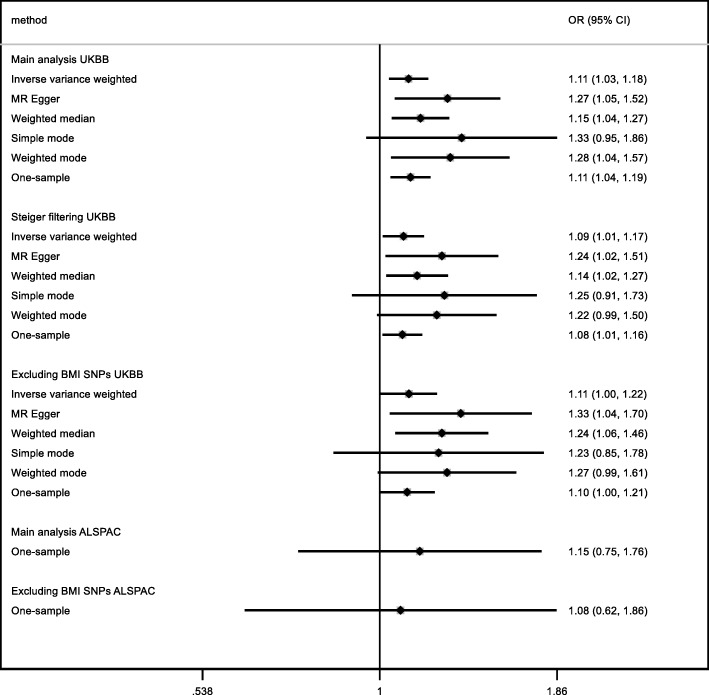
Results: Of the 17,893 tests performed in our MR-pheWAS, we identified 619 associations with the genetic risk score for age at menarche at a 5% false discovery rate threshold, of which 295 were below a Bonferroni-corrected P value threshold. These included potential effects of younger age at menarche on lower lung function, higher heel bone-mineral density, greater burden of psychosocial/mental health problems, younger age at first birth, higher risk of childhood sexual abuse, poorer cardiometabolic health, and lower physical activity. After exclusion of variants associated with BMI, the genetic risk score for age at menarche was related to 37 traits at a 5% false discovery rate, of which 29 were below a Bonferroni-corrected P value threshold. We attempted to replicate findings for bone-mineral density, lung function, neuroticism, and childhood sexual abuse using 5 independent cohorts/consortia. While estimates for lung function, higher bone-mineral density, neuroticism, and childhood sexual abuse in replication cohorts were consistent with UK Biobank estimates, confidence intervals were wide and often included the null.

Conclusions: The genetic risk score for age at menarche was related to a broad range of health-related traits. Follow-up analyses indicated imprecise evidence of an effect of younger age at menarche on greater bone-mineral density, lower lung function, higher neuroticism score, and greater risk of childhood sexual abuse in the smaller replication samples available; hence, these findings need further exploration when larger independent samples become available.

Keywords: MR-pheWAS; Menarche; Mendelian randomization.


Conflict of interest statement

DAL receives (or has received in the last 10 years) research support from national and international government and charitable bodies, Roche Diagnostics, and Medtronic for research unrelated to the current work. The other authors declare that they have no competing interests.

Figures

Fig. 1
Fig. 1
Illustration of the study population
Fig. 2
Fig. 2
Directed acyclic graph. MR, Mendelian randomization; BMI, body mass index; MV, multivariable. We use hypothesis-free MR to explore the potential effect of age at menarche (X) on outcomes (Y), by using SNPs that robustly relate to age at menarche as instrumental variables (Z). The directed acyclic graph shows our key assumptions for the different genetic risk scores we use in our analyses. The black lines show this main analysis; the heavily weighted black line indicated the effects we are interested in. The MR assumption that Z does not relate to Y other than through X may be violated because of the known associations between some of the age at menarche SNPs and BMI. The genetic instrument Z could be associated with the outcome due to horizontal pleiotropy via child BMI, either via its relation to adult BMI or directly (blue dashed arrows). These paths could bias our MR results. Z could also be related to BMI via vertical pleiotropy through a path from Z to X, from X to adult BMI, and from it to Y (green dashed-dotted arrows). This path implies adult BMI is part of the causal path from age at menarche to Y and would not bias our results. We used four approaches to exploring these possibilities (table). We have not systematically explored other horizontally pleiotropic pathways that could bias our results (red dotted line)
Fig. 3
Fig. 3
QQ-plots for the Mendelian randomization analysis of age at menarche in relation to 17,893 traits. a Main analysis (GRS-all). b Sensitivity analysis excluding SNPs that explained more of the variation in BMI than age at menarche (GRS-Steiger). c Sensitivity analysis excluding SNPs associated with childhood BMI (GRS-child BMI). d Sensitivity analysis excluding SNPs associated with childhood and/or adult BMI (GRS-any BMI). Green dashed line: Bonferroni-corrected threshold (P value ≤ 2.79 × 10−6). Blue dashed line: false discovery rate threshold (P value ≤ 1.73 × 10−3 for analysis using GRS-all; P value ≤ 1.61 × 10−3 for the analysis using GRS-Steiger; P value ≤ 1.68 × 10−3 for analysis using GRS-child BMI; P value ≤ 1.03 × 10−4 for analysis using GRS-any BMI). Black dotted line: actual = expected. Black points: results of tests performed in MR-pheWAS. Red stars: results with P values < 2.23 × 10−308
Fig. 4
Fig. 4
Manhattan plot of results for Mendelian randomization analysis of age at menarche in relation to 17,893 traits. a Main analysis (GRS-all). b Sensitivity analysis excluding SNPs that explained more of the variation in BMI than age at menarche (GRS-Steiger). c Sensitivity analysis excluding SNPs associated with childhood BMI (GRS-child BMI). d Sensitivity analysis excluding SNPs associated with childhood and/or adult BMI (GRS-any BMI). Gray line: Bonferroni-corrected threshold (P value ≤ 2.79 × 10−6). Blue line: false discovery rate threshold (P value ≤ 1.73 × 10−3 for analysis using GRS-all; P value ≤ 1.61 × 10−3 for the analysis using GRS-Steiger; P value ≤ 1.68 × 10−3 for analysis using GRS-child BMI; P value ≤ 1.03 × 10−4 for analysis using GRS-any BMI). All findings above the red line indicate results that have P values smaller than the limit for what is quantified in R software (P value < 2.23 × 10−308)
Fig. 5
Fig. 5
Estimates of the potential causal effect of age at menarche on bone-mineral density. BMD, bone-mineral density; BMI, body mass index; CI, confidence interval; UKBB, UK Biobank. The results reflect standard deviation difference in BMD measurements per year decrease in age at menarche. The BMD measurements were standardized by age, weight, height (heel BMD only), and genomic principal components. The measurement of femoral neck BMD was available for 22,990 women of European ancestry from the GEFOS consortium, lumbar spine BMD was available for 22,177 women of European ancestry from the GEFOS consortium, and heel BMD was available for 4566 individuals of European ancestry. For the GEFOS consortium, the main analysis of femoral and lumbar spine BMD included 263 autosomal SNPs in the genetic risk score for age at menarche, while the main analysis of heel BMD included 252 SNPs. The sensitivity analysis of femoral and lumbar spine BMD excluding BMI-related SNPs included 166 SNPs in the genetic risk score for age at menarche, while the sensitivity analysis of heel BMD included 158 SNPs
Fig. 6
Fig. 6
Estimates of the potential causal effect of age at menarche on adult standardized lung function measurements. BMI, body mass index; CI, confidence interval; FEV1, forced expiratory volume at 1 s; FVC, forced vital capacity; UKBB, UK Biobank. The results display the change in the ranked-based inverse normal transformed spirometry measurements per year decrease in age at menarche. The spirometry measurements were standardized by age, height, smoking status, and genomic principal components. The analysis in SpiroMeta included 79,055 individuals of European ethnicity. For the SpiroMeta consortium, the main analysis included 328 autosomal SNPs in the genetic risk score for age at menarche, while the sensitivity analysis excluding all SNPs related to childhood and/or adult BMI included 200 autosomal SNPs
Fig. 7
Fig. 7
Estimates of the potential causal effect of age at menarche on adult raw lung function measurements. BMI, body mass index; CI, confidence interval; FEV1, forced expiratory volume at 1 s; FVC, forced vital capacity; UKBB, UK Biobank. The results display the change in milliliters in the spirometry measurements (FEV1 and FVC), or change in the proportion airway obstruction (FEV1/FVC), per year decrease in age at menarche. The estimates are adjusted for age, height, smoking status, and genomic principal components. The analysis of the CHARGE consortium included 60,552 individuals of European ethnicity. For the CHARGE consortium, the main analysis included 350 autosomal SNPs in the genetic risk score for age at menarche, while the sensitivity analysis excluding all SNPs related to childhood and/or adult BMI included 213 autosomal SNPs
Fig. 8
Fig. 8
Estimates of the potential causal effect of age at menarche on neuroticism. BMI, body mass index; CI, confidence interval; GPC, Genetics of Personality Consortium; UKBB, UK Biobank. The estimates reflect the change in the harmonized neuroticism score per year decrease in age at menarche adjusted for age and principal components. The Genetics of Personality Consortium (GPC) analysis included 63,661 individuals. For the GPC consortium, the main analysis included 344 SNPs in the genetic risk score for age at menarche, while the sensitivity analysis excluding SNPs associated with BMI included 208 SNPs
Fig. 9
Fig. 9
Estimates of the potential causal effect of age at menarche on risk of sexual abuse. ALSPAC, Avon Longitudinal Study of Parents and Children; BMI, body mass index; CI, confidence interval; UKBB, UK Biobank. The ordinal response scale to sexual abuse in UK Biobank was converted to a binary variable denoting whether the participant reported any history of childhood sexual abuse, to be comparable to the replication cohort. The estimates reflect the change in risk of sexual abuse per year decrease in age at menarche after adjusting for 5 principal components. The analysis of the Avon Longitudinal Study of Parents and Children (ALSPAC) cohort included 5953 women. For ALSPAC, the main analysis included 342 SNPs in the genetic risk score for age at menarche, while the sensitivity analysis excluding SNPs associated with BMI included 208 SNPs

References

    1. Charalampopoulos D, McLoughlin A, Elks CE, Ong KK. Age at menarche and risks of all-cause and cardiovascular death: a systematic review and meta-analysis. Am J Epidemiol. 2014;180:29–40. - PMC - PubMed
    1. Luijken J, van der Schouw YT, Mensink D, Onland-Moret NC. Association between age at menarche and cardiovascular disease: a systematic review on risk and potential mechanisms. Maturitas. 2017;104:96–116. - PubMed
    1. Gong TT, Wang YL, Ma XX. Age at menarche and endometrial cancer risk: a dose-response meta-analysis of prospective studies. Sci Rep. 2015;5:14051. - PMC - PubMed
    1. Gong TT, Wu QJ, Vogtmann E, Lin B, Wang YL. Age at menarche and risk of ovarian cancer: a meta-analysis of epidemiological studies. Int J Cancer. 2013;132:2894–2900. - PMC - PubMed
    1. Miller LJ, Girgis C, Gupta R. Depression and related disorders during the female reproductive cycle. Womens Health (Lond) 2009;5:577–587. - PubMed

Publication types

LinkOut - more resources