. 2020 Mar 19;180(6):1115-1129.e13.
doi: 10.1016/j.cell.2020.02.050.

Influenza Virus Z-RNAs Induce ZBP1-Mediated Necroptosis

Affiliations

Influenza Virus Z-RNAs Induce ZBP1-Mediated Necroptosis

Ting Zhang et al. Cell. .

Abstract

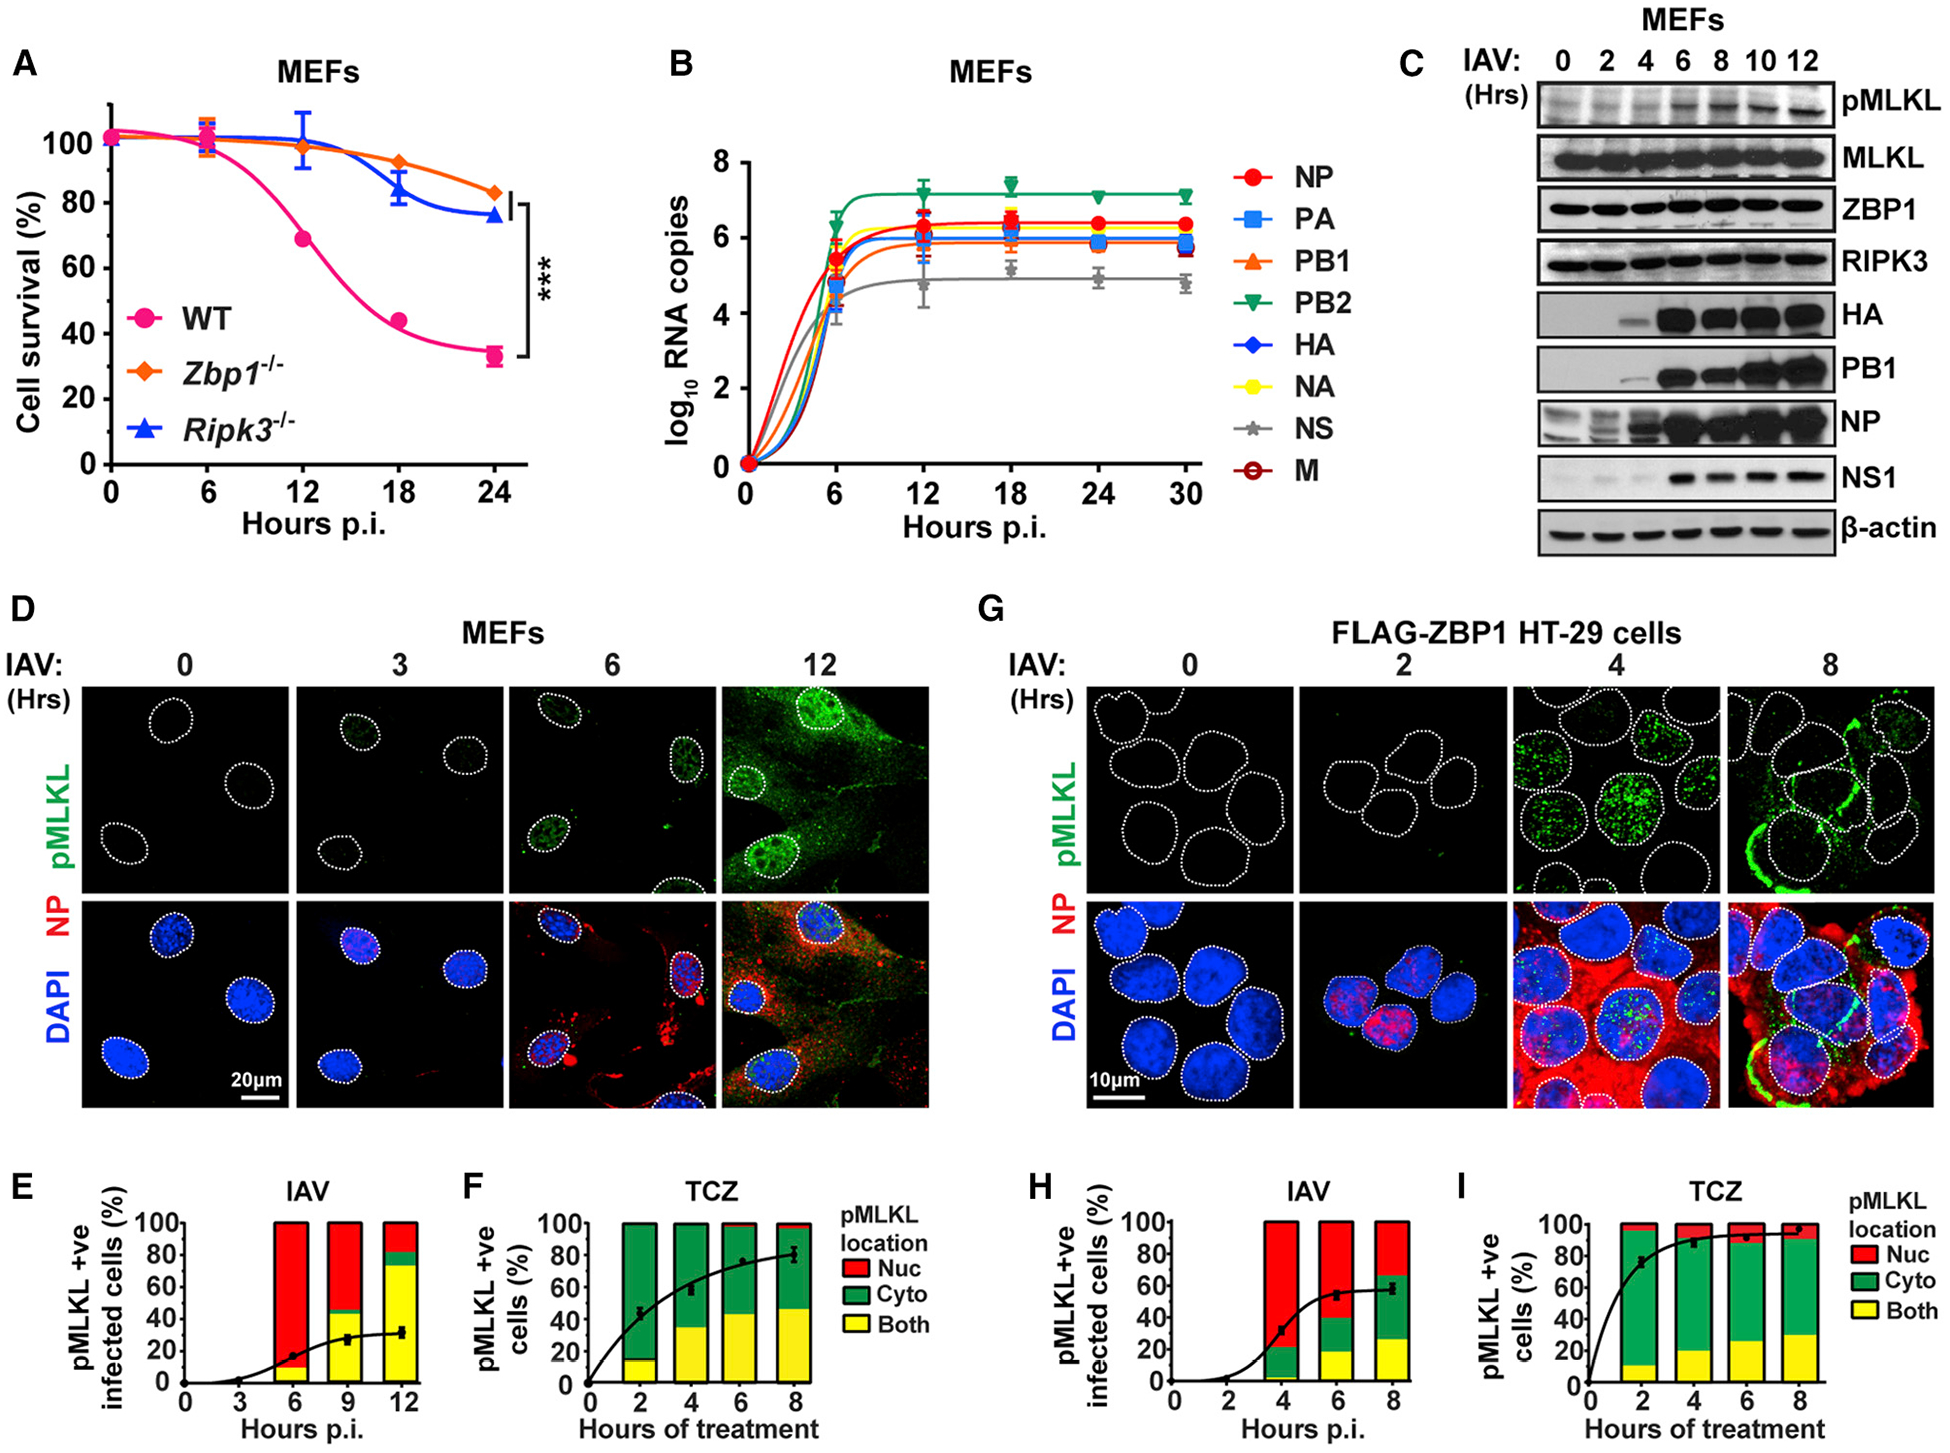
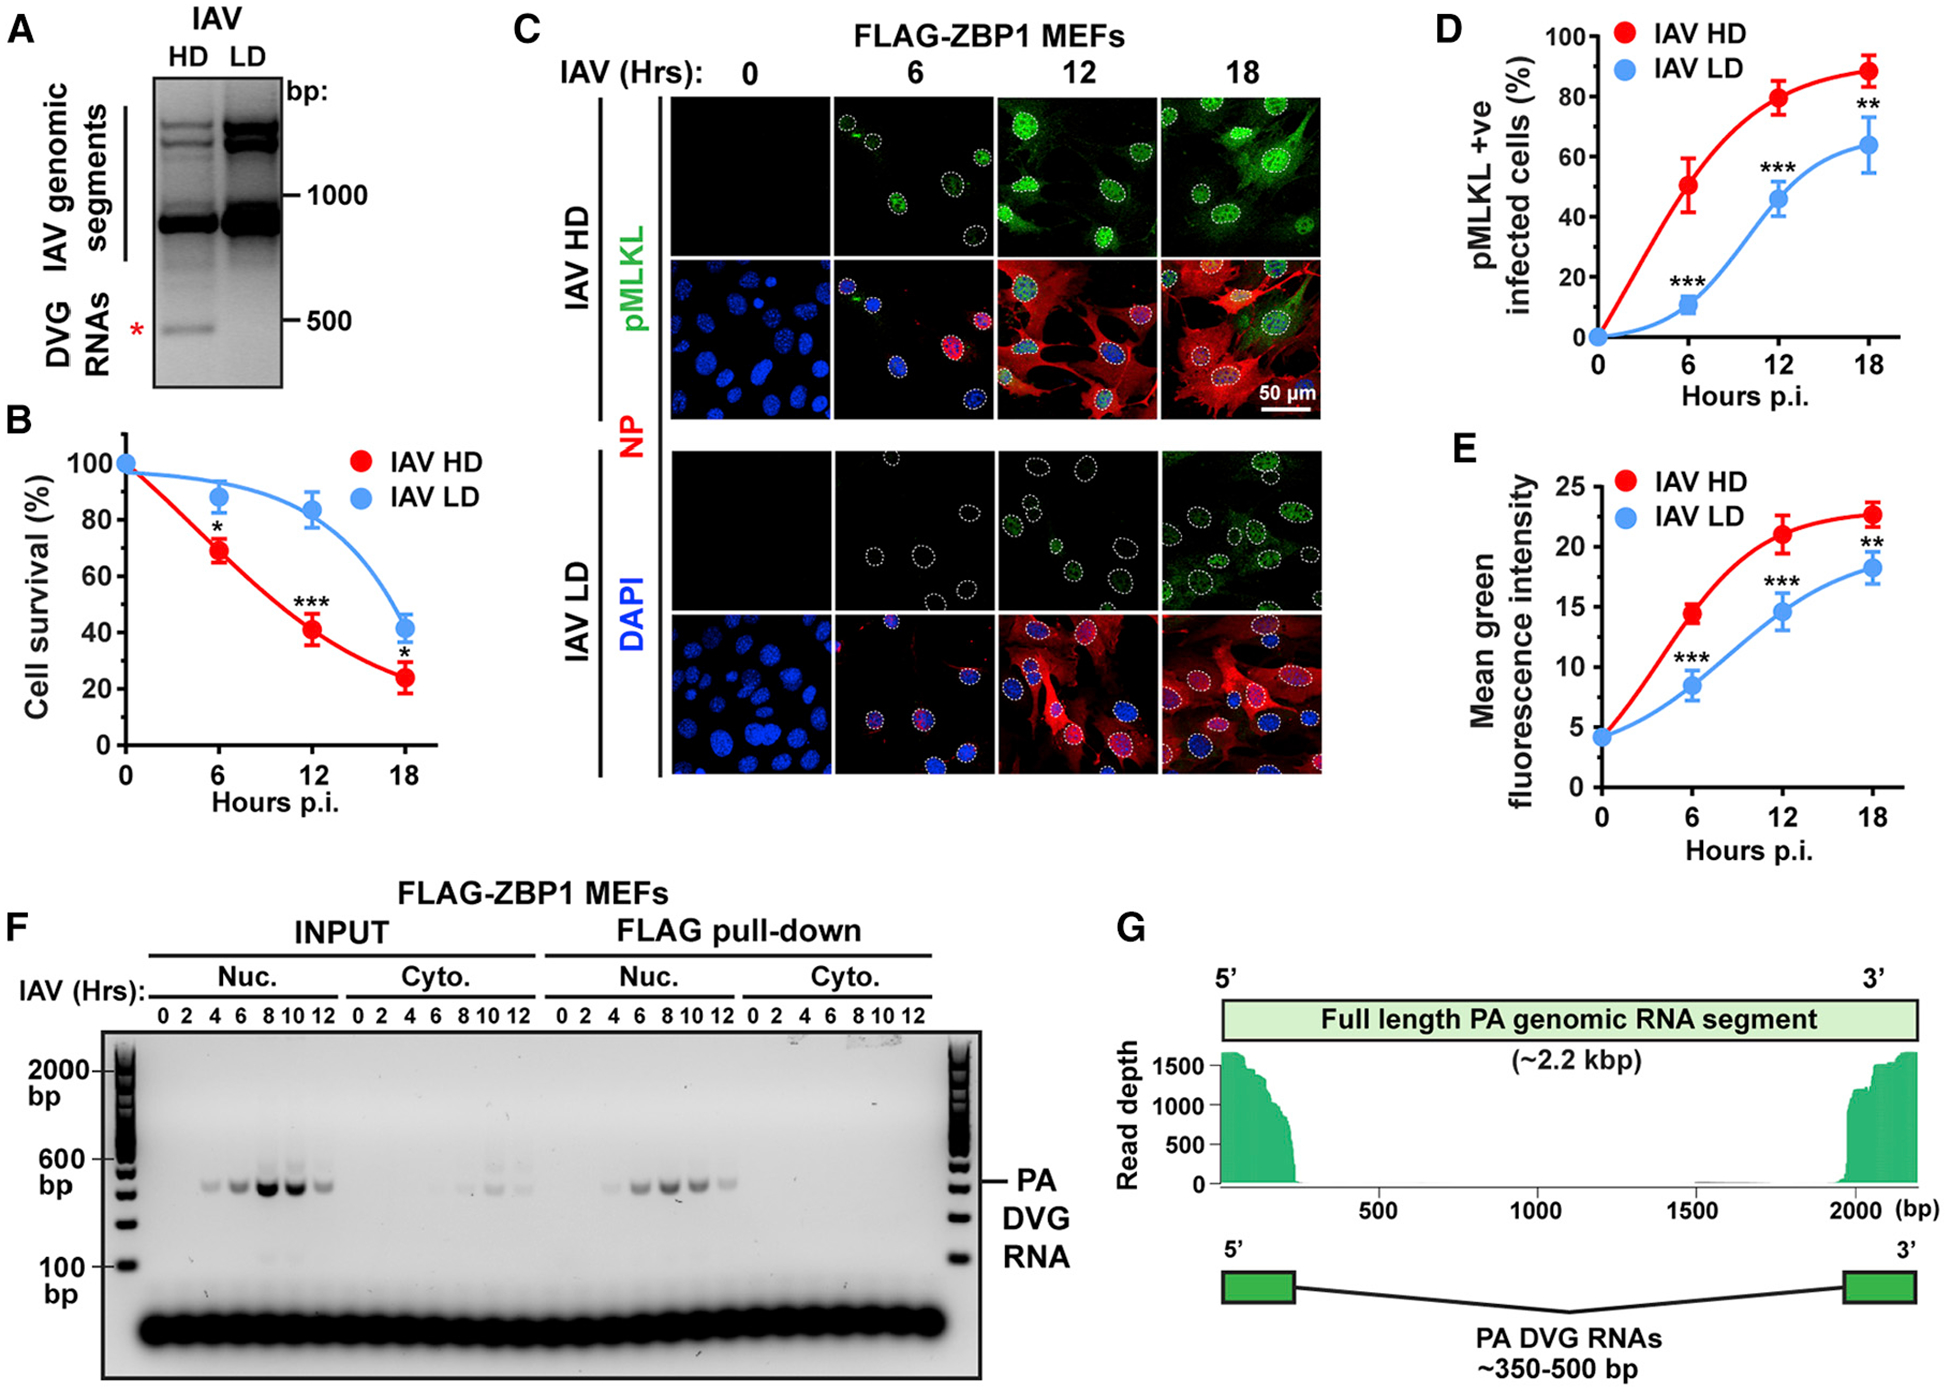
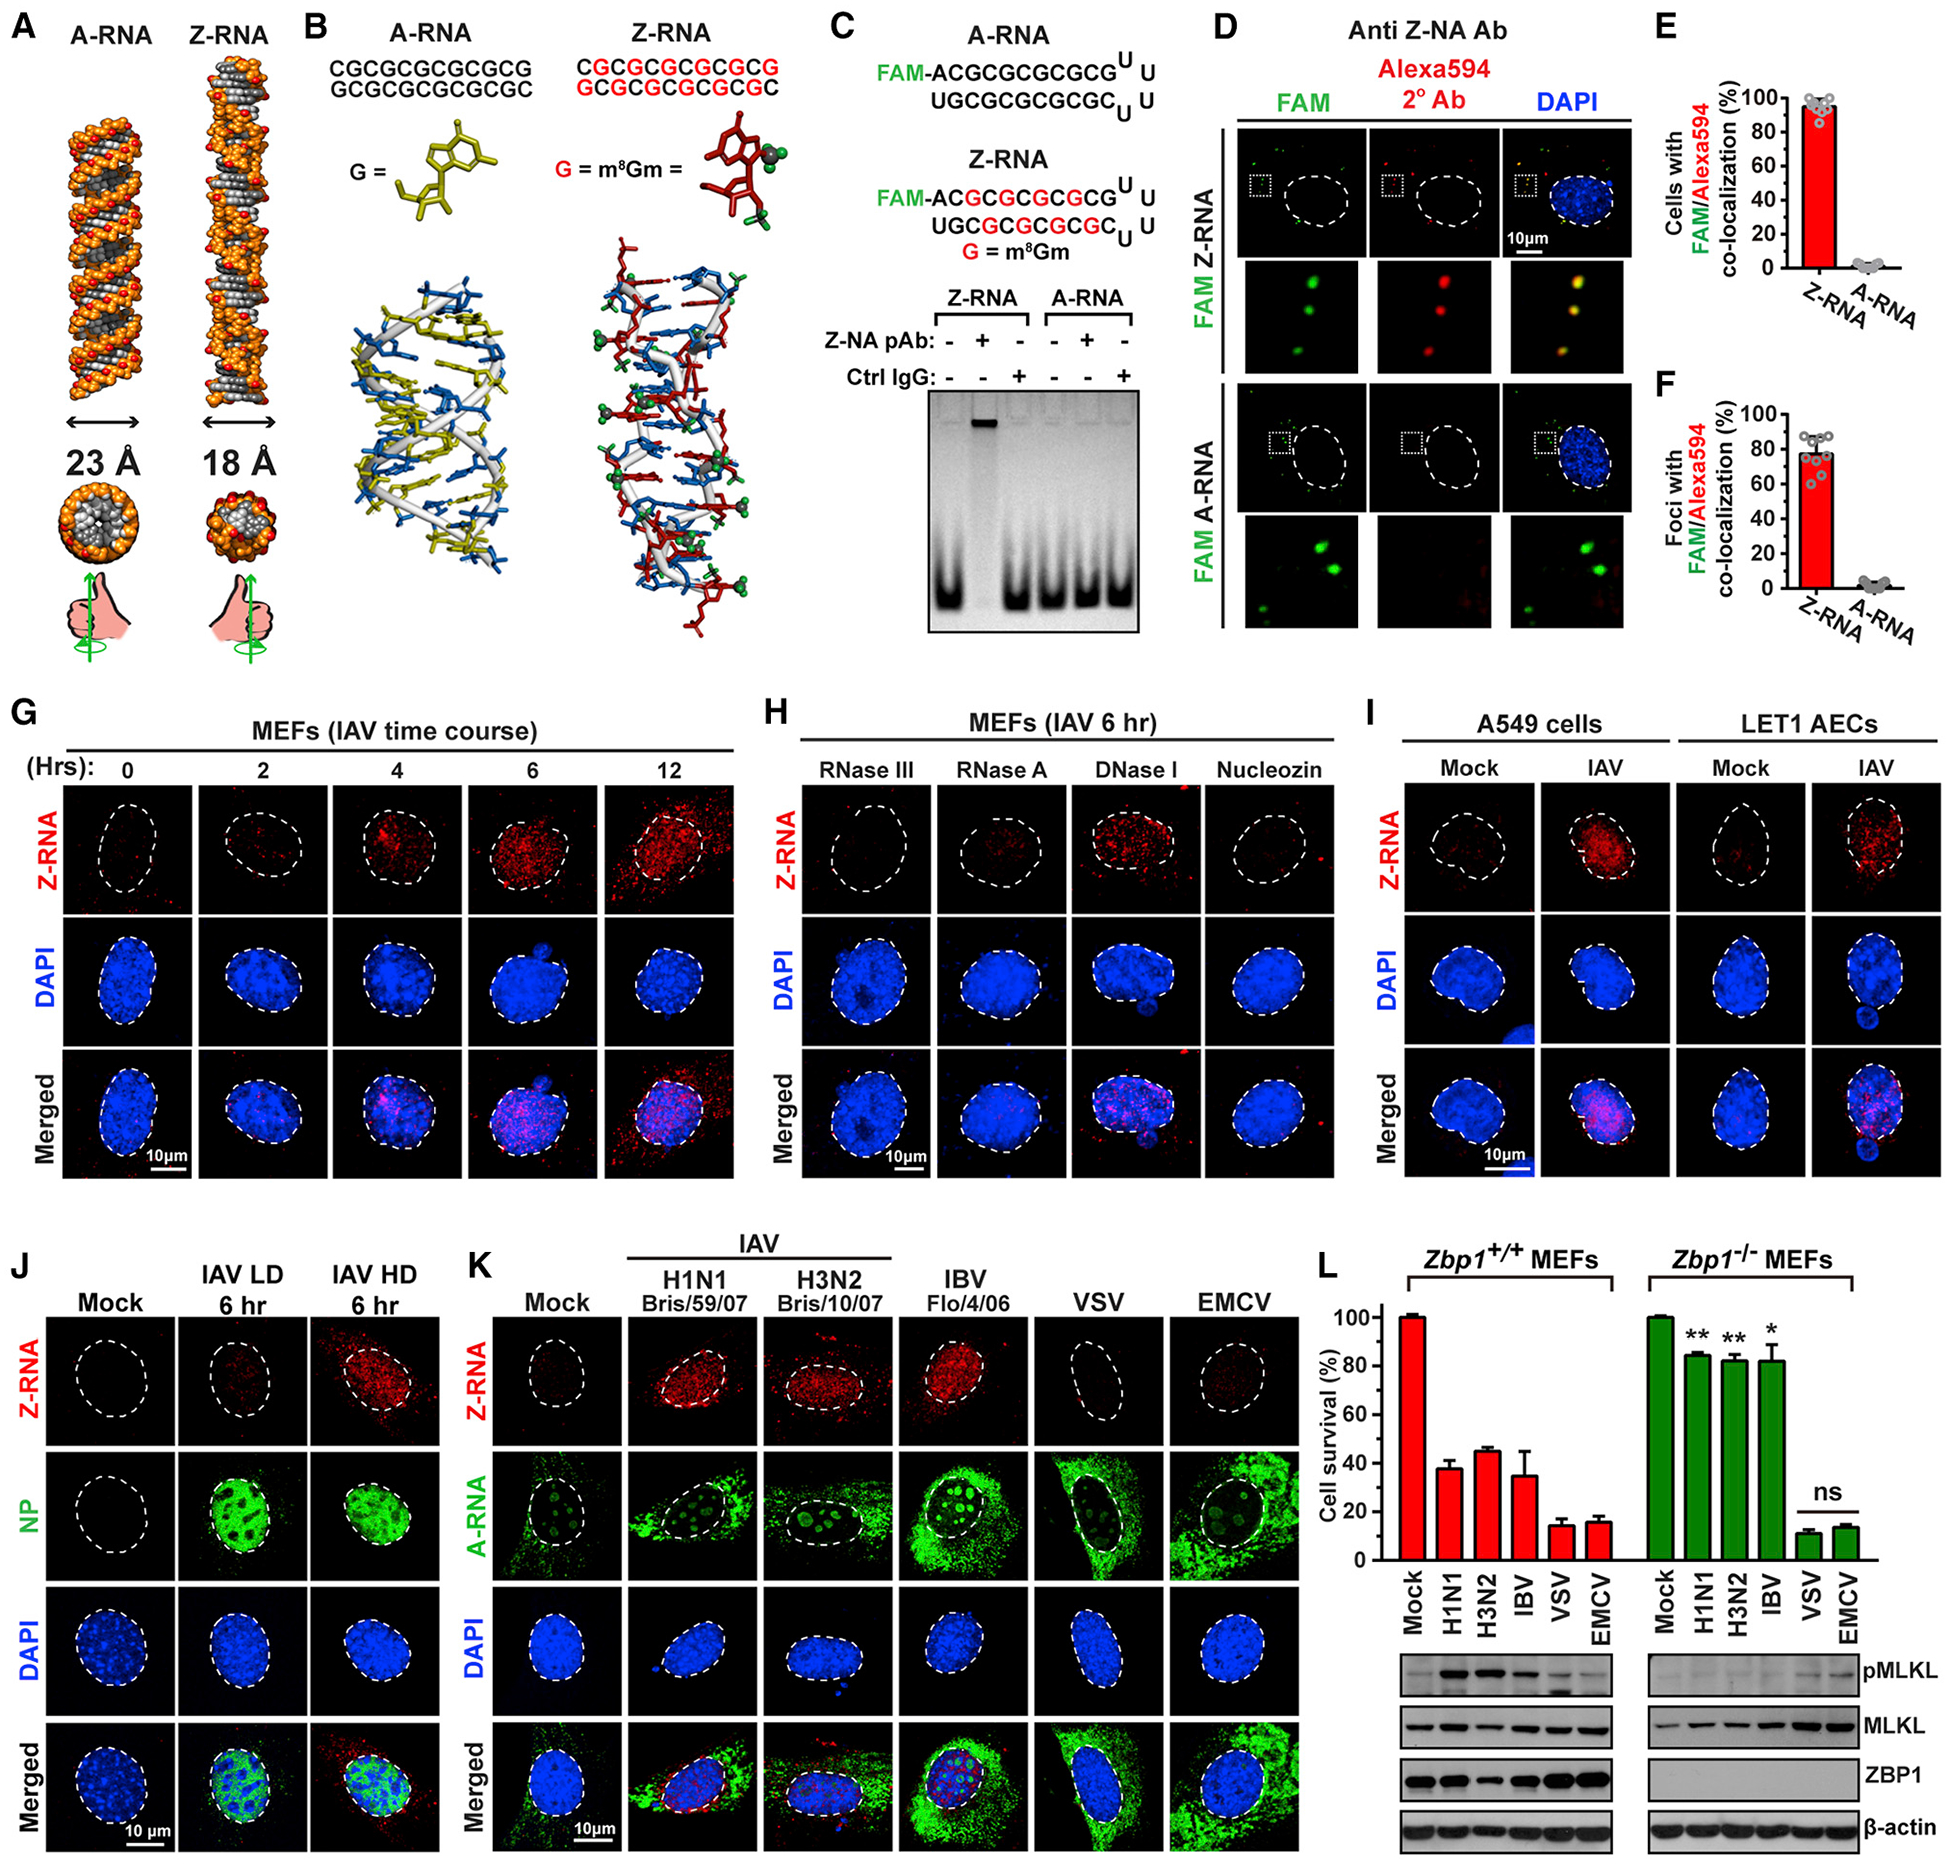
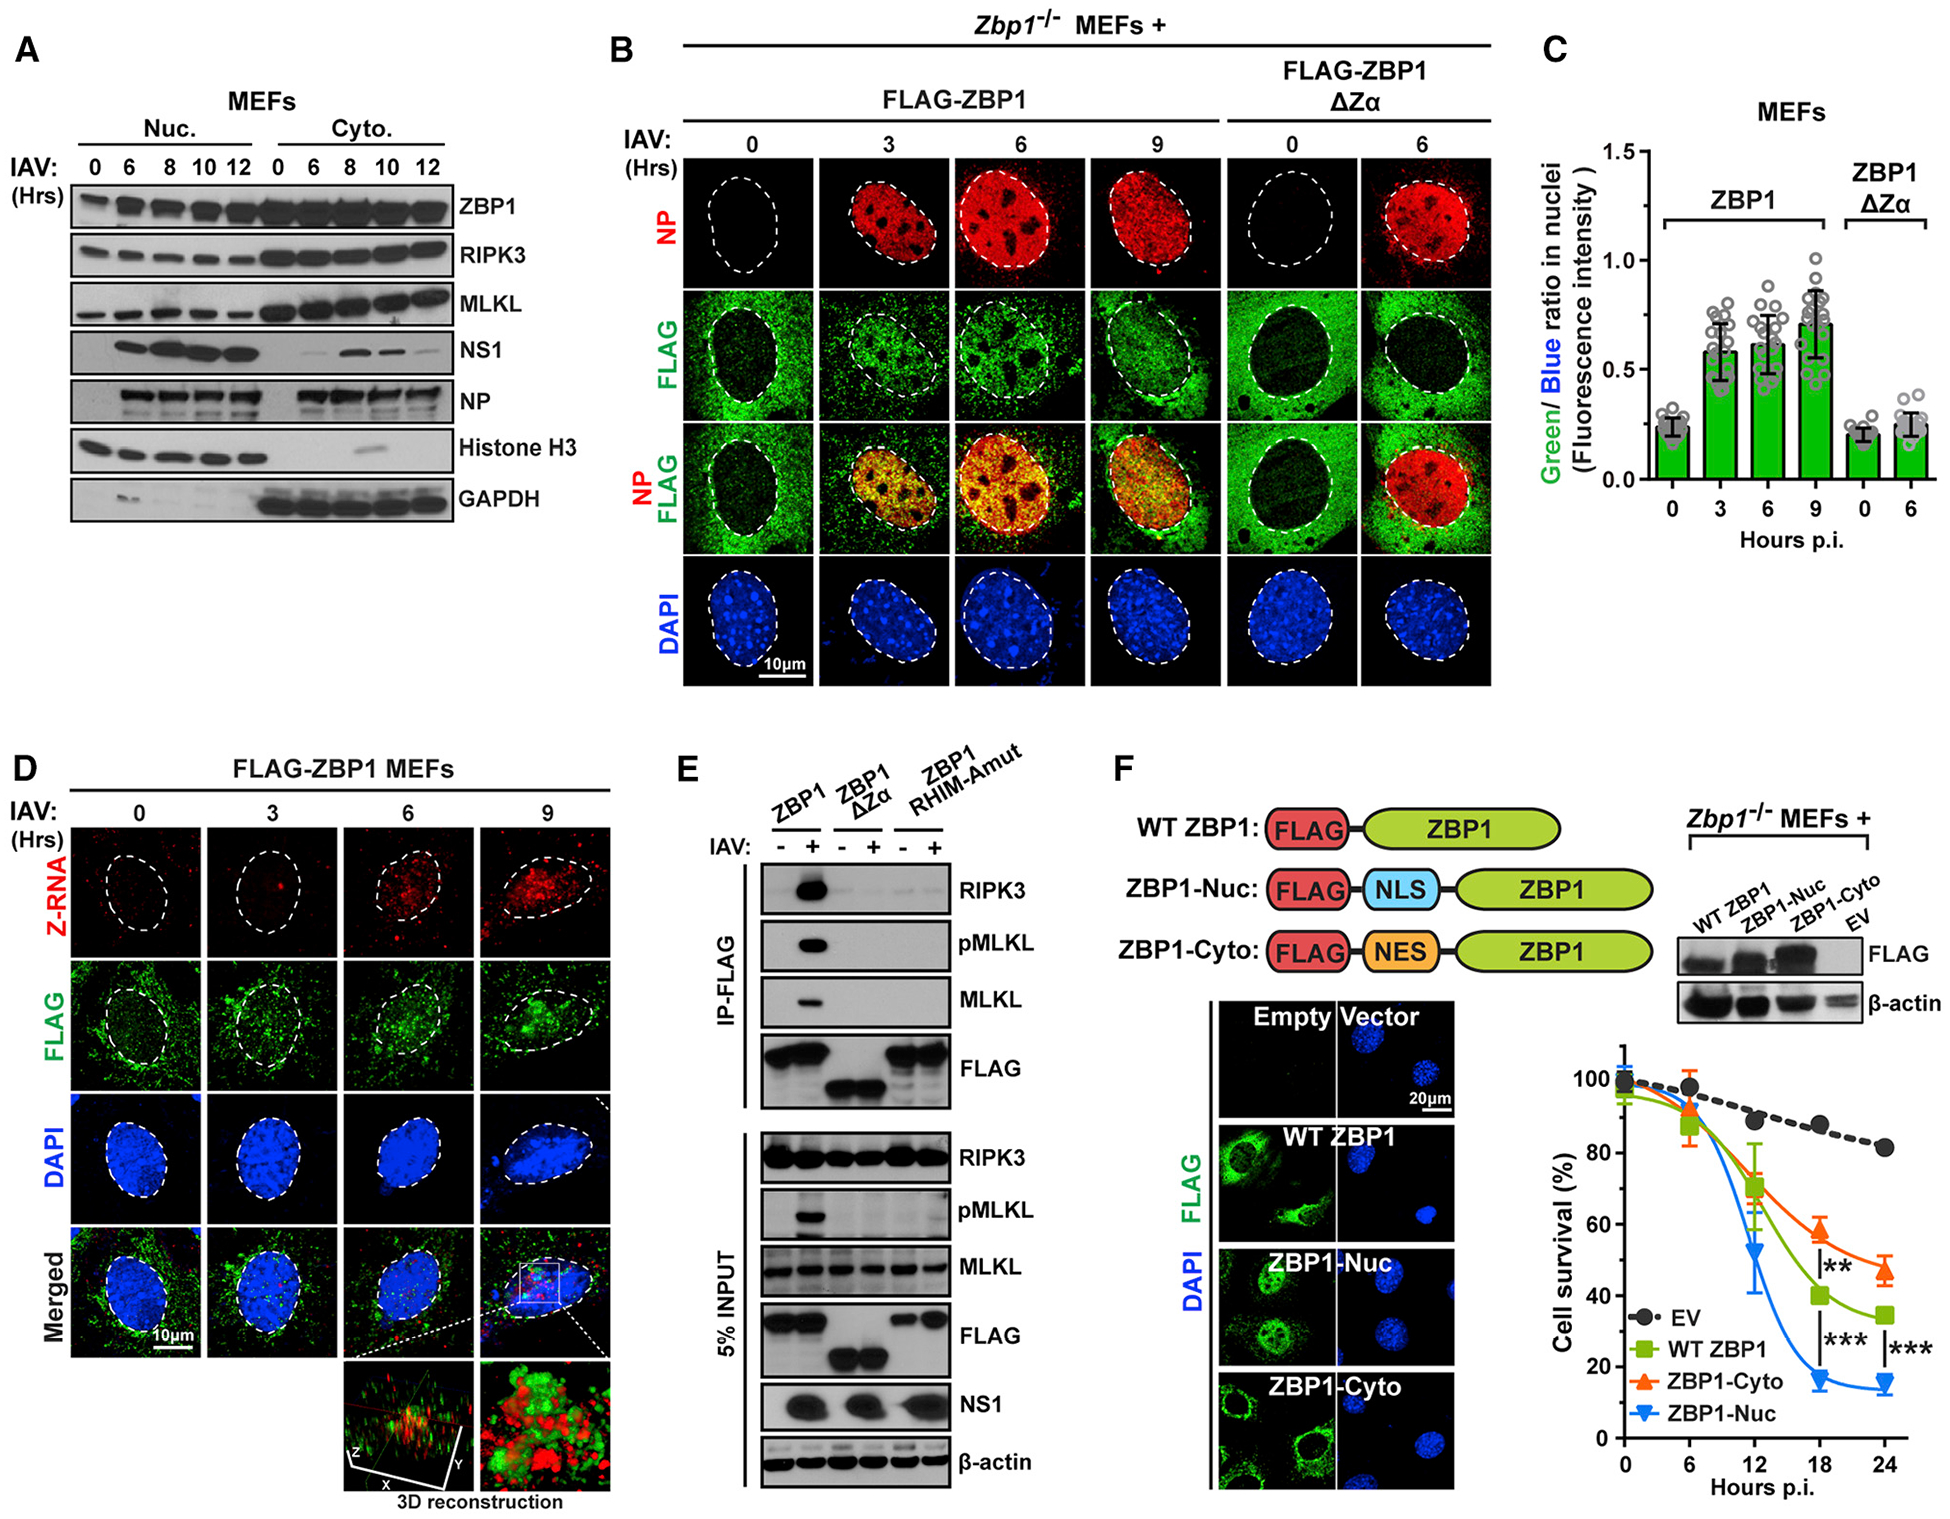
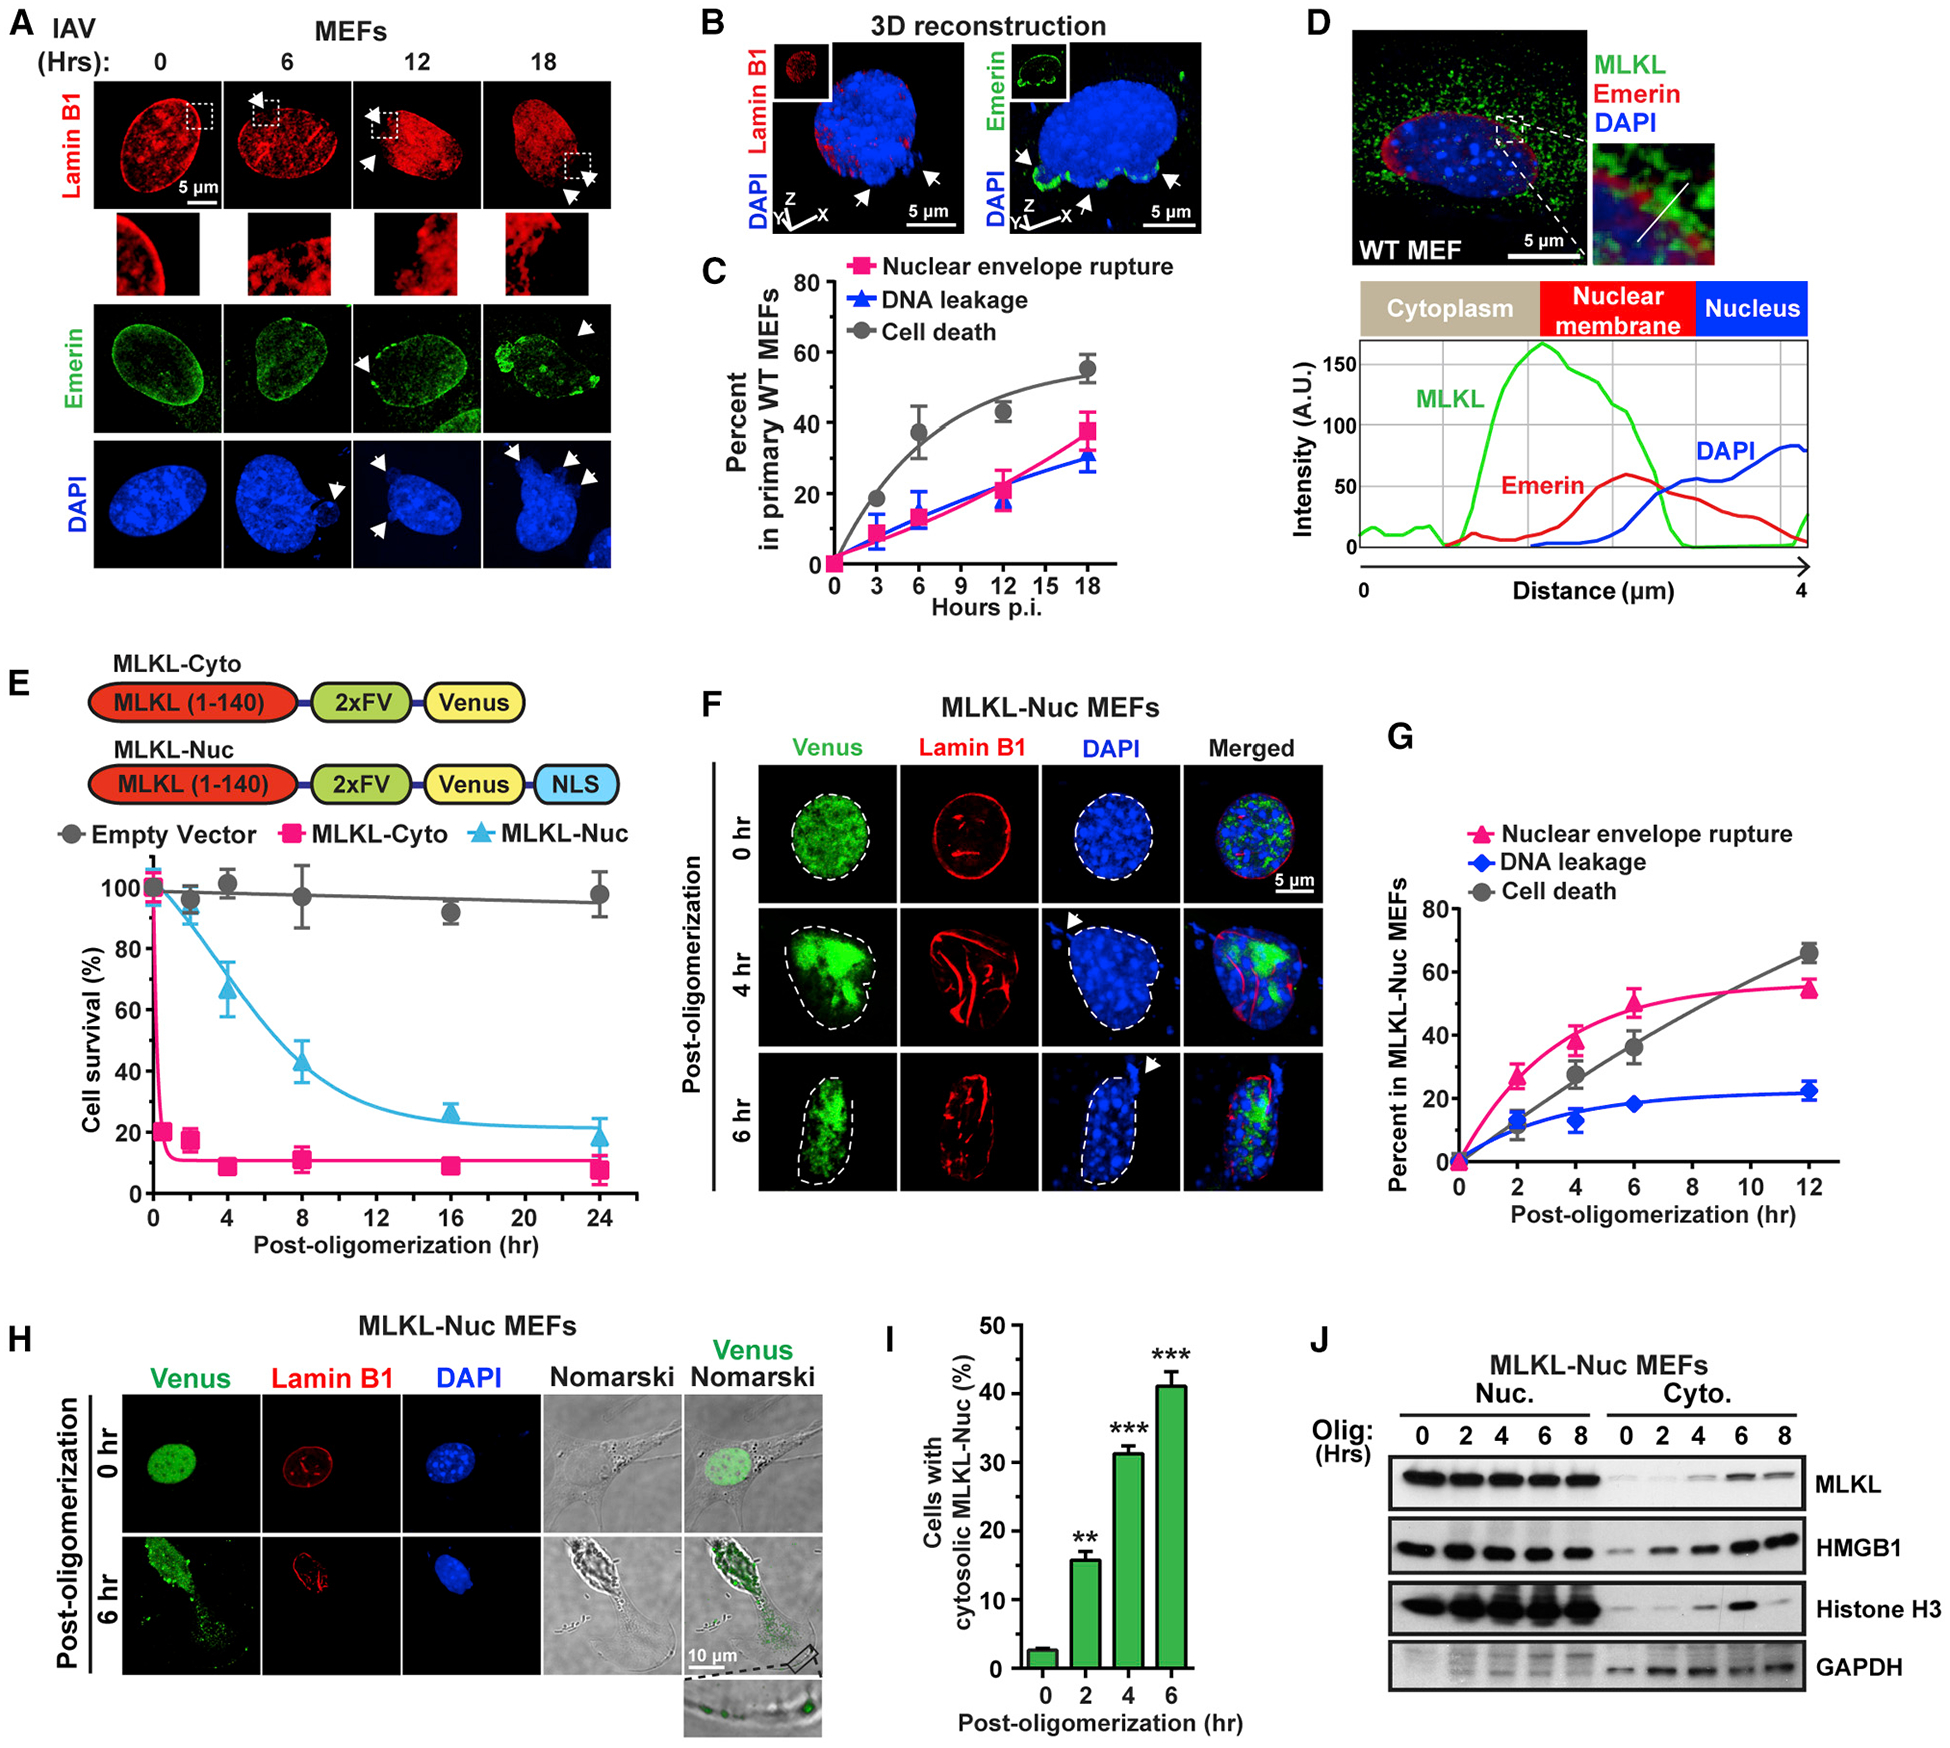
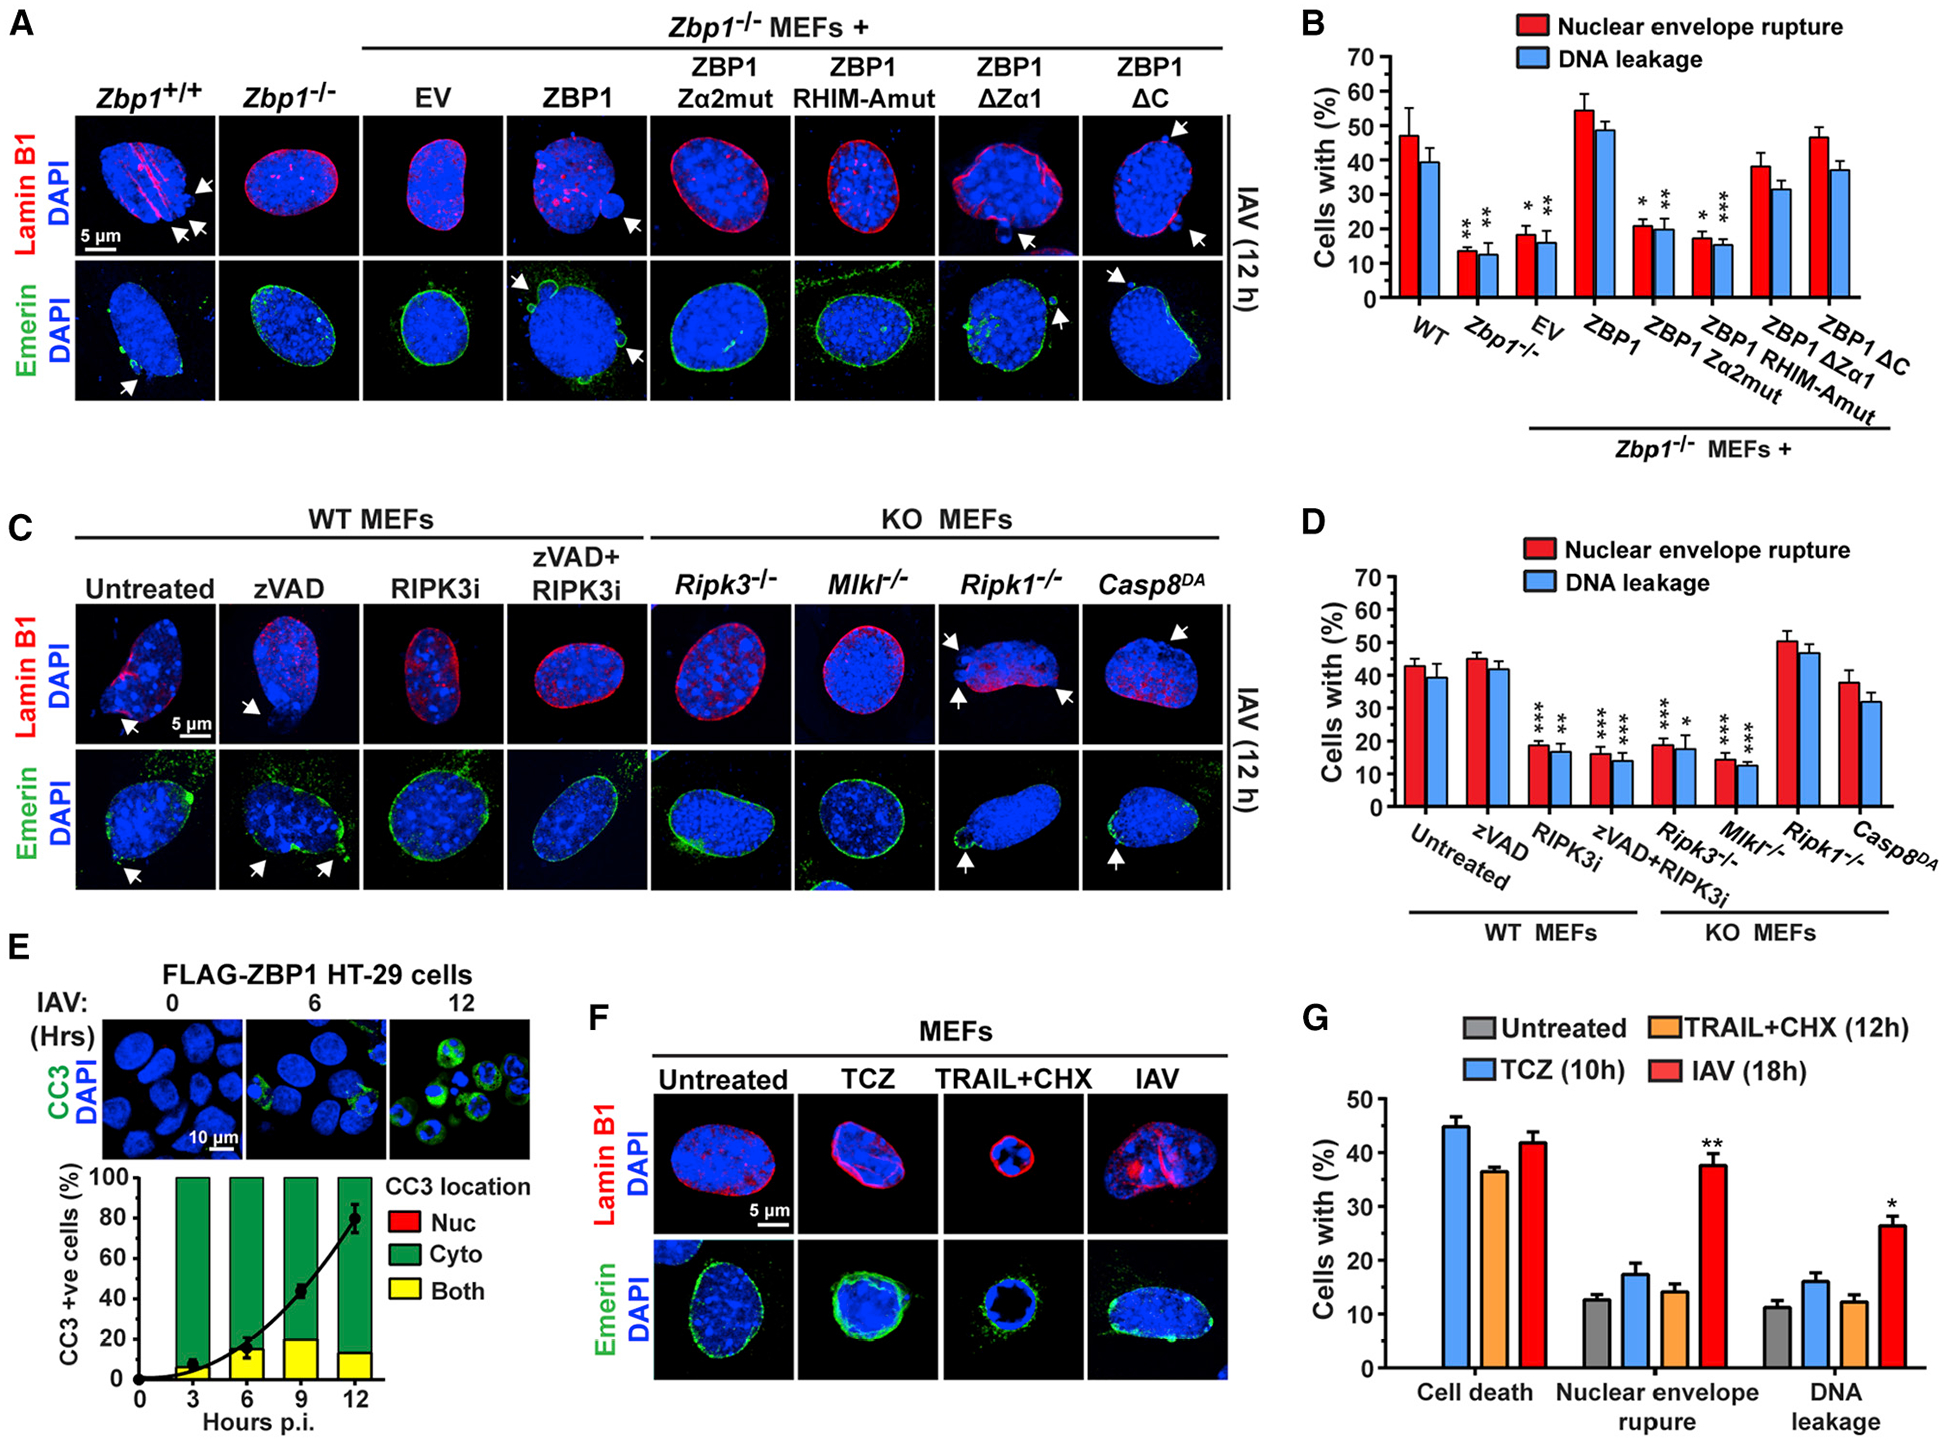
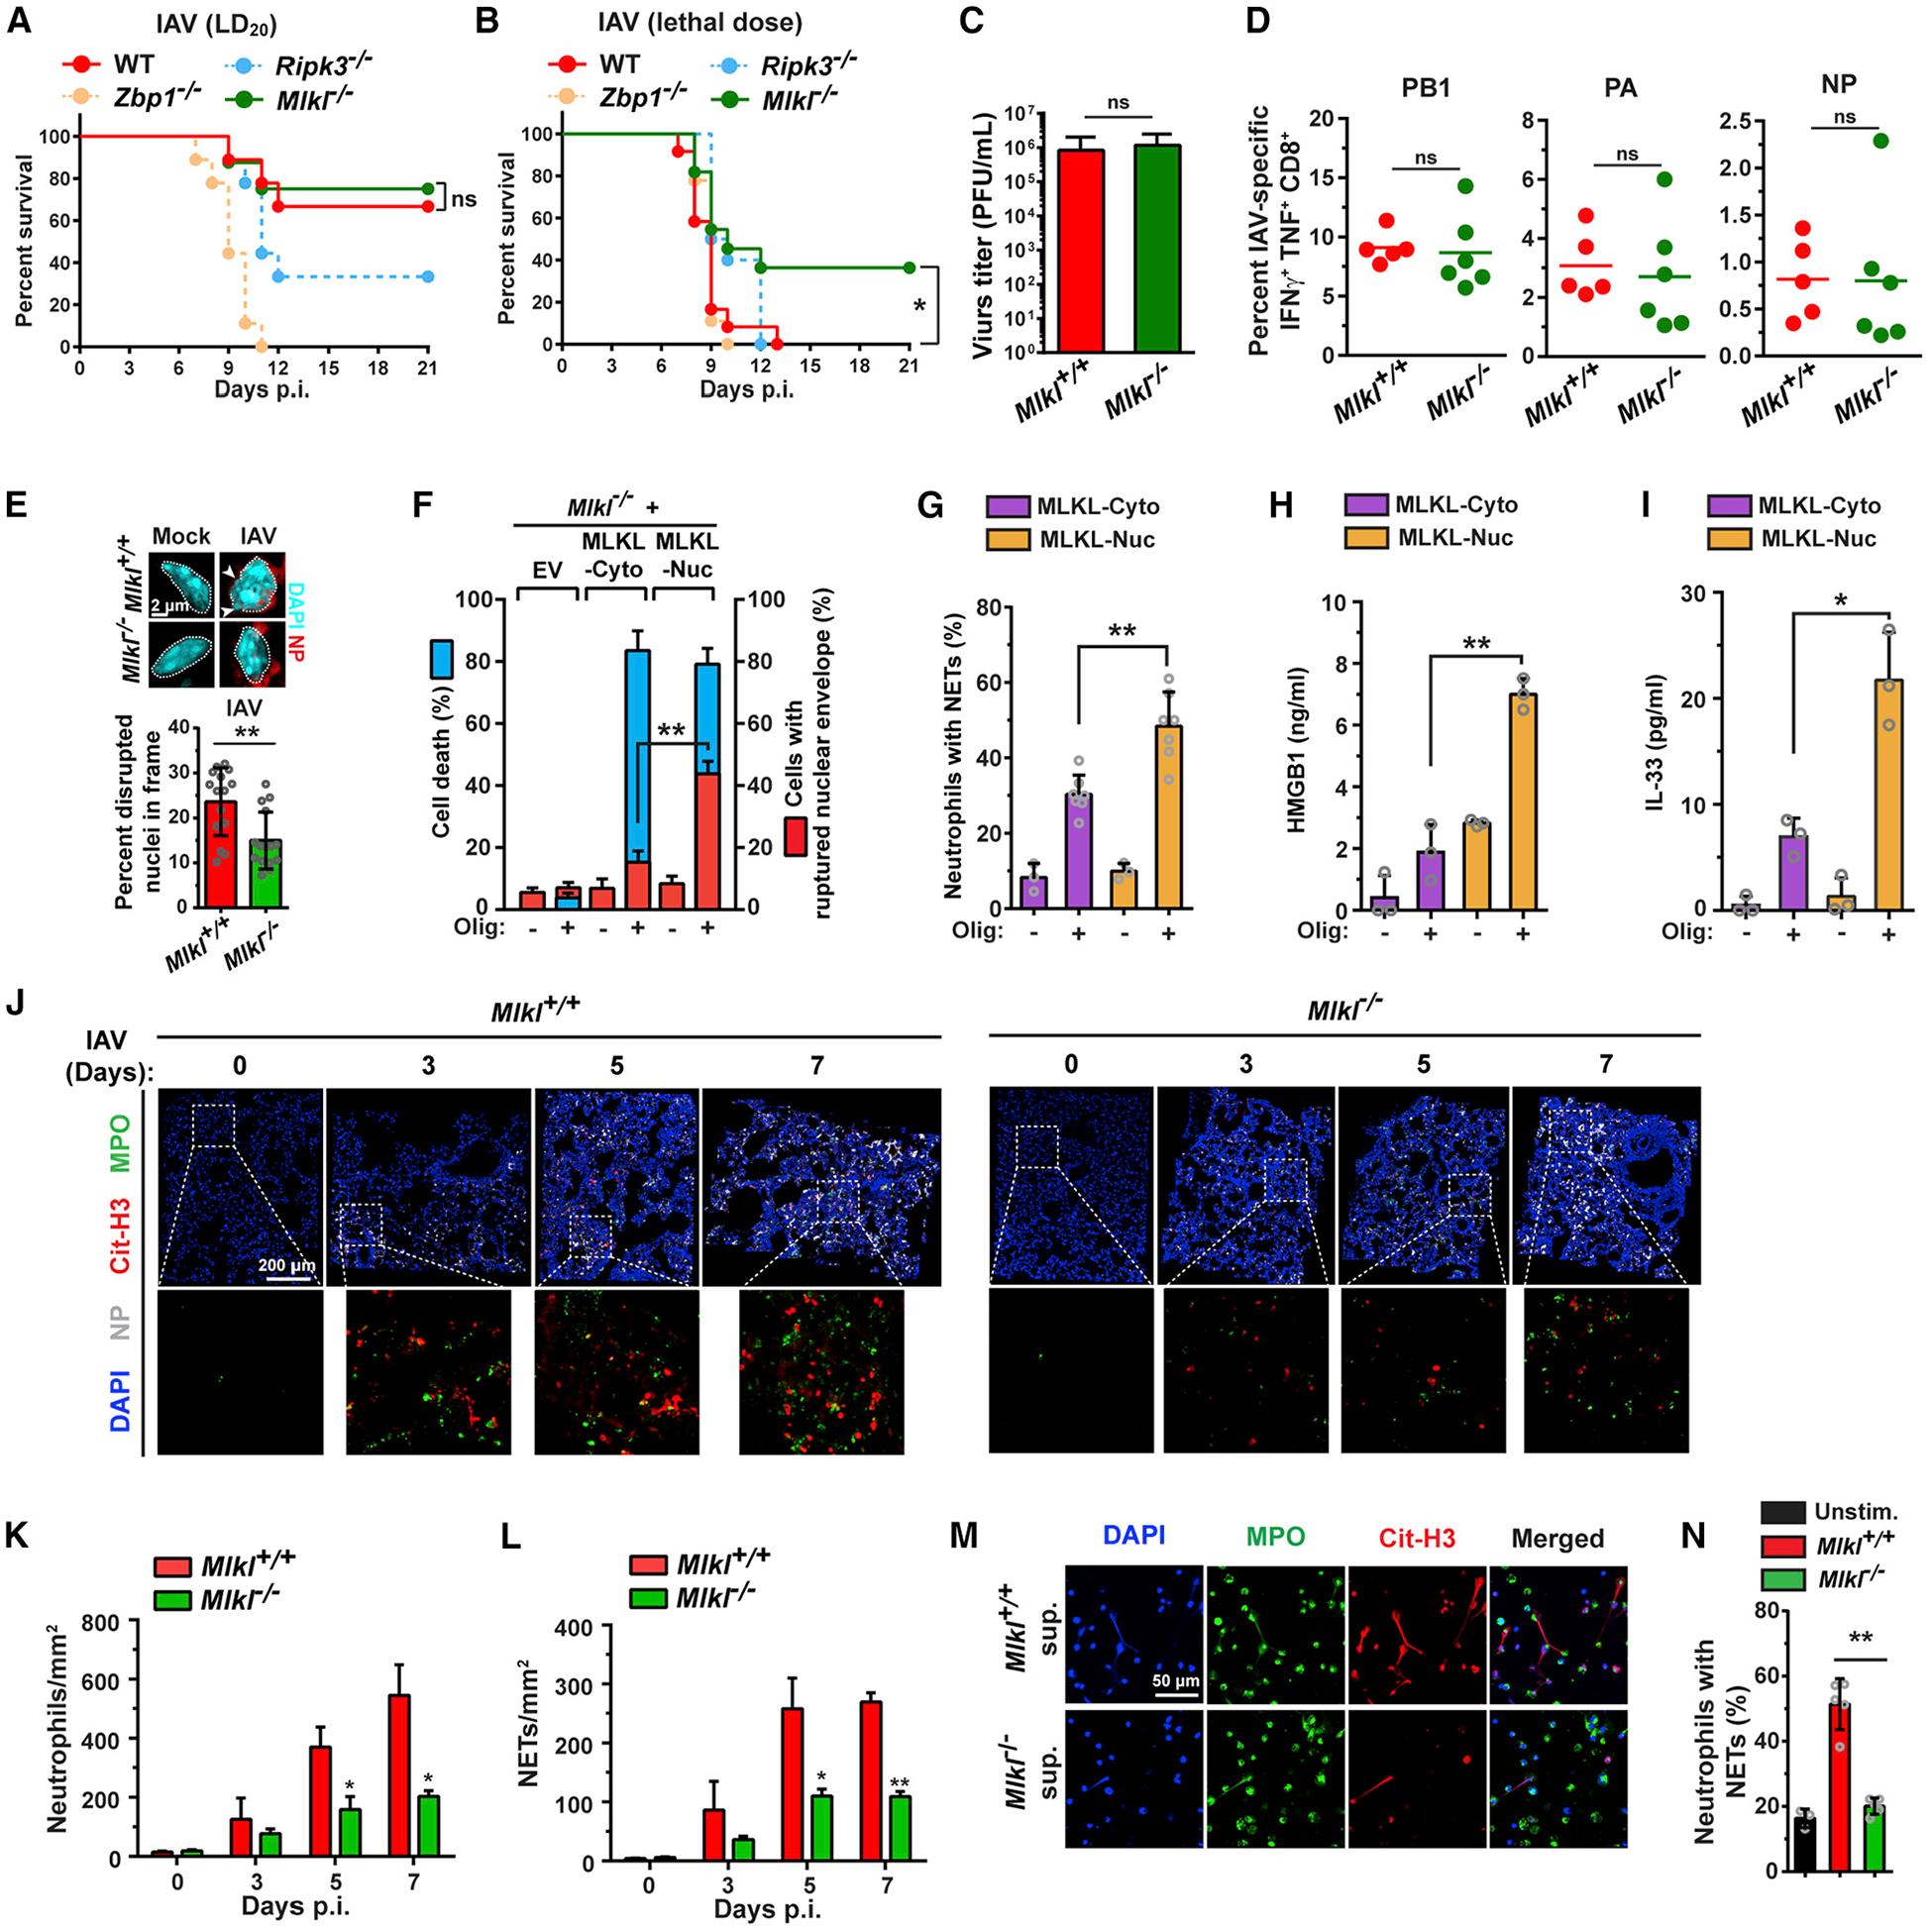
Influenza A virus (IAV) is a lytic RNA virus that triggers receptor-interacting serine/threonine-protein kinase 3 (RIPK3)-mediated pathways of apoptosis and mixed lineage kinase domain-like pseudokinase (MLKL)-dependent necroptosis in infected cells. ZBP1 initiates RIPK3-driven cell death by sensing IAV RNA and activating RIPK3. Here, we show that replicating IAV generates Z-RNAs, which activate ZBP1 in the nucleus of infected cells. ZBP1 then initiates RIPK3-mediated MLKL activation in the nucleus, resulting in nuclear envelope disruption, leakage of DNA into the cytosol, and eventual necroptosis. Cell death induced by nuclear MLKL was a potent activator of neutrophils, a cell type known to drive inflammatory pathology in virulent IAV disease. Consequently, MLKL-deficient mice manifest reduced nuclear disruption of lung epithelia, decreased neutrophil recruitment into infected lungs, and increased survival following a lethal dose of IAV. These results implicate Z-RNA as a new pathogen-associated molecular pattern and describe a ZBP1-initiated nucleus-to-plasma membrane "inside-out" death pathway with potentially pathogenic consequences in severe cases of influenza.

Keywords: MLKL; RIPK3; Z-RNA; ZBP1; apoptosis; caspase-8; dsRNA; influenza; necroptosis.


Conflict of interest statement

Declaration of Interests The authors declare no competing interests.

Figures

Figure 1.
Figure 1.. ZBP1 Activates MLKL in the Nucleus of IAV-Infected Cells
(A) IAV-induced cell death kinetics in primary wild-type (WT), Zbp1−/−, and Ripk3−/− MEFs. (B) IAV vRNA production kinetics in infected WT MEFs. (C) Immunoblot analysis of MLKL activation and viral protein synthesis in WT MEFs. (D) Immunofluorescence staining of IAV-infected WT MEFs for phosphorylated MLKL (green) and NP expression (red). (E and F) Quantification of pMLKL localization in IAV-infected (E) and TCZ-treated (F) WT MEFs. (G) Immunofluorescence staining of IAV-infected FLAG-ZBP1 expressing HT-29 cells for phosphorylated MLKL (green) and NP expression (red). (H and I) Quantification of pMLKL localization in IAV-infected (H) and TCZ-treated (I) FLAG-ZBP1 HT-29 cells. Line graphs in (E), (F), (H), and (I) represent the kinetics of pMLKL positivity, and bar graphs show the localization of pMLKL signal. Nuclei are stained with DAPI (blue) and outlined by dashed white lines. TCZ = human or murine TNFα (50 ng/mL) + cycloheximide (250 ng/mL) + zVAD (50 μM). IAV PR8 was used at MOI = 2 in these experiments. Data are representative of at least three independent experiments. Error bars represent mean ± SD. Two-way ANOVA and Tukey’s multiple comparisons test, ***p < 0.0005. Scale bars represent 20 μm (D) and 10 μm (G). See also Figure S1.
Figure 2.
Figure 2.. ZBP1 Senses IAV DVG RNA in the Nucleus
(A) PCR of full-length IAV genomic segments and DVGs in A549 cells infected with IAV PR8 stocks with high (HD) or low (LD) DI particle content. DVGs are indicated by a red asterisk. (B) Cell death kinetics after IAV HD or LD virus infection of WT MEFs. (C) Immunofluorescence staining for pMLKL (green) and NP (red) in WT MEFs infected with IAV HD or IAV LD virus. Nuclei are stained with DAPI (blue) and outlined with dashed white lines. (D) Quantification of pMLKL+ cells as a percentage of infected (NP+) cells. (E) Quantification of mean fluorescence intensity of the pMLKL signal per cell. (F) Immortalized Zbp1−/− MEFs stably expressing FLAG-ZBP1 and infected with IAV were separated into nuclear and cytoplasmic fractions at the indicated times p.i. PA segment-derived DVG RNAs in input lysates or eluted from FLAG-ZBP1 pull-downs were determined by PCR. (G) Paired-end sequencing was performed on PA segment-specific PCR amplicons of IAV RNAs eluted from FLAG-ZBP1 nuclear immunoprecipitates. Sequences with significant overlap are shown mapped to the full-length IAV PR8 PA segment. IAV was used at MOI = 2 in this figure. Data in (A)–(F) are representative of at least three independent experiments. RNA-seq for data in (G) was performed once. Error bars represent mean ± SD. Unpaired Student’s t test, *p < 0.05, **p < 0.005, ***p < 0.0005. Scale bar represents 50 μm.
Figure 3.
Figure 3.. IAV Produces Z-RNAs in the Nucleus
(A) Structures of A-RNA and Z-RNA. Diameters, cross-sections, and “handedness” of each double helix are also depicted. (B) BIOVIA software generated models of unmodified (left) and m8Gm-modified (right) CG-repeat 12-mer RNA duplexes. Guanosines are shown in yellow and m8Gm-modified guanosine analogs in red, with the 2′-O-methyl and 8-methyl substitutions depicted in green. Cytidine nucleosides are shown in blue. (C) Schematic representation of FAM-labeled A-RNA and Z-RNA hairpins, with m8Gm-modified guanosine shown in red (top). Electrophoretic mobility shift assay (EMSA) of synthetic A-RNA and Z-RNA in the presence of Z-NA antiserum or an equivalent amount of sheep IgG isotype control (bottom). (D) WT MEFs transfected with FAM-labeled (green) synthetic Z-RNA (top) or A-RNA (bottom) and fixed 6 h post-transfection were stained with sheep polyclonal anti-Z-NA antiserum, and detected with Alexa594-conjugated secondary antibody (red). Areas selected in the upper images are shown magnified below each image. Nuclei are stained with DAPI (blue) and outlined with dashed lines. (E) Quantification of cells displaying co-localization of Z-RNA or A-RNA (green) and anti-Z-NA antiserum (red) signals. (F) Quantification of FAM-positive foci per transfected cell that co-localize with anti-Z-NA antiserum. (G) Time course of Z-RNA formation in IAV infected MEFs (PR8, MOI = 10). Fixed cells were treated with proteinase K for 40 min before staining. (H) WT MEFs infected with IAV (PR8, MOI = 10) and fixed at 6 h p.i. were exposed to the indicated nucleases for 45 min, before staining with anti-Z-NA antiserum. IAV RNA polymerase inhibitor nucleozin (20 ng/mL) was added to cells 1 h before infection. (I) A549 and LET1 airway epithelial cells (AECs) were infected with IAV (PR8, MOI = 10), fixed at 6 h p.i., and stained for Z-RNA. (J) WT MEFs were infected with IAV HD or LD (MOI = 10) for 6 h and stained with anti-Z-NA antiserum. (K) WT MEFs were infected with the indicated RNA viruses (MOI = 10), fixed at 6 h p.i., and examined for presence of Z-RNA or A-RNA. Of note, the anti-A-RNA antibody produced modest nucleolar and cytoplasmic signals in uninfected cells. The cytoplasmic signal was perinuclear, punctate, and may represent mitochondrial dsRNAs (Dhir et al., 2018). (L) Zbp1+/+ and Zbp1−/− MEFs were infected with the indicated RNA viruses (MOI = 2), and viability was determined at 24 h p.i. Immunoblot analysis shows the level of phosphorylated MLKL, total MLKL and ZBP1 after infection. Nuclei are stained with DAPI (blue) and outlined with dashed white lines. Data are representative of at least three independent experiments. Error bars represent mean ± SD. Unpaired Student’s t test, *p < 0.05, **p < 0.005. Scale bars represent 10 μm. See also Figures S2 and S3.
Figure 4.
Figure 4.. ZBP1 Co-localizes with Z-RNA in the Nucleus following IAV Infection
(A) IAV-infected (PR8, MOI = 2) WT MEFs were lysed at the indicated times p.i., separated into nuclear and cytoplasmic fractions, and examined for ZBP1, MLKL, RIPK3, and viral proteins by immunoblotting. Immunoblotting for GAPDH and histone H3 was used to confirm purity of cytoplasmic and nuclear fractions. (B) Zbp1−/− MEFs stably reconstituted with either FLAG-ZBP1 or a mutant of ZBP1 (ΔZα) lacking both its Zα domains were infected with IAV (PR8, MOI = 10) and evaluated for ZBP1 localization over a time course of 9 h. Virus replication was assessed by co-staining for NP in the same cells. (C) Quantification of the ratio of FLAG signal (green) and DAPI (blue) in nuclei indicates extent of nuclear accumulation of ZBP1 or mutant ZBP1. (D) Zbp1−/− MEFs stably expressing FLAG-ZBP1 and infected with IAV (PR8, MOI = 10) were subjected to limited (20 min) proteinase K digestion post-fixation, and co-stained for Z-RNA (red) and FLAG-ZBP1 (green). 3D reconstruction of co-stained nuclei shows areas of Z-RNA:ZBP1 co-localization (yellow). (E) Zbp1−/− MEFs reconstituted with FLAG-tagged WT ZBP1, ZBP1 lacking its Zα domains (ΔZα) or carrying a four amino acid (IQIG → AAAA) substitution in its first RHIM (RHIM-Amut) were infected with IAV (PR8, MOI = 5), and anti-FLAG immunoprecipitates were examined for RIPK3, MLKL, and FLAG. Whole-cell extract (5% input) was examined in parallel for RIPK3, MLKL, FLAG, and IAV NS1 proteins. (F) Two tandem NLS or three tandem NES were introduced between the FLAG tag and the N terminus of WT ZBP1 (top left) to produce ZBP1-Nuc and ZBP1-Cyto, respectively. Stably reconstituting Zbp1−/− MEFs with FLAG-tagged ZBP1-Nuc or ZBP1-Cyto either localized ZBP1 to the nucleus or excluded it from the nucleus, respectively, in >90% of cells (bottom left). Expression levels of ZBP1 constructs were confirmed by immunoblotting (top right). Kinetics of IAV-induced death of Zbp1−/− MEFs stably expressing WT ZBP1, ZBP1-Nuc, or ZBP1-Cyto over a 24 h time course (PR8, MOI = 2). Nuclei are outlined with dashed white lines. Data are representative of at least three independent experiments. Error bars represent mean ± SD. Two-way ANOVA coupled with Tukey’s multiple comparisons test, **p < 0.005, ***p < 0.0005. Scale bars represent 10 μm [(B) and (D)] and 20 μm (F). See also Figure S4.
Figure 5.
Figure 5.. IAV Triggers MLKL-Dependent Nuclear Envelope Disruption and DNA Leakage
(A) WT MEFs infected with IAV (PR8, MOI = 2) were examined for nuclear envelope integrity using antibodies to lamin B1 and emerin at the indicated times p.i. Arrows point to envelope breaches (lamin B1/emerin staining) and nuclear DNA herniation and leakage (DAPI). Boxed areas from lamin B1 stained nuclei are magnified to show nuclear envelope disruption. (B) 3D reconstruction of IAV-infected nuclei showing DNA herniating from gaps in the nuclear envelope (upper panels). Arrows indicate areas of herniation. (C) Kinetics of nuclear envelope breakdown, DNA leakage, and cell death in IAV-infected WT MEFs. (PR8, MOI = 2). (D) Immunofluorescence imaging of MLKL at nuclear membranes following IAV infection. Multi-channel densitometry along the white line shows localization of MLKL (green) at the nuclear envelope. (E) Immortalized Mlkl−/− MEFs stably expressing 2xFv-tagged MLKL-Cyto or MLKL-Nuc constructs were examined for cell death at the indicated times post-activation. (F) Imaging shows aggregation of MLKL-Nuc (green), distortion of nuclear architecture (red), and leakage of DNA into the cytosol (blue) following activation of MLKL-Nuc. Arrows indicate DNA leakage. (G) Kinetics of nuclear envelope rupture, DNA leakage, and cell death after activation of MLKL-Nuc. (H) Venus-tagged MLKL-Nuc is seen in the cytoplasm and translocates to the plasma membrane by 6 h post-oligomerization. (I) Quantification of cells with cytoplasmic MLKL-Nuc at the indicated times post-oligomerization. (J) Immunoblot analysis of MLKL-Nuc, histone H3, and HMGB1 in nuclear and cytoplasmic fractions from MLKL-Nuc -expressing cells at the indicated times post-oligomerization. Nuclei are outlined with dashed white lines. Data are representative of at least three independent experiments. Error bars represent mean ± SD. Unpaired Student’s t test, **p < 0.005, ***p < 0.0005. Scale bars represent 5 μm ([A], [B], [D], and [F]) and 10 μm (H). See also Figure S5.
Figure 6.
Figure 6.. RIPK3-Mediated Apoptosis Signaling Is Not Required for IAV-Induced Nuclear Envelope Disruption
(A) Lamin B1 (red) or emerin (green) staining for nuclear envelope integrity of IAV infected WT or Zbp1−/− MEFs stably reconstituted with the indicated ZBP1 constructs at 12 h p.i. (B) Quantification of nuclear envelope damage in cells shown in (A). (C) Lamin B1 (red) or emerin (green) staining for nuclear envelope integrity of IAV-infected WT MEFs treated with zVAD (50 μM), RIPK3 inhibitor (RIPK3i, GSK′843, 5μM) or zVAD + RIPK3 inhibitor, and of IAV-infected Ripk3−/−, Mlkl−/−, Ripk1−/−, and Casp8DA MEFs, at 12 h p.i. (D) Quantification of nuclear envelope damage of cells shown in (C). Arrows show nuclear envelope breakdown in (A) and (C). PR8 was used at MOI = 2 and cells were fixed at 12 h p.i. for results shown in (A)–(D). (E) Staining for cleaved caspase 3 (CC3, green) shows activation of apoptosis upon IAV infection (PR8, MOI = 2) is primarily a cytoplasmic event. Line graph shows the kinetics of CC3 positivity, and bars show the localization of the CC3 signal. (F) Lamin B1 (red) or emerin (green) staining of the nuclear envelope in WT MEFs treated with TCZ, TRAIL (2 μg/mL) plus cycloheximide (250 ng/mL) (TRAIL+CHX) or infected with IAV (PR8, MOI = 2). Cell viability and the percentage of cells with ruptured nuclear envelopes and nuclear DNA leakage were measured at 12 h (TCZ and TRAIL) or 18 h (IAV) post treatment/infection, when cell death was equivalent between the three stimuli. Data are representative of at least three independent experiments. Error bars represent mean ± SD. Unpaired Student’s t test, *p < 0.05, **p < 0.005, ***p < 0.0005. Scale bars represent 5 μm ([A], [C], and [F]) and 10 mm (E). See also Figure S6.
Figure 7.
Figure 7.. MLKL Drives Pathogenic Neutrophil Recruitment and Lethality during Severe IAV Disease
(A) Survival analysis of age- and sex-matched WT (C57BL/6J) (n = 9), Zbp1−/− (n = 9), Ripk3−/− (n = 9), and Mlkl−/− (n = 8) mice infected with a modestly lethal (~LD20) dose of IAV (PR8, 2,500 EID50/mouse intranasally [i.n.]). (B) Survival analysis of age- and sex-matched WT (C57BL/6J) (n = 12), Zbp1−/− (n = 9), Ripk3−/− (n = 10), and Mlkl−/− (n = 11) mice infected with a lethal dose of IAV (PR8, 6000 EID50/mouse i.n.). (C) Virus titers from lungs of Mlkl+/+ and Mlkl−/− mice infected with PR8 determined by plaque assay (n = 11 mice/genotype) at 6 days p.i. (D) Percentage of IAV PB1, PA, NP peptide-stimulated poly-functional IFNγ+TNFα+ CD8+ T cells in BAL fluid from Mlkl+/+ (n = 5) and Mlkl−/− mice (n = 6) at 8 days p.i. (E) Quantification of epithelial cells with disrupted or ruptured nuclei in Mlkl+/+ and Mlkl−/− lungs on day 7 p.i. (PR8, 6000 EID50, i.n.). Morphology of representative nuclei is shown above the graph. Arrows indicate areas of nuclear DNA herniation in Mlkl+/+ epithelial cells. Nuclei are outlined with dashed white lines. (F) Quantification of cell death (blue) and nuclear envelope rupture (red) in Mlkl−/− MEFs stably expressing either MLKL-Cyto or MLKL-Nuc at the indicated times post-activation. (G) Quantification of NETs by staining for citrinullated histone H3 after stimulation of neutrophils with supernatants from MLKL-Cyto and MLKL-Nuc MEFs that were either exposed or not exposed to oligomerizer. (H and I) Protein levels of HMGB1 (H) and IL-33 (I) in supernatants of MLKL-Cyto and MLKL-Nuc MEFs after exposure to oligomerizer. (J) Immunofluorescence staining for neutrophils (MPO, green), NETs (citrinullated histone H3, red), and NP (white) in lung sections from IAV (PR8, 6,000 EID50)-infected mice at the indicated days p.i. shows influx of neutrophils is both delayed and significantly diminished in IAV-infected Mlkl−/− lungs, compared to Mlkl+/+ controls. (K and L) Quantification of neutrophil infiltration (K) and NET formation (L) in Mlkl+/+ and Mlkl−/− lungs on the indicated days p.i. (M) Supernatants for IAV-infected Mlkl+/+, but not from similarly infected Mlkl−/− MEFs, trigger NET formation in challenged neutrophils ex vivo. (N) Quantification of NETs after stimulation of neutrophils with supernatants from uninfected or from IAV-infected Mlkl+/+ and Mlkl−/− MEFs. IAV PR8 was used at MOI = 2 in M. Error bars represent mean ± SD. Log-rank (Mantel-Cox) test and unpaired Student’s t test, *p < 0.05, **p < 0.005. Scale bars represent 2 μm (E), 200 μm (J), and 50 μm (M). See also Figure S7.

References

    1. Athanasiadis A (2012). Zalpha-domains: at the intersection between RNA editing and innate immunity. Semin. Cell Dev. Biol 23, 275–280. - PubMed
    1. Balasubramaniyam T, Ishizuka T, Xiao CD, Bao HL, and Xu Y (2018). 2′-O-Methyl-8-methylguanosine as a Z-Form RNA Stabilizer for Structural and Functional Study of Z-RNA. Molecules 23, 2572. - PMC - PubMed
    1. Brandes M, Klauschen F, Kuchen S, and Germain RN (2013). A systems analysis identifies a feedforward inflammatory circuit leading to lethal influenza infection. Cell 154, 197–212. - PMC - PubMed
    1. Brown BA 2nd, Lowenhaupt K, Wilbert CM, Hanlon EB, and Rich A (2000). The zalpha domain of the editing enzyme dsRNA adenosine deaminase binds left-handed Z-RNA as well as Z-DNA. Proc. Natl. Acad. Sci. USA 97, 13532–13536. - PMC - PubMed
    1. Camp JV, and Jonsson CB (2017). A Role for Neutrophils in Viral Respiratory Disease. Front. Immunol 8, 550. - PMC - PubMed

Publication types

MeSH terms