. 2020 Jul:111:102441.
doi: 10.1016/j.jaut.2020.102441. Epub 2020 Mar 20.

TIGIT+ A2Ar-Dependent anti-uveitic Treg cells are a novel subset of Tregs associated with resolution of autoimmune uveitis

Affiliations

TIGIT+ A2Ar-Dependent anti-uveitic Treg cells are a novel subset of Tregs associated with resolution of autoimmune uveitis

Fauziyya Muhammad et al. J Autoimmun. 2020 Jul.

Abstract

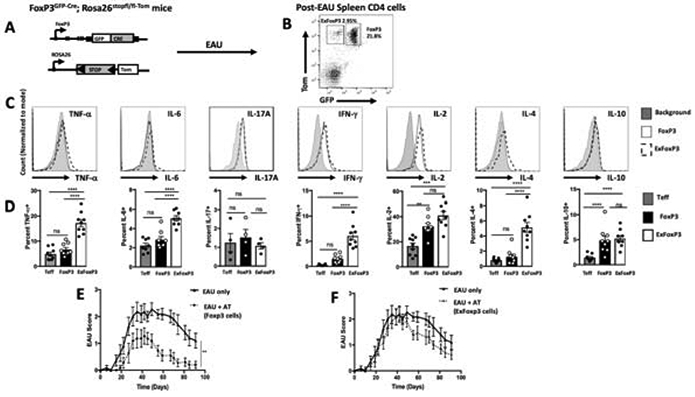
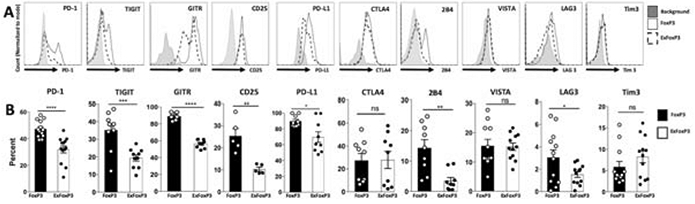
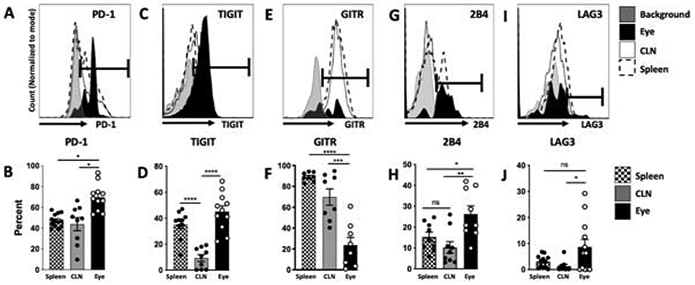
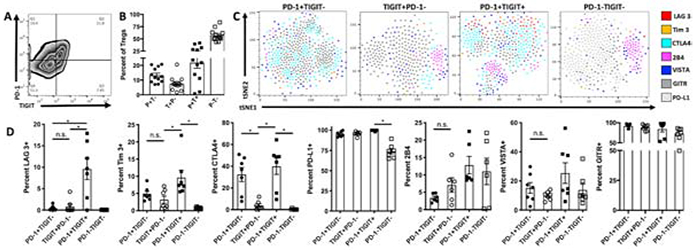
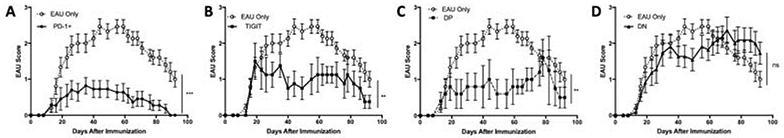
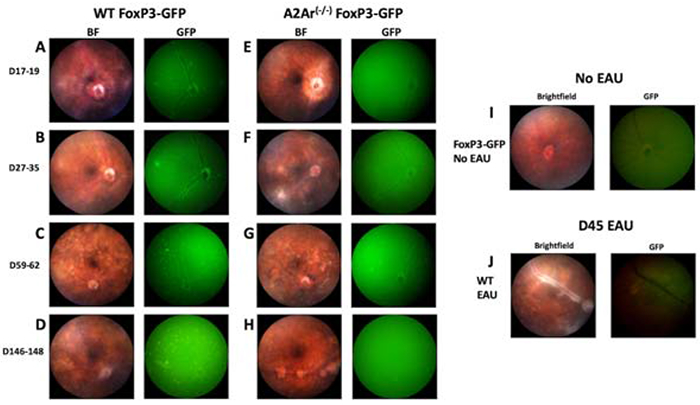
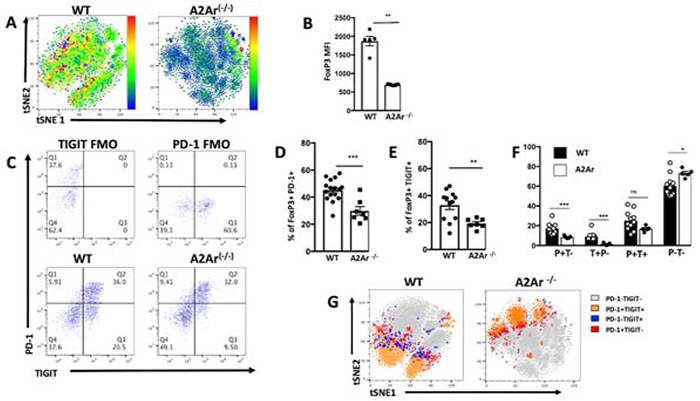
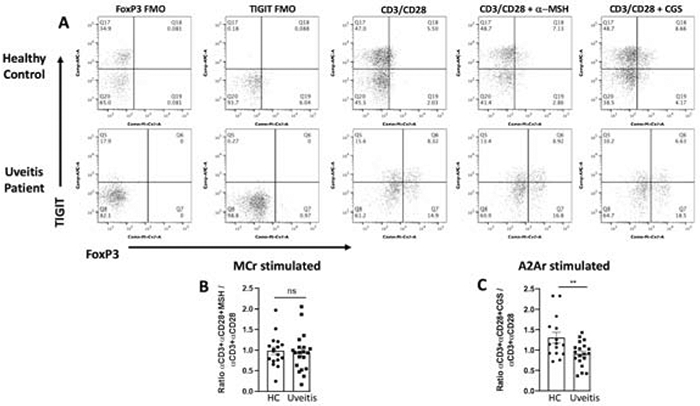
Regulatory T cells (Tregs) are necessary to prevent autoimmune disease. As such, stable FoxP3 expression is required for the proper function of Tregs in the control of autoimmune disease. Different Treg subsets that utilize different mechanisms of suppression have been identified. The T-cell immunoglobulin immunoreceptor tyrosine-based inhibitory motif (TIGIT) is a relatively new Treg cell marker that has a suppressive function. We have previously identified the adenosine 2A receptor (A2Ar) as a requirement for the emergence of Tregs following resolution of autoimmune disease. Using a FoxP3-GFP-Cre reporter mouse, we identify FoxP3 and 'exFoxP3' cells, show FoxP3 and not exFoxP3 cells are suppressive. We further show FoxP3 cells express TIGIT, and are induced through A2Ar in healthy volunteers, but not patients with autoimmune disease. Furthermore, we show Tregs emerge in the target tissue at the onset of autoimmune disease in an A2Ar-dependent manner. In summary, we identify a novel subset of TIGIT+ Tregs that are induced through stimulation of the A2Ar.

Keywords: A2Ar; Experimental autoimmune uveitis; TIGIT; Tregs.


Conflict of interest statement

Declaration of competing interest None. Statement: All authors concur with the submission and all the material submitted in this manuscript has not been previously reported and is not under consideration for publication elsewhere.

Figures

Figure 1.
Figure 1.. Post-EAU exFoxP3 cells fail to suppress uveitis.
Schematic representation of the lineage tracing reporter mice, FoxP3GFP-Cre; Rosa26stopfl/fl-tdTomato (A). Post-EAU splenocytes from FoxP3GFP-Cre; Rosa26stopfl/fl-tdTomato mice were reactivated with IRBP (1-20) in vitro for 48 hours then stained with anti-CD4 antibody and analyzed by flow cytometry for CD4, GFP, and Tomato. Representative flow plot of 6 independent experiments, with 2-5 mice per experiment (n=16) is shown GFPTom+ (exFoxP3) cells, GFP+Tom+ (FoxP3 cells) (B). Splenocytes were activated with PMA/Ionomycin and cytokine secretion was blocked with monensin for 4-5 hrs. Cells were fixed and stained for TNF-α, IL-6, IL-17A, IFN-γ, IL-2, IL-4, and IL-10 and analyzed by flow cytometry. Representative histograms of the intracellular cytokines of cells gated on exFoxP3 (dashed line), FoxP3+ (black line), or background (light gray) are shown (C). Summary data show the mean ± SEM of frequencies with T effector cells as CD4+ (GFPTom) of cytokines from 2 independent experiments with 2-5 mice per experiment (D). Post-EAU splenocytes were sorted into FoxP3 and exFoxP3 groups following reactivation with IRBPp (1-20) and transferred to recipient mice immunized for EAU. Clinical EAU scores obtained from fundus exams of EAU mice are shown. Average scores per group over time for non-recipient control mice (EAU only, n=11) are compared with scores of FoxP3-recipient mice (n=11) (E) or exFoxP3-recipient (n=13) mice (F). The graphs show the mean ± SEM scores on the indicated day per group. Results are from 3 independent experiments with 3-5 mice in each group per experiment, where each symbol on the bar graph represents one mouse. Cytokine results were analyzed with one-way ANOVA **p<0.01, ***p<0.001, ****p<0.0001, ns not significant. EAU results were analyzed with two-way ANOVA with Bonferroni post-test, **p<0.005 n.s. not significant.
Figure 2.
Figure 2.. Post-EAU exFoxP3 cells lack a Treg phenotype.
Post-EAU splenocytes from lineage tracing reporter mice were reactivated with IRBPp (1-20) in vitro for 48 hrs. The reactivated cells were stained and analyzed by flow cytometry for various Treg markers. Representative flow plots of PD-1, TIGIT, GITR, CD25, PD-L1, 2B4, VISTA, LAG3, and Tim3 expression on CD4+ GFP+Tom+ (FoxP3 cells, solid line) or CD4+GFPTom+ (exFoxP3 cells, dashed line), or background (gray) are shown (A). The mean ± SEM of the frequencies of the Treg markers from 3-6 independent experiments, with 2-5 mice per experiment are shown, where each symbol on the bar graph represents one mouse (B). Summary data were analyzed with unpaired t-test or Mann-Whitney test, * p<0.05, **p<0.01, ***p<0.001, ****p<0.0001, n.s. not significant.
Figure 3.
Figure 3.. TIGIT, PD-1, LAG 3, and 2B4 are expressed on ocular post-EAU Treg cells.
Post-EAU lymphocytes from the spleen, cervical lymph node (CLN), and the eyes were reactivated with IRBPp (1-20) for 48 hrs and analyzed with flow cytometry. The expression of PD-1, TIGIT, GITR, 2B4, and LAG3 is shown in representative histograms of CD4+GFP+Tom+ gated cells from the eye, CLN or spleen (A). Bar graphs show the mean ± SEM of the percentages of the indicated marker from the eye, CLN or spleen for all experiments (B). Data shown is from 3-4 independent experiments with 2-5 mice per experiment, where each symbol on the bar graph represents one mouse. Summary data were analyzed by one-way ANOVA, with Tukey multiple-comparison test, * p<0.05, **p<0.01, ***p<0.001, ****p<0.0001, n.s. not significant.
Figure 4.
Figure 4.. TIGIT and PD-1 expression define distinct post-EAU Treg subsets.
Splenic post-EAU Treg cells were reactivated with IRBPp (1-20), stained for CD4, PD-1, TIGIT, GITR, CD25, PD-L1, 2B4, VISTA, LAG3, and Tim3, and analyzed by flow cytometry. Subsets based on TIGIT and PD-1 expression were analyzed for differences in expression of additional Treg markers. Representative flow plot of TIGIT and PD-1 expression on CD4+FoxP3+ gated cells from the eye is shown (A). The mean ± SEM of the percentages for all experiments of the TIGIT and PD-1 post-EAU Treg subsets are shown (B). Each of the PD-1 and TIGIT Treg subsets were clustered using tSNE (FlowJo) based on the distribution and expression of LAG3, Tim3, CTLA4, 2B4, VISTA, GITR, and PD-L1 markers with each Treg marker color-coded to show the cells that express the indicated marker within the tSNE plot (C). The mean ± SEM of the percentage of LAG3, Tim3, CTLA4, 2B4, VISTA, GITR, and PD-L1 are shown for each PD-1 and TIGIT defined subsets for all experiments (D). The results are representative plots or summary data of 3-4 experiments with 2-4 mice per experiment, where each symbol on the bar graph represents one mouse. Summary data were analyzed by one-way ANOVA, with Tukey multiple-comparison test, * p<0.05, n.s. not significant.
Figure 5.
Figure 5.. TIGIT and PD-1 expression on post-EAU Treg cells defines functional Treg subsets.
Splenocytes from post-EAU mice were reactivated with IRBP (1-20) in vitro for 48hrs. Total CD4+CD25+ Tregs were FACS sorted based on PD-1 and/or TIGIT expression. Different PD-1 or TIGIT Treg subsets were transferred into recipient EAU mice. The graphs show the clinical EAU scores obtained from fundus exams of recipient EAU mice that received the following post-EAU T cell subsets, PD-1+TIGIT (n=11) (A), PD-1TIGIT+ (n=8) (B), PD-1+TIGIT+ (n=5) (C), and PD-1TIGIT (n=11) (D). Average EAU scores of the non-recipient control mice (dashed line, EAU only, n=15) and recipient mice (solid line) over the course of the disease are shown. The data illustrate the mean ± SEM scores on the indicated day per group. Data are from 4 independent experiments with 1-4 mice in each group per experiment. Data were analyzed with 2-way ANOVA with Bonferroni post-test, **p<0.005 ***p<0.001 ns not significant.
Figure 6.
Figure 6.. A2Ar is necessary for the emergence of Tregs in the eyes during EAU.
WT FoxP3-GFP and A2Ar(−/−) FoxP3-GFP mice were immunized for EAU and retinal images were obtained with the Micron IV microscope during the disease course. Fundoscopic images were taken with the brightfield (BF) or the green fluorescence (GFP) illumination at the specified days post-immunization. Representative retinal images of EAU WT FoxP3-GFP (n=25) and A2Ar(−/−) FoxP3-GFP (n=9) at disease onset (A, E), disease peak (B, F), chronic phase (C, G), and post-EAU (D, H). The images are representative of 3-10 experiments with 2-3 mice per experiment. Retinal images of unimmunized (naïve) WTFoxP3-GFP under the BF and GFP channels are displayed (I). Fundoscopic images of non-GFP WT mice at disease peak are shown (J).
Figure 7.
Figure 7.. A2AR expression is required for the emergence of TIGIT+ Treg cells in EAU model.
Post-EAU splenocytes from WT FoxP3-GFP or A2Ar(−/−) FoxP3-GFP mice were reactivated with IRBPp (1-20) for 48 hours and analyzed by flow cytometry. The tSNE plots of post-EAU CD4+GFP+ Treg cells from WTFoxP3-GFP or A2Ar(−/−) FoxP3-GFP mice were clustered based on the distribution and expression of FoxP3 protein are displayed in the representative Heatmaps (A). The mean ± SEM of FoxP3 expression (MFI) is shown in the summary data (B). Representative flow plots of TIGIT and PD-1 expression on post-EAU FoxP3+gated cells of WT and A2Ar(−/−) mice are shown with fluorescence minus one controls (FMO) (C). The mean ± SEM of the percentages of FoxP3+PD-1+ (D) or FoxP3+TIGIT+ (E) of WT or A2Ar(−/−) post-EAU CD4+ cells are shown. The mean ± SEM of the percentages of the TIGIT and PD-1 WT or A2Ar(−/−) post-EAU Treg subsets are shown in the bar graphs of the summary data (F). The gated CD4+GFP+ cells of WT FoxP3-GFP or A2Ar(−/−) FoxP3-GFP post-EAU splenocytes were clustered using tSNE based on the distribution and expression of PD-1 and TIGIT subsets are shown in the color-coded tSNE plots (G). Shown are 2-4 experiments, with 2-5 mice per experiment. Data were analyzed with one-way ANOVA with Tukey multiple-comparison test, * p<0.05, **p<0.01, ***p<0.001, ns not significant.
Figure 8.
Figure 8.. TIGIT+ Treg cells are not induced by A2Ar stimulation fails in uveitis patients.
PBMCs from uveitis patients (n = 19) or healthy donors (n = 15-17) were activated with α-CD3/α-CD28 antibodies and treated with or without A2Ar agonist (CGS21680) or MC5r agonist (α-MSH) for 48 hrs. The cells were stained and analyzed by flow cytometry. Representative flow cytometry plots gated on CD4+CD25+ cells show TIGIT and FoxP3 expression, fluorescence minus one (FMO) controls are shown for healthy and uveitis patient (A). Summary data show the ratio of treated over untreated for healthy donor (HC) and patients (uveitis) following α-MSH treatment (B) or CGS21680 treatment (C). The results show the mean ± SEM of all subjects included in this study. Data were analyzed with unpaired student t-test **p<0.01, ns not significant.

Similar articles

Cited by

References

    1. Dominguez-Villar M, Hafler DA. Regulatory T cells in autoimmune disease. Nat Immunol, 2018;19:665–73. - PMC - PubMed
    1. Wing JB, Tanaka A, Sakaguchi S. Human FOXP3(+) Regulatory T Cell Heterogeneity and Function in Autoimmunity and Cancer. Immunity, 2019;50:302–16. - PubMed
    1. Godfrey VL, Wilkinson JE, Rinchik EM, Russell LB. Fatal lymphoreticular disease in the scurfy (sf) mouse requires T cells that mature in a sf thymic environment: potential model for thymic education. Proc Natl Acad Sci U S A, 1991;88:5528–32. - PMC - PubMed
    1. Godfrey VL, Wilkinson JE, Russell LB. X-linked lymphoreticular disease in the scurfy (sf) mutant mouse. Am J Pathol, 1991;138:1379–87. - PMC - PubMed
    1. DuPage M, Bluestone JA. Harnessing the plasticity of CD4(+) T cells to treat immune-mediated disease. Nat Rev Immunol, 2016;16:149–63. - PubMed

Publication types

Substances