Review
. 2020 Jun:210:107525.
doi: 10.1016/j.pharmthera.2020.107525. Epub 2020 Mar 20.

Role of the ERO1-PDI interaction in oxidative protein folding and disease

Affiliations
Review

Role of the ERO1-PDI interaction in oxidative protein folding and disease

Andrea G Shergalis et al. Pharmacol Ther. 2020 Jun.

Abstract

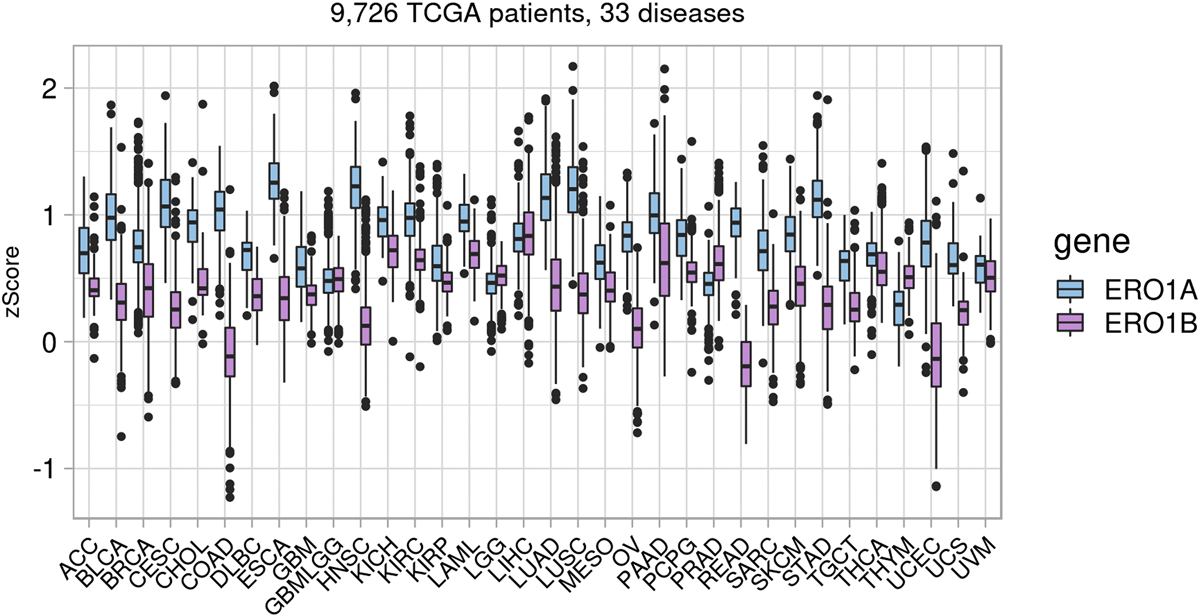
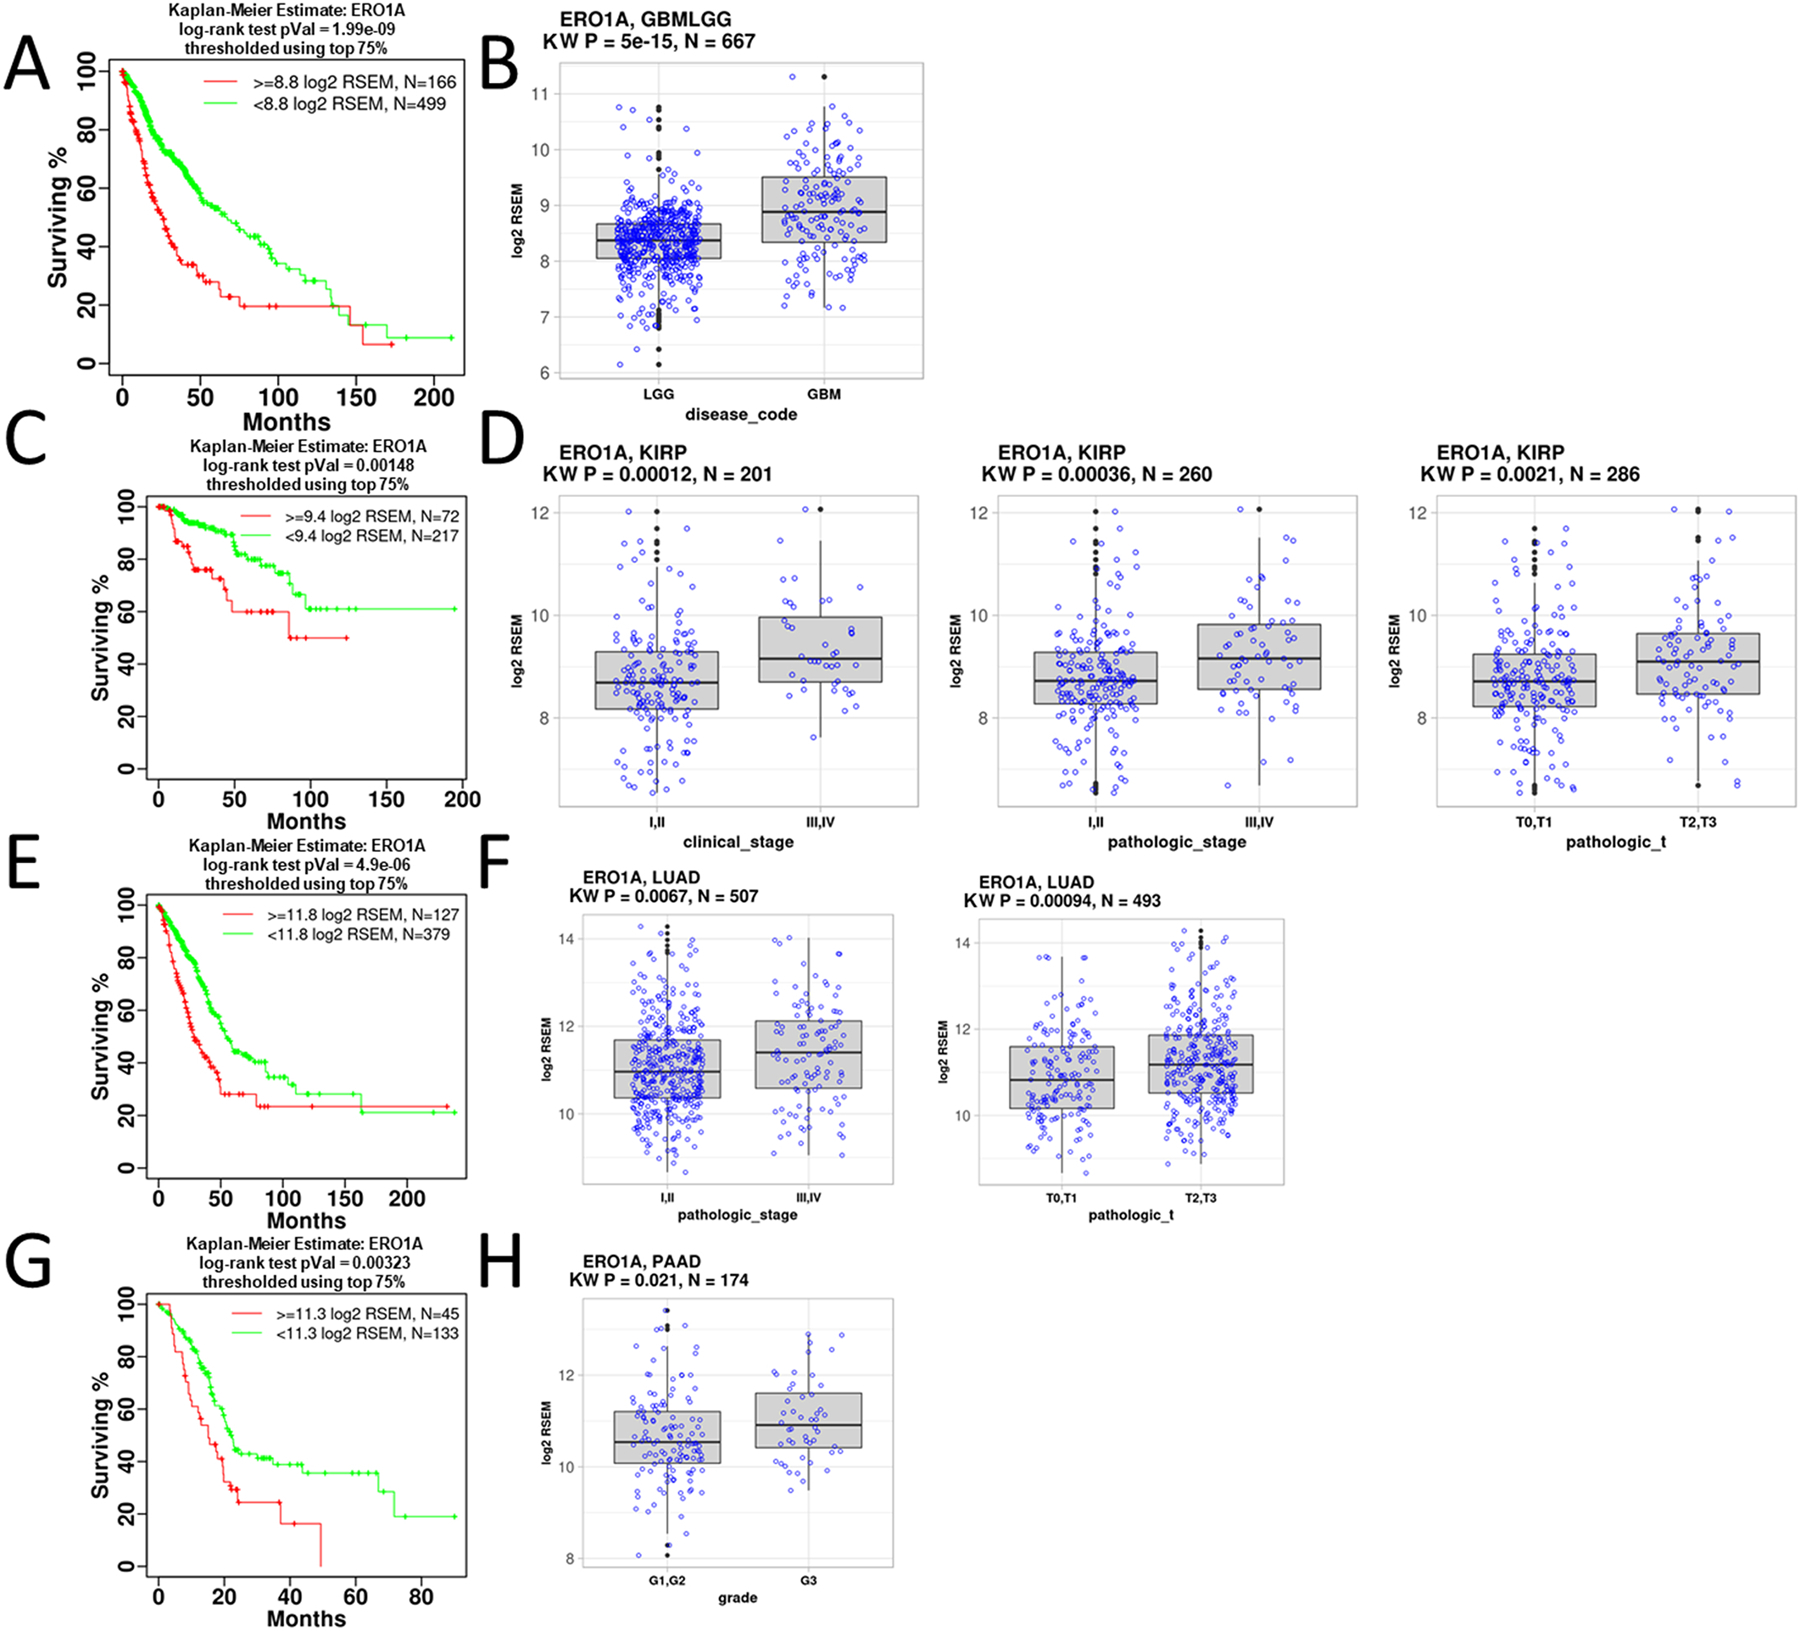
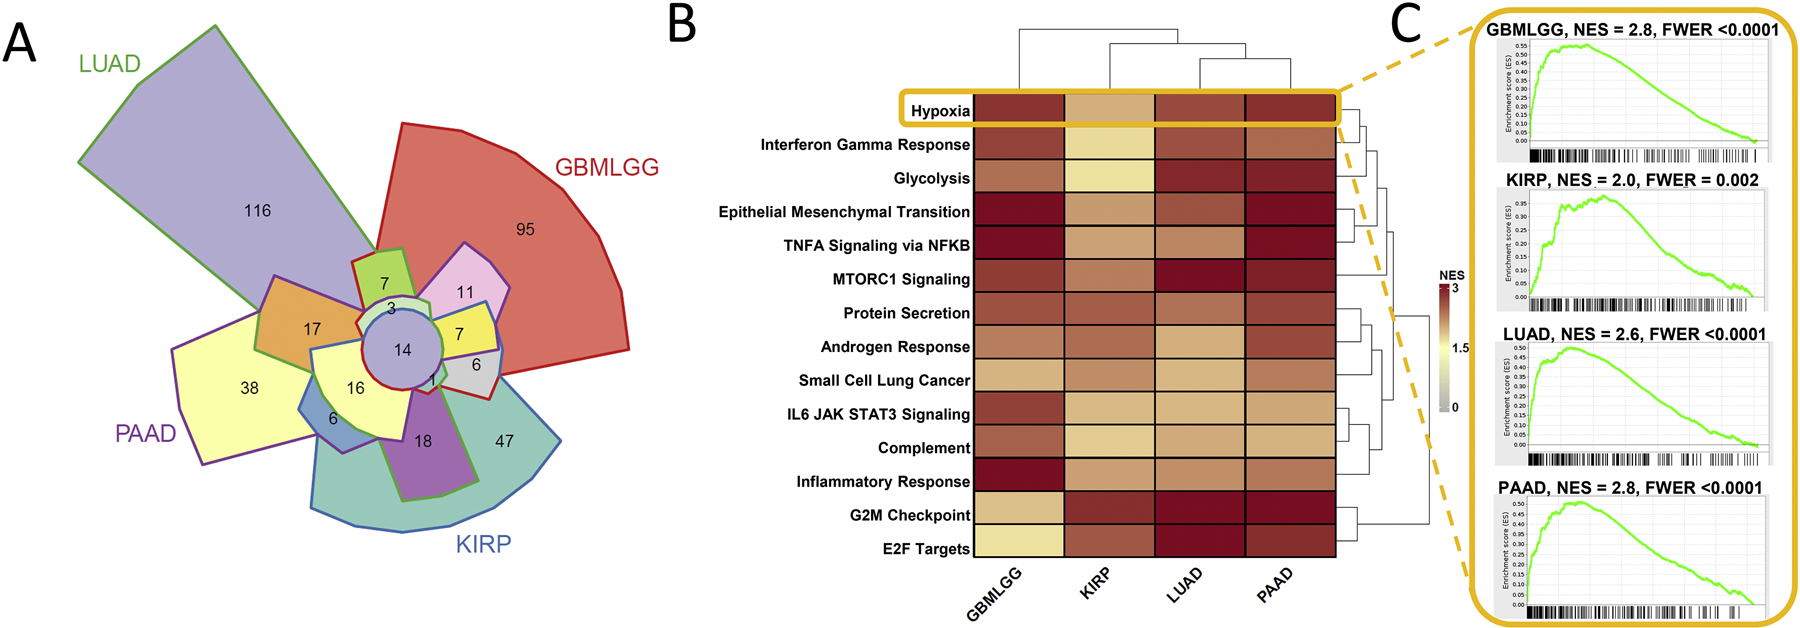
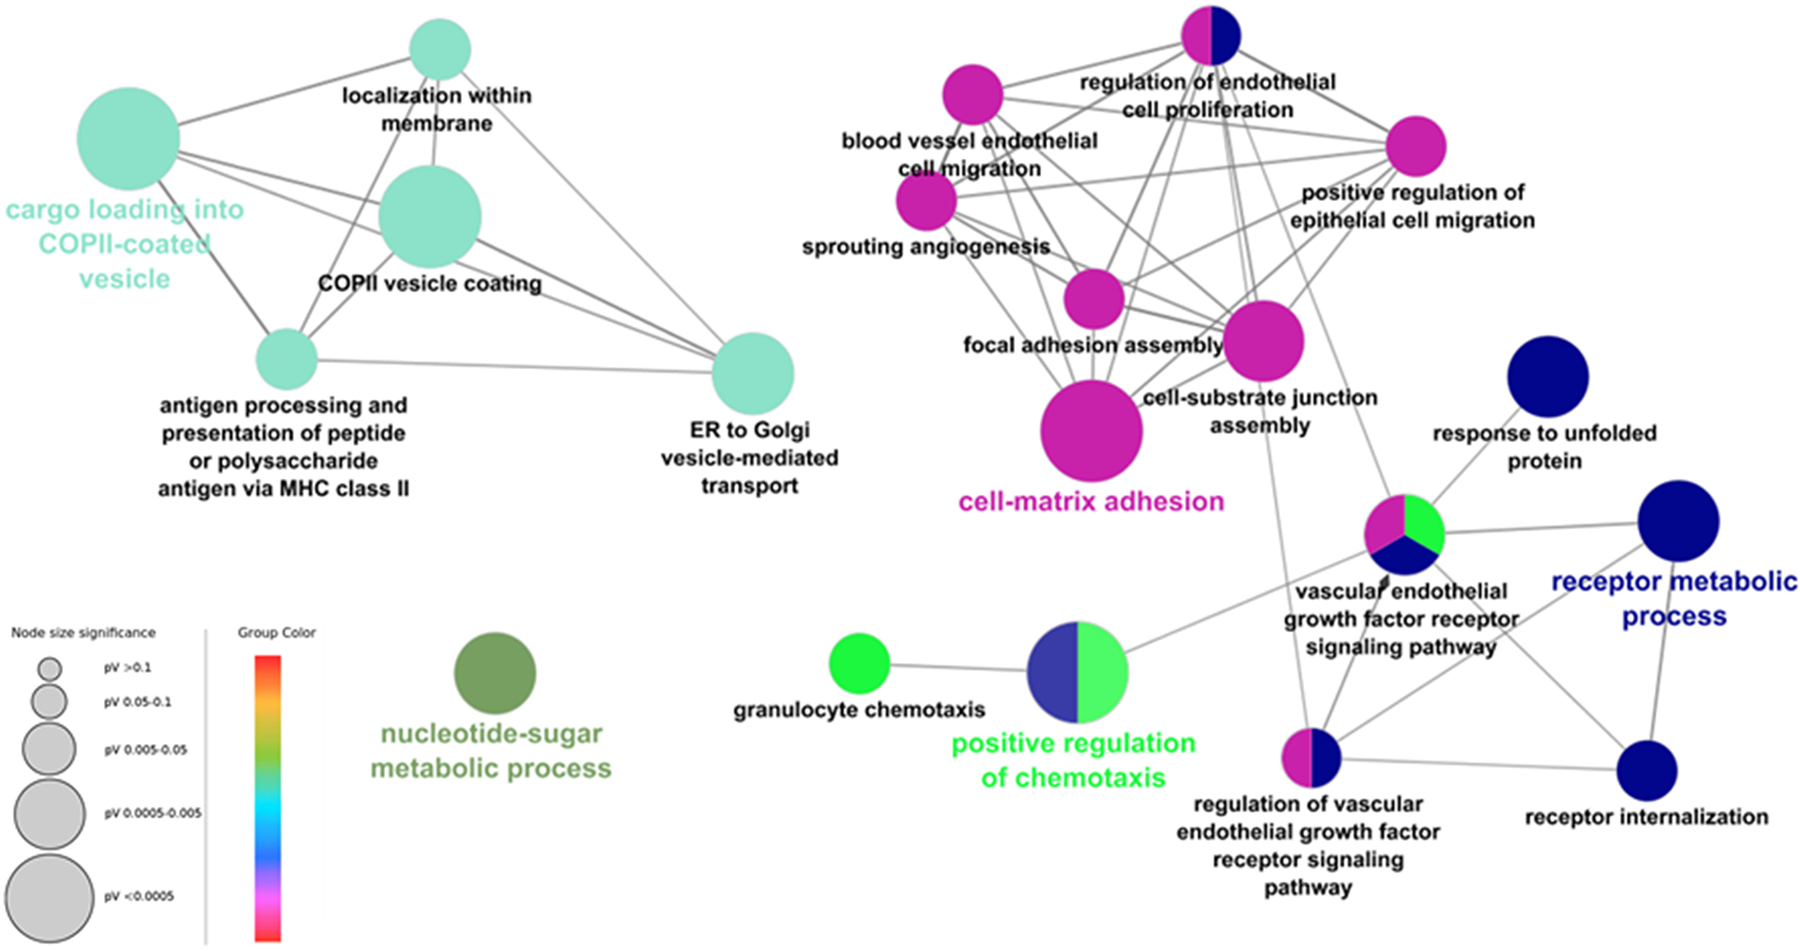
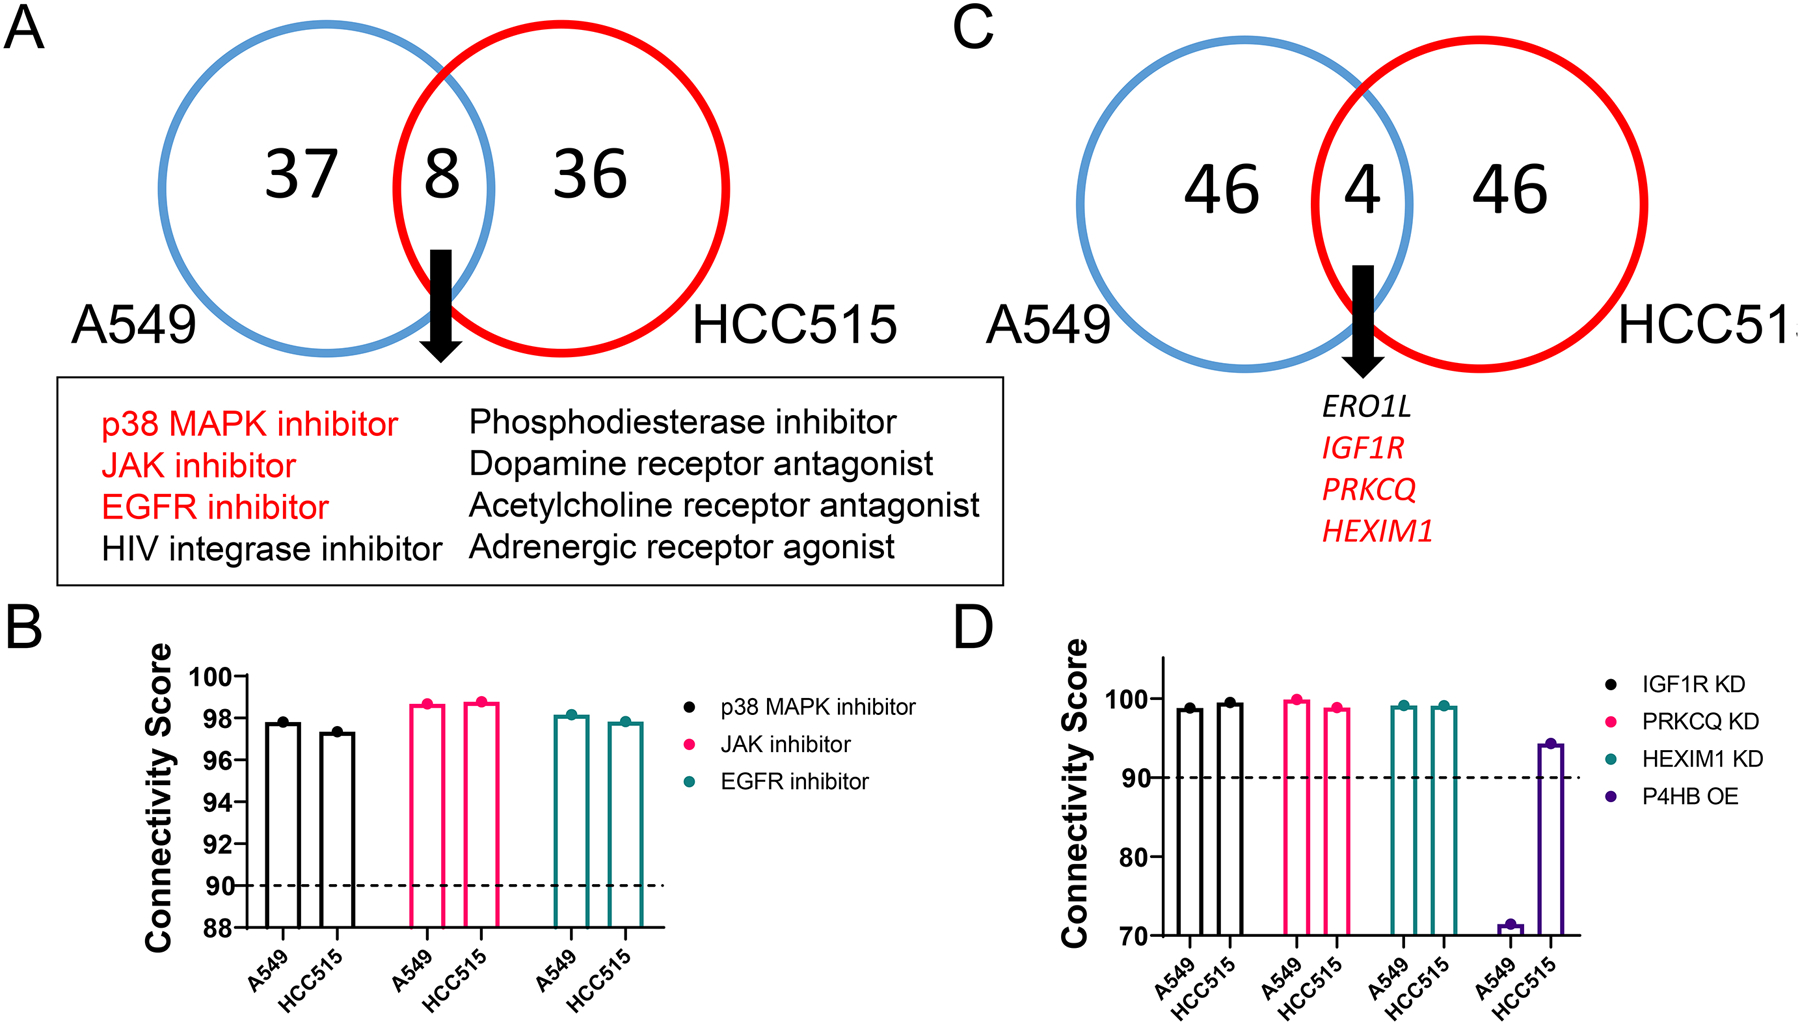
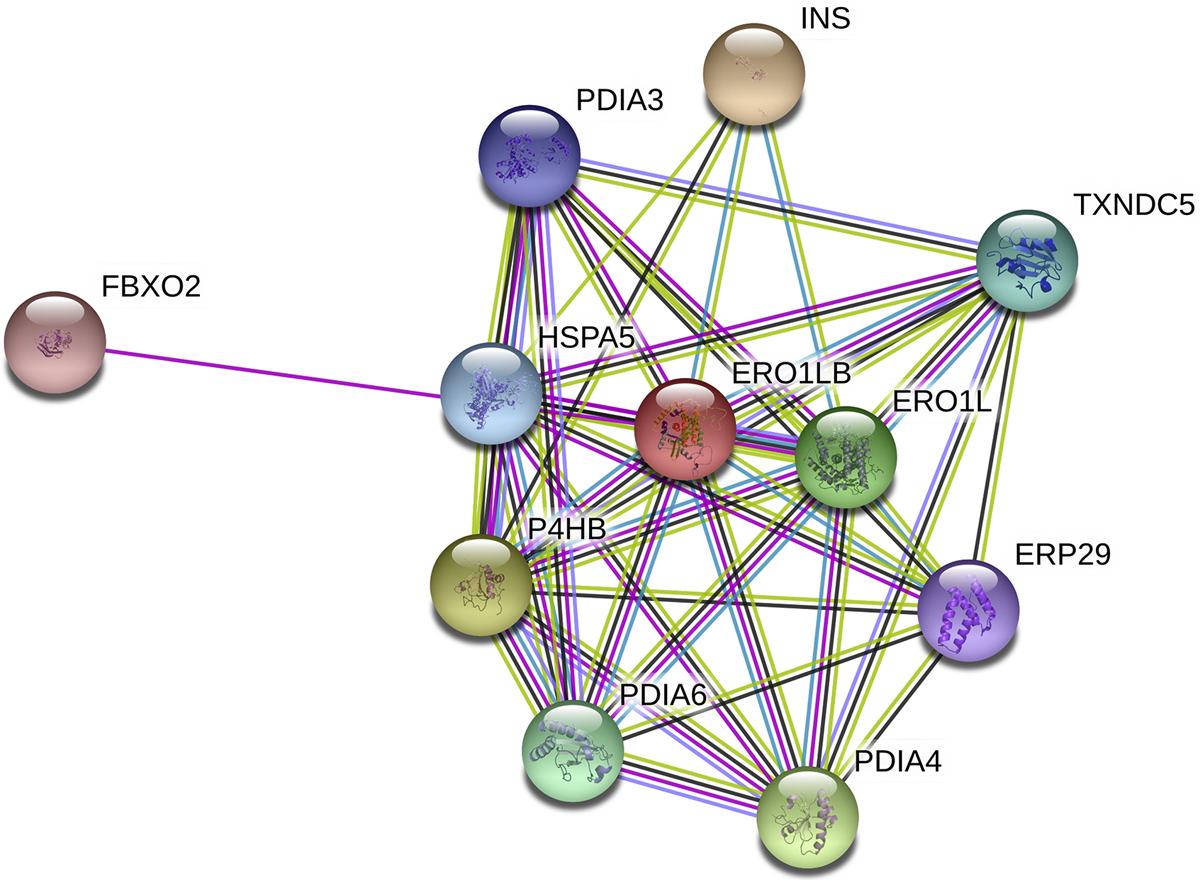
Protein folding in the endoplasmic reticulum is an oxidative process that relies on protein disulfide isomerase (PDI) and endoplasmic reticulum oxidase 1 (ERO1). Over 30% of proteins require the chaperone PDI to promote disulfide bond formation. PDI oxidizes cysteines in nascent polypeptides to form disulfide bonds and can also reduce and isomerize disulfide bonds. ERO1 recycles reduced PDI family member PDIA1 using a FAD cofactor to transfer electrons to oxygen. ERO1 dysfunction critically affects several diseases states. Both ERO1 and PDIA1 are overexpressed in cancers and implicated in diabetes and neurodegenerative diseases. Cancer-associated ERO1 promotes cell migration and invasion. Furthermore, the ERO1-PDIA1 interaction is critical for epithelial-to-mesenchymal transition. Co-expression analysis of ERO1A gene expression in cancer patients demonstrated that ERO1A is significantly upregulated in lung adenocarcinoma (LUAD), glioblastoma and low-grade glioma (GBMLGG), pancreatic ductal adenocarcinoma (PAAD), and kidney renal papillary cell carcinoma (KIRP) cancers. ERO1Α knockdown gene signature correlates with knockdown of cancer signaling proteins including IGF1R, supporting the search for novel, selective ERO1 inhibitors for the treatment of cancer. In this review, we explore the functions of ERO1 and PDI to support inhibition of this interaction in cancer and other diseases.

Keywords: Cancer; Endoplasmic reticulum Oxidase; Gene expression; Protein disulfide Isomerase; Protein folding; Targeted therapy.


Conflict of interest statement

Declaration of Competing Interest The authors declare that there are no conflicts of interest.

Figures

Fig. 1.
Fig. 1.
General ROS production in the cell cytoplasm, mitochondria and ER. The various types of ROS are generated based on cell requirements and extracellular stimuli. Mitochondria and ER are the two major organelles that control ROS signaling.
Fig. 2.
Fig. 2.
The ER (pink) is an oxidizing environment, maintained by redox sensor glutathione (GSH/GSSG), with a reduction potential much larger than that of the cytoplasm (ER ε: −170 to − 185 mV; cytoplasm ε: −280 to −320 mV). The oxidizing environment promotes nascent protein folding and disulfide bond formation. ERO1 is a key mediator of disulfide bond formation in the ER. Disturbed protein folding may cause ER stress and increased ER ROS production, further affecting the mitochondrial and cellular metabolism. Reduced polypeptides are oxidized by PDI, which transfers its electrons to ERO1. ERO1 is reoxidized by oxygen and produces H2O2. H2O2 is reduced through various mechanisms in the ER including catalase, glutathione peroxidases (GPX7 and GPX8), peroxiredoxin 4 (PRX4), and ascorbate peroxidase (APX). Background image created in Blender 2.79.
Fig. 3.
Fig. 3.
Structures of ERO1 and PDI. A) Hyperactive ERO1α (3AHQ) (Inaba, et al., 2010), with FAD moiety represented as a stick model. Blue spheres represent active site cysteines. Black, dark gray and light gray spheres indicate structural disulfides. B) A schematic of the disulfide bonds of ERO1α, ERO1β, and ERO1p (blue line - active site disulfides, pale orange line - flexible loop shuttle disulfides, black line - structural disulfides, dashed red line - regulatory cysteines (inactive ERO1), green line - auxiliary regulatory disulfides). ERO1p is a Saccharomyces cerevisiae homolog. C) Reduced PDI (4EKZ) is predicted to bind ERO1α via the substrate-binding pocket in the b’ domain (circled in magenta). Active site cysteines are depicted in yellow.
Fig. 4.
Fig. 4.
ER stress upregulates ERO1 via CHOP expression. ER stress and the unfolded protein response activate membrane-bound PERK. PERK phosphorylates eukaryotic initiation factor 2α (eIF2α), which leads to induction of CHOP. CHOP expression promotes ER stress by inducing ERO1 and GADD34. ERO1α expression increases ROS levels in the ER, leading to hyperoxidation and an increase in misfolded proteins. Additionally, CHOP downregulates Bcl-2 to promote apoptosis.
Fig. 5.
Fig. 5.
Pan-disease mRNA expression of ERO1A and ERO1B across 33 TCGA diseases. Z-scores were calculated per patient per disease. The majority of patients across all diseases show higher than average expression (z-score = 0) of ERO1A. Adrenocortical carcinoma (ACC), bladder urothelial carcinoma (BLCA), breast invasive carcinoma cohort (BRCA), cervical squamous cell carcinoma and endocervical adenocarcinoma (CESC), cholangiocarcinoma (CHOL), colon adenocarcinoma (COAD), lymphoid neoplasm diffuse large B-cell lymphoma (DLBC), esophageal carcinoma (ESCA), glioblastoma multiforme (GBM), head and neck squamous cell carcinoma (HNSC), kidney chromophobe (KICH), kidney renal clear cell carcinoma (KIRC), kidney renal papillary cell carcinoma (KIRP), acute myeloid leukemia (LAML), brain low-grade glioma (LGG), liver hepatocellular carcinoma (LIHC), lung adenocarcinoma (LUAD), lung squamous cell carcinoma (LUSC), mesothelioma (MESO), ovarian serous cystadenocarcinoma (OV), pancreatic adenocarcinoma (PAAD), pheochromocytoma and paraganglioma (PCPG), prostate adenocarcinoma (PRAD), rectum adenocarcinoma (READ), sarcoma (SARC), skin cutaneous melanoma (SKCM), stomach adenocarcinoma (STAD), testicular germ cell tumors (TGCT), thyroid carcinoma (THCA), thymoma (THYM), uterine corpus endometrial carcinoma (UCEC), uterine carcinosarcoma (UCS), uveal melanoma (UVM).
Fig. 6.
Fig. 6.
Analysis of ERO1α in cancer. A) Significant reduction in survival is observed for patients with high expression of ERO1α in glioma. B) ERO1A mRNA expression is significantly higher in more aggressive GBM gliomas than LGG. C) Significant reduction in survival is observed for patients with high ERO1A expression in KIRP. D) ERO1A mRNA expression is significantly higher in higher stages of KIRP. E) Significant reduction in survival is observed for patients with high ERO1A expression in LUAD. F) ERO1A mRNA expression is significantly higher in higher stages of LUAD. G) Significant reduction in survival is observed for patients with high ERO1A expression of in PAAD. H) ERO1A mRNA expression is significantly higher in increasing grades of PAAD. Kruskal-Wallis (KW) and survival analysis statistics were calculated using the R statistical programming language (Gravendeel, et al., 2009; Madhavan, et al., 2009).
Fig. 7.
Fig. 7.
Common gene sets enriched for genes that are co-expressed with ERO1A. A) Gene set enrichment analysis (GSEA) was used to identify enriched pathways with genes that are co-expressed with ERO1A. A Chow-Ruskey diagram shows overlap of significant gene sets correlated with ERO1A expression within LUAD, GBMLGG, PAAD, and KIRP TCGA diseases. Fourteen gene sets commonly enriched among the four diseases are shown in the heatmap. B) GSEA was used to identify enriched pathways with genes that are correlated with ERO1α. Heatmap coloring indicates normalized enrichment score (NES). C) GSEA running sum statistic visualizations are shown for the Hallmark gene set, Hypoxia, that was significantly enriched in GBMLGG, KIRP, LUAD, and PAAD TCGA diseases. All common gene sets were Hallmark except for the KEGG “Small Cell Lung Cancer” gene set. GSEAv2.2.3 was used with v6 gene sets sourced from MSigDB. 10,000 gene set permutations were performed using weighted mode scoring and Pearson metric (Subramanian, et al., 2005). Only genes with evidence of expression in > 50 % of a disease patient population were considered.
Fig. 8.
Fig. 8.
A) Chow-Ruskey diagram shows overlap of the top 100 genes correlated with ERO1A expression within GBMLGG, KIRP, PAAD, and LUAD TCGA diseases. B) P4HA1 was one of the top co-expressed genes in common across GBMLGG, KIRP, PAAD, and LUAD. Gene log2RSEM expression values are shown in scatter plots.
Fig. 9.
Fig. 9.
GO pathways associated with top 100 genes correlated with ERO1 expression in TCGA glioma generated by ClueGO. Terms with Bonferroni corrected p values < 0.05 are shown.
Fig. 10.
Fig. 10.
Highly connected CMap perturbagens reveal potential genes and signaling pathways with which ERO1α is involved in A549 and HCC515 cell lines. A) Eight classes of compounds are shared between A549 and HCC515 cell lines among the top 50 positively connected compound perturbagens. B) Select compound perturbagens with high connectivity score (≥ +90) in two lung cancer cell lines. C) Four gene KD perturbagens are shared between two cell lines among the top 50 positively connected hits. D) Select gene KD profiles with high connectivity score (≥ +90) in two lung cancer cell lines. P4HB overexpression is included since it is positively correlated with ERO1A knockdown in the HCC515 cell line.
Fig. 11.
Fig. 11.
STRING analysis of protein interactions with ERO1L. ERO1LB, ERO1-like protein beta; ERP29, endoplasmic reticulum resident protein 29; FBXO2, F-box only protein 2; HSPA5, 78 kDa glucose-regulated protein; INS, insulin; P4HB, protein disulfide isomerase A1; PDIA3, protein disulfide isomerase A3; PDIA4, protein disulfide isomerase A4; PDIA6, protein disulfide isomerase A6; TXNDC5, thioredoxin domain-containing protein 5.
Fig. 12.
Fig. 12.
Reported ERO1 inhibitors

Similar articles

Cited by

References

    1. Anelli T, Alessio M, Mezghrani A, Simmen T, Talamo F, Bachi A, & Sitia R (2002). ERp44, a novel endoplasmic reticulum folding assistant of the thioredoxin family. EMBO Journal, 21, 835–844. - PMC - PubMed
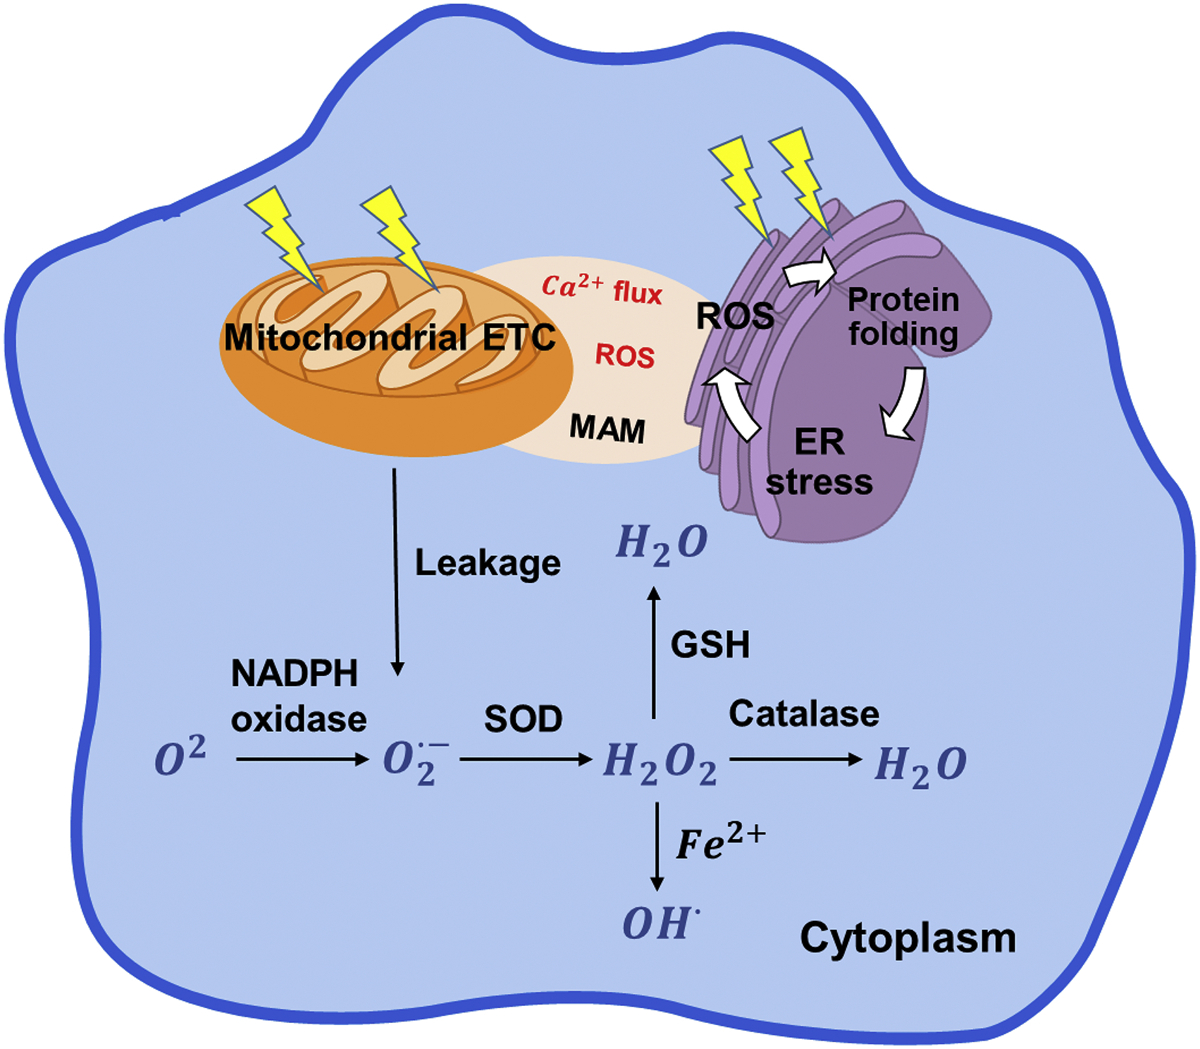
    1. Anelli T, Bergamelli L, Margittai E, Rimessi A, Fagioli C, Malgaroli A, … Sitia R (2012). Ero1α regulates Ca2 fluxes at the endoplasmic reticulum–mitochondria interface (MAM). Antioxidants & Redox Signaling, 16, 1077–1087. - PubMed
    1. Appenzeller-Herzog C, Riemer J, Christensen B, Sørensen ES, & Ellgaard L (2008). A novel disulphide switch mechanism in Ero1alpha balances ER oxidation in human cells. EMBO Journal, 27, 2977–2987. - PMC - PubMed
    1. Appenzeller-Herzog C, Riemer J, Zito E, Chin K-T, Ron D, Spiess M, & Ellgaard L (2010). Disulphide production by Ero1α–PDI relay is rapid and effectively regulated. EMBO Journal, 29, 3318–3329. - PMC - PubMed
    1. Araki K, Iemura S-I, Kamiya Y, Ron D, Kato K, Natsume T, & Nagata K (2013). Ero1- α and PDIs constitute a hierarchical electron transfer network of endoplasmic reticulum oxidoreductases. Journal of Cell Biology, 202, 861–874. - PMC - PubMed

Publication types

MeSH terms