

FRAT1 Enhances the Proliferation and Tumorigenesis of CD133+Nestin+ Glioma Stem Cells In Vitro and In Vivo
- PMID: 32201513
- PMCID: PMC7066019
- DOI: 10.7150/jca.37622
FRAT1 Enhances the Proliferation and Tumorigenesis of CD133+Nestin+ Glioma Stem Cells In Vitro and In Vivo
Abstract
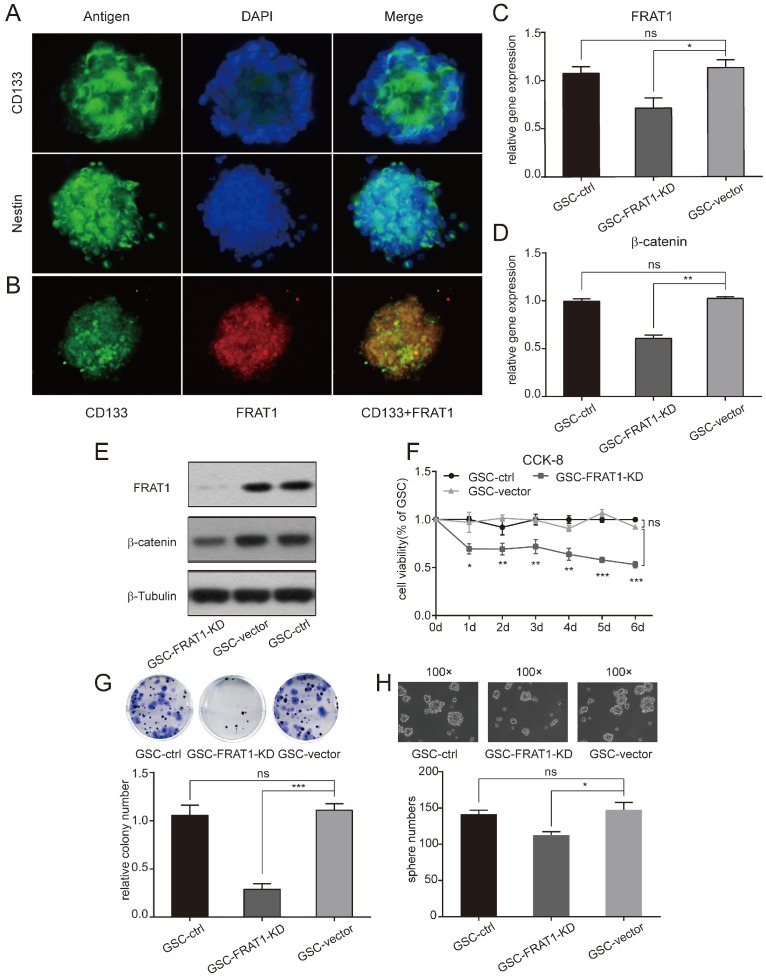
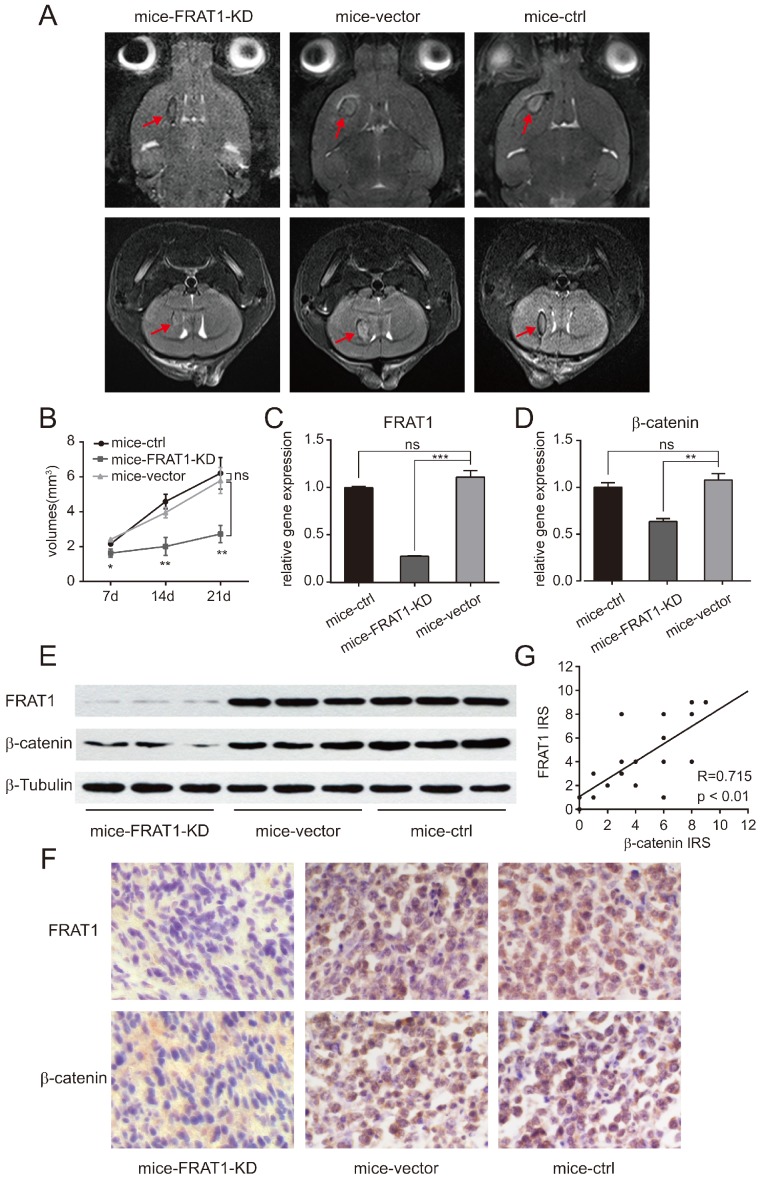
Glioma stem cells (GSCs) are considered the source for development, recurrence, and poor prognosis of glioma, so treatment targeted GSCs is of great interest. The frequently rearranged in advanced T cell lymphomas-1 (FRAT1) gene is an important member of the Wnt/β-catenin signaling transduction pathway, and aberrantly activation of Wnt signaling has been identified to contribute to the tumorigenesis, proliferation, invasion of a variety kinds of cancer stem cells. However, correlations between FRAT1 and GSCs and the specific mechanisms remain unclear. In this study, we aimed to investigate the effect of FRAT1 on GSCs proliferation, colony formation, sphere formation and tumorigenesity in vitro and in vivo and its underlying mechanism. Lentiviral transfection was used to construct GSCs with low FRAT1 expression. The expression of FRAT1 on GSCs proliferation in vitro was assessed by cell counting kit-8(CCK-8). Colony formation and sphere formation assays were conducted to assess the colony and sphere formation ability of GSCs. Then, an intracranial glioma nude mouse model was built to measure the effect of low FRAT1 expression on GSCs proliferation and tumorigenesity in vivo. Real-time PCR, Western blot, and Immunohistochemistry were processed to detect the mRNA and protein expressions of FRAT1, β-catenin in the glioma tissue of xenograft mice to study their correlations. The functional assays verifed that low FRAT1 expression inhibited CD133+Nestin+ GSCs proliferation, colony formation, sphere formation ability in vitro. In vivo GSCs xenograft mice model showed that low FRAT1 expression suppressed the proliferation and tumorigenesity of CD133+Nestin+ GSCs and reduced β-catenin mRNA and protein expression. Furthermore, the expression of FRAT1 and β-catenin were positively correlated. Altogether, results indicate that FRAT1 enhances the proliferation, colony formation, sphere formation and tumorigenesity of CD133+Nestin+ glioma stem cells in vitro and in vivo as well as the expression of β-catenin. Therefore, inhibiting proliferation of GSCs and FRAT1 may be a molecular target to GSCs in treating human glioma in the future.
Keywords: Glioma stem cells (GSCs); Proliferation; The frequently rearranged in advanced T cell lymphomas-1(FRAT1); Wnt/β-catenin pathway.
© The author(s).
Conflict of interest statement
Competing Interests: The authors have declared that no competing interest exists.
Figures
Similar articles
-
LGR5, a novel functional glioma stem cell marker, promotes EMT by activating the Wnt/β-catenin pathway and predicts poor survival of glioma patients.J Exp Clin Cancer Res. 2018 Sep 12;37(1):225. doi: 10.1186/s13046-018-0864-6. J Exp Clin Cancer Res. 2018. PMID: 30208924 Free PMC article.
-
Knockdown of FRAT1 expression by RNA interference inhibits human glioblastoma cell growth, migration and invasion.PLoS One. 2013 Apr 17;8(4):e61206. doi: 10.1371/journal.pone.0061206. Print 2013. PLoS One. 2013. PMID: 23613813 Free PMC article.
-
Silencing of FRAT1 by siRNA inhibits the proliferation of SGC7901 human gastric adenocarcinoma cells.Biomed Rep. 2016 Feb;4(2):223-226. doi: 10.3892/br.2016.571. Epub 2016 Jan 11. Biomed Rep. 2016. PMID: 26893843 Free PMC article.
-
Could We Address the Interplay Between CD133, Wnt/β-Catenin, and TERT Signaling Pathways as a Potential Target for Glioblastoma Therapy?Front Oncol. 2021 Apr 1;11:642719. doi: 10.3389/fonc.2021.642719. eCollection 2021. Front Oncol. 2021. PMID: 33869033 Free PMC article. Review.
-
The Epigenetics of Glioma Stem Cells: A Brief Overview.Front Oncol. 2020 Dec 2;10:602378. doi: 10.3389/fonc.2020.602378. eCollection 2020. Front Oncol. 2020. PMID: 33344253 Free PMC article. Review.
Cited by
-
LncRNA CCAT1 promotes prostate cancer cells proliferation, migration, and invasion through regulation of miR-490-3p/FRAT1 axis.Aging (Albany NY). 2021 Jul 28;13(14):18527-18544. doi: 10.18632/aging.203300. Epub 2021 Jul 28. Aging (Albany NY). 2021. PMID: 34319909 Free PMC article.
-
Kappa opioid receptor internalisation-induced p38 nuclear translocation suppresses glioma progression.Br J Anaesth. 2025 Mar;134(3):759-771. doi: 10.1016/j.bja.2024.09.031. Epub 2024 Dec 30. Br J Anaesth. 2025. PMID: 39741108 Free PMC article.
-
An Overview of CD133 as a Functional Unit of Prognosis and Treatment Resistance in Glioblastoma.Curr Oncol. 2023 Sep 7;30(9):8278-8293. doi: 10.3390/curroncol30090601. Curr Oncol. 2023. PMID: 37754516 Free PMC article. Review.
-
Systematic Review of Molecular Targeted Therapies for Adult-Type Diffuse Glioma: An Analysis of Clinical and Laboratory Studies.Int J Mol Sci. 2023 Jun 21;24(13):10456. doi: 10.3390/ijms241310456. Int J Mol Sci. 2023. PMID: 37445633 Free PMC article.
-
Significance of Nestin and CD133 as cancer stem cell markers in diffuse glioma and association with p53 expression and IDH status.Int J Clin Exp Pathol. 2024 Jul 15;17(7):208-218. doi: 10.62347/YXVS6225. eCollection 2024. Int J Clin Exp Pathol. 2024. PMID: 39114503 Free PMC article.
References
-
- Beck B, Blanpain C. Unravelling cancer stem cell potential. Nat Rev Cancer. 2013;13:727–38. - PubMed
-
- Allegra A, Alonci A, Penna G, Innao V, Gerace D, Rotondo F. et al. The cancer stem cell hypothesis: a guide to potential molecular targets. Cancer Invest. 2014;32:470–95. - PubMed
-
- Imaizumi A, Onishi H, Yamasaki A, Kawamoto M, Umebayashi M, Morisaki T. et al. Hypoxic Conditions Promote Gemcitabine Sensitivity in a Pancreatic Cancer Stem Cell Line. Anticancer Res. 2016;36:653–7. - PubMed
LinkOut - more resources
Full Text Sources
Research Materials
