. 2020 Feb 19;11(9):2621-2631.
doi: 10.7150/jca.40171. eCollection 2020.

ALDH3A1 acts as a prognostic biomarker and inhibits the epithelial mesenchymal transition of oral squamous cell carcinoma through IL-6/STAT3 signaling pathway

Affiliations

ALDH3A1 acts as a prognostic biomarker and inhibits the epithelial mesenchymal transition of oral squamous cell carcinoma through IL-6/STAT3 signaling pathway

Yi Qu et al. J Cancer. .

Abstract

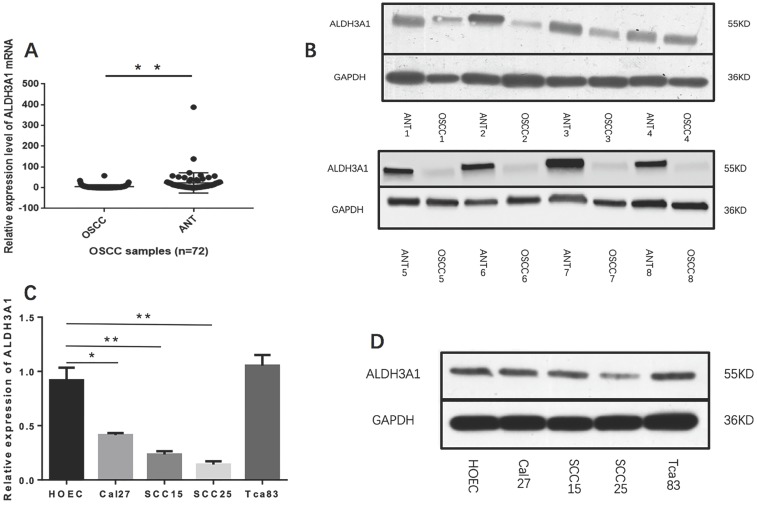
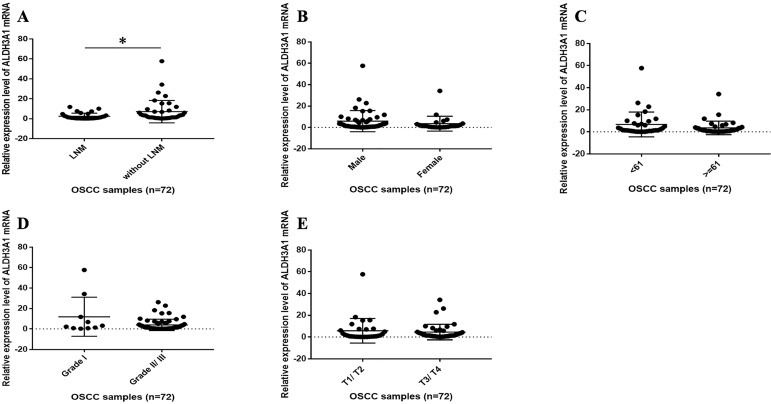
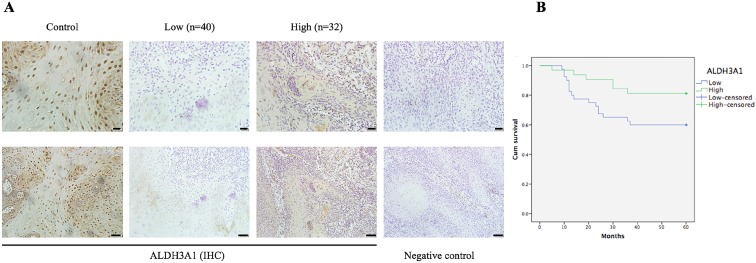
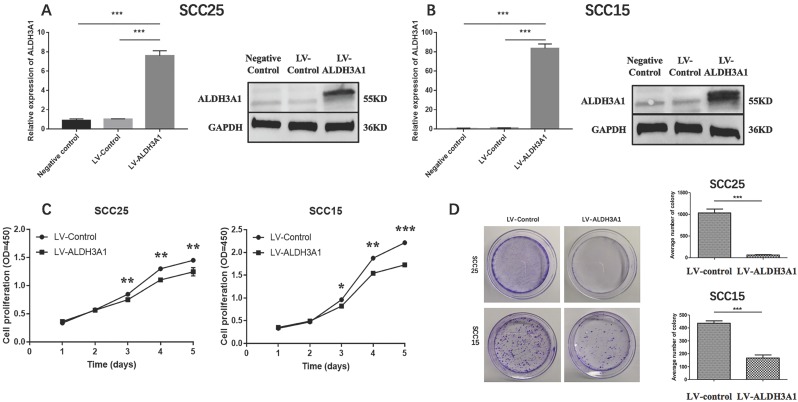
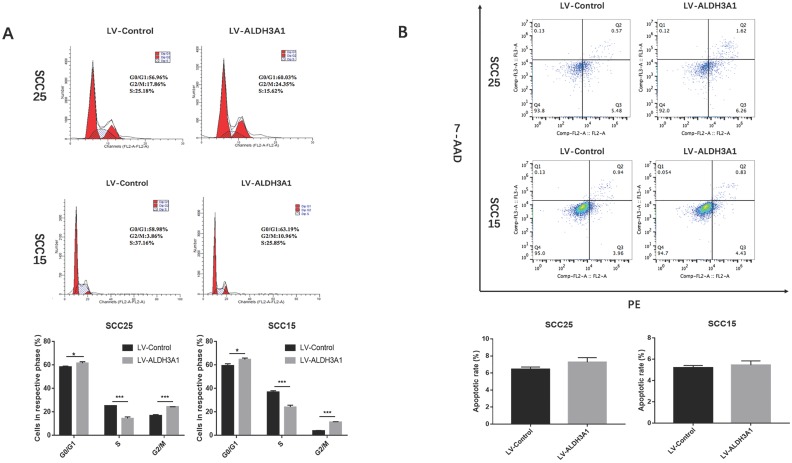
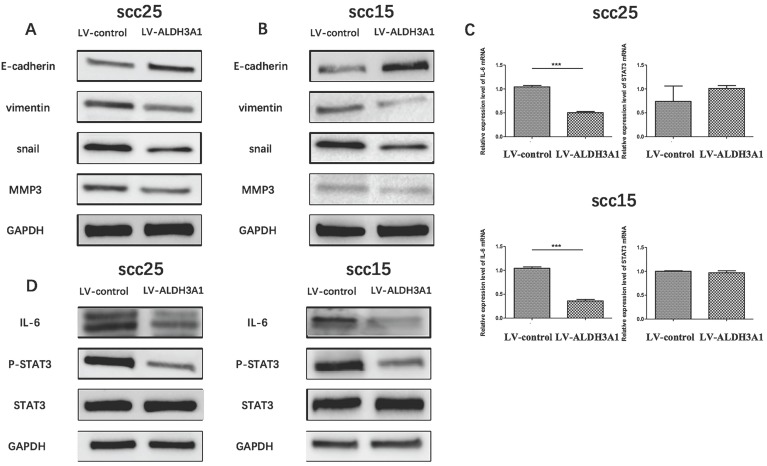
Objectives: Aldehyde dehydrogenase 3A1 (ALDH3A1) is a member of the ALDH superfamily and its relationship with oral squamous cell carcinoma (OSCC) still unknown. In our subject, we aimed to reveal the expression pattern and clinical value of ALDH3A1 in OSCC and its biological function in OSCC cell lines. Materials and methods: The expression level of ALDH3A1 in paired OSCC tissues and adjacent noncancerous tissues were detected by quantitative real-time PCR, Western blot and immunohistochemistry. The relationship between ALDH3A1 expression and clinical characteristics was analyzed. Besides, cell-counting kit 8, colony formation, wound healing, transwell invasion, apoptosis and cell cycle assays were employed to assess the role of ALDH3A1 in OSCC cells. To explore the influence of ALDH3A1 on OSCC epithelial-to-mesenchymal transition (EMT), the expression of EMT markers (E-cadherin, vimentin, snail, MMP3) on OSCC cells were detected, and possible mechanisms were analyzed. Results: In OSCC tissues, ALDH3A1 was significantly decreased compared to the adjacent normal tissues. Lower ALDH3A1 expression in OSCC tissues was associated with a higher incidence of lymph node metastasis (LNM). Moreover, the overall survival of OSCC with low ALDH3A1 expression was significantly worse compared to that of OSCC with high ALDH3A1 expression. Restored expression of ALDH3A1 suppressed cell proliferation, migration and invasion in OSCC cells. Further experiments showed that ALDH3A1 might inhibit EMT in OSCC via a regulation of the IL-6/STAT3 signal pathway. Conclusion: These data indicate that ALDH3A1 may serve as a biomarker and may be developed into a novel treatment for OSCC.

Keywords: ALDH3A1; IL-6; epithelial-mesenchymal transition; lymph node metastasis; oral squamous cell carcinoma; prognostic biomarker.


Conflict of interest statement

Competing Interests: The authors have declared that no competing interest exists.

Figures

Figure 1
Figure 1
ALDH3A1 expression in tissues and cell lines. (A) qRT-PCR analysis of ALDH3A1 expression in OSCC samples and cancer‐adjacent normal tissues (ANTs). (B) Western blot analysis of ALDH3A1 protein levels in 8 OSCC samples and paired adjacent normal tissue (ANT) samples. (C-D) mRNA and protein expression of ALDH3A1 in HOEC and OSCC cell lines, including SCC15, SCC25, Cal27 and Tca83. *p< 0.05, **p< 0.01.
Figure 2
Figure 2
The correlation between ALDH3A1 mRNA expression levels and clinical features in OSCC patients. (A) The mRNA expression levels of ALDH3A1 in tissues from OSCC patients with and without LNM. *p< 0.05. (B) The mRNA expression levels of ALDH3A1 in tissues from male and female OSCC patients. (C) The mRNA expression levels of ALDH3A1 in tissues from < 61 years and ≥ 61 years OSCC patients (61 years is the median age of the subjects). (D) The mRNA expression levels of ALDH3A1 in tissues from T1/T2 and T3/T4 OSCC patients. (E) The mRNA expression levels of ALDH3A1 in tissues from histology grade I and grade II/III OSCC patients.
Figure 3
Figure 3
IHC results for the expression of ALDH3A1 and its relationship with overall survival in patients with OSCC. (A) IHC staining of ALDH3A1 in control (adjacent normal tissues) and OSCC tissues. The negative control was established by using PBS as a substitute for the primary antibody. Scale bar: 20 μm (top) and 50 μm (bottom). (B) Kaplan-Meier survival analysis was performed to estimate the association between ALDH3A1 protein expression levels in tissue and the survival time of OSCC patients (p=0.046).
Figure 4
Figure 4
ALDH3A1 inhibits cell proliferation and colony‐formation abilities in SCC15 and SCC25 cells. (A-B) qRT‐PCR and Western blot results for SCC25 and SCC15 transfected with control lentivirus and ALDH3A1 lentivirus. (C) Cell proliferation was determined by CCK-8 assay at 1, 2, 3, 4 and 5 days. (D) Colony formation assay results. Quantification analyses for D; the data are the mean ± SD of colony numbers. *p< 0.05, **p< 0.01, ***p<0.001.
Figure 5
Figure 5
Up-regulation of ALDH3A1 inhibited cell migration and metastasis in vitro. (A-B) Up-regulation of ALDH3A1 inhibited migration in SCC15 and SCC25 cells at 48h and 72h, in a wound-healing assay. The representative images were from at least three independent experiments. (C-D) Up-regulation of ALDH3A1 inhibited SCC15 and SCC25 cell invasion in a cell invasion assay, 100× magnifications. The representative images were from at least three independent experiments. **p< 0.01.
Figure 6
Figure 6
Effects of ALDH3A1 on OSCC cell cycle and apoptosis. (A) Representative plots of the cell cycle phases are shown for the SCC15 and SCC25 cells. The representative images were from at least three independent experiments. (B) The cell apoptosis distribution after transfection was detected by flow cytometry. The representative images were from at least three independent experiments. *p< 0.05, **p< 0.01, ***p<0.001.
Figure 7
Figure 7
ALDH3A1 suppresses EMT by targeting the IL-6/STAT3 axis in OSCC cells (A-B) The expression level of E-cadherin, vimentin, snail and MMP-3 protein expression in SCC15 and SCC25 cells were examined by western blot analysis. (C) The mRNA expression levels of IL-6 and STAT3 in SCC25 and SCC25 cells. (D) Western blot of phosphorylated STAT3 (Tyr705), STAT3 and IL-6 in SCC15 and SCC25 cells. ***p<0.001.

Similar articles

Cited by

References

    1. Economopoulou P, Kotsantis I, Kyrodimos E, Lianidou ES, Psyrri A. Liquid biopsy: An emerging prognostic and predictive tool in Head and Neck Squamous Cell Carcinoma (HNSCC). Focus on Circulating Tumor Cells (CTCs) Oral oncology. 2017;74:83–9. - PubMed
    1. Kita A, Kasamatsu A, Nakashima D, Endo-Sakamoto Y, Ishida S, Shimizu T. et al. Activin B Regulates Adhesion, Invasiveness, and Migratory Activities in Oral Cancer: a Potential Biomarker for Metastasis. Journal of Cancer. 2017;8:2033–41. - PMC - PubMed
    1. Sarode GS, Sarode SC, Maniyar N, Anand R, Patil S. Oral cancer databases: A comprehensive review. Journal of oral pathology & medicine. 2018;47:547–56. - PubMed
    1. Zanoni DK, Montero PH, Migliacci JC, Shah JP, Wong RJ, Ganly I. et al. Survival outcomes after treatment of cancer of the oral cavity (1985-2015) Oral oncology. 2019;90:115–21. - PMC - PubMed
    1. Qu Y, Liu Y, Su M, Yang Y, Han Z, Qin L. The strategy on managing cervical lymph nodes of patients with maxillary gingival squamous cell carcinoma. Journal of cranio-maxillo-facial surgery. 2019;47:300–4. - PubMed