

Hyena paleogenomes reveal a complex evolutionary history of cross-continental gene flow between spotted and cave hyena
- PMID: 32201717
- PMCID: PMC7069707
- DOI: 10.1126/sciadv.aay0456
Hyena paleogenomes reveal a complex evolutionary history of cross-continental gene flow between spotted and cave hyena
Abstract
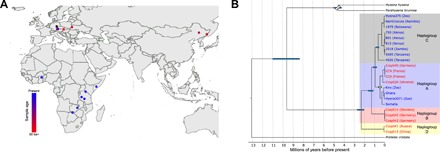
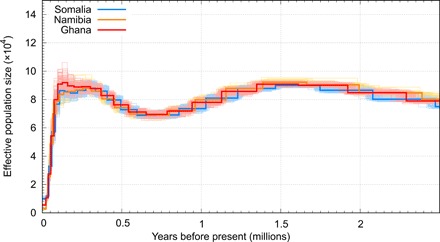
The genus Crocuta (African spotted and Eurasian cave hyenas) includes several closely related extinct and extant lineages. The relationships among these lineages, however, are contentious. Through the generation of population-level paleogenomes from late Pleistocene Eurasian cave hyena and genomes from modern African spotted hyena, we reveal the cross-continental evolutionary relationships between these enigmatic hyena lineages. We find a deep divergence (~2.5 Ma) between African and Eurasian Crocuta populations, suggesting that ancestral Crocuta left Africa around the same time as early Homo. Moreover, we find discordance between nuclear and mitochondrial phylogenies and evidence for bidirectional gene flow between African and Eurasian Crocuta after the lineages split, which may have complicated prior taxonomic classifications. Last, we find a number of introgressed loci that attained high frequencies within the recipient lineage, suggesting some level of adaptive advantage from admixture.
Copyright © 2020 The Authors, some rights reserved; exclusive licensee American Association for the Advancement of Science. No claim to original U.S. Government Works. Distributed under a Creative Commons Attribution NonCommercial License 4.0 (CC BY-NC).
Figures


References
-
- Stuart A. J., Late Quaternary megafaunal extinctions on the continents: A short review. Geol. J. 50, 338–363 (2015).
-
- Lalueza-Fox C., Gilbert M. T. P., Paleogenomics of archaic hominins. Curr. Biol. 21, R1002–R1009 (2011). - PubMed
-
- M. E. Lewis, L. Werdelin, Vertebrate paleobiology and paleoanthropology, in Out of Africa I, J. G. Fleagle, J. J. Shea, F. E. Grine, A. L. Baden, R. E. Leakey, Eds. (Springer, 2010), pp. 13–26.
-
- Cooper S. M., Holekamp K. E., Smale L., A seasonal feast: Long-term analysis of feeding behaviour in the spotted hyaena (Crocuta crocuta). Afr. J. Ecol. 37, 149–160 (1999).
-
- Watts H. E., Scribner K. T., Garcia H. A., Holekamp K. E., Genetic diversity and structure in two spotted hyena populations reflects social organization and male dispersal. J. Zool. 285, 281–291 (2011).
Publication types
MeSH terms
LinkOut - more resources
Full Text Sources
