. 2020 Mar 13;6(11):eaay2840.
doi: 10.1126/sciadv.aay2840. eCollection 2020 Mar.

Machine-knitted washable sensor array textile for precise epidermal physiological signal monitoring

Affiliations

Machine-knitted washable sensor array textile for precise epidermal physiological signal monitoring

Wenjing Fan et al. Sci Adv. .

Abstract

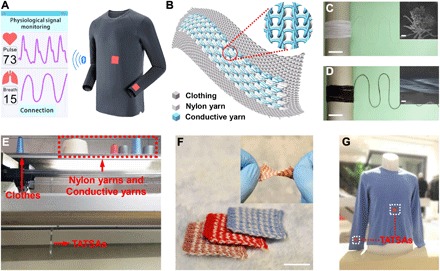
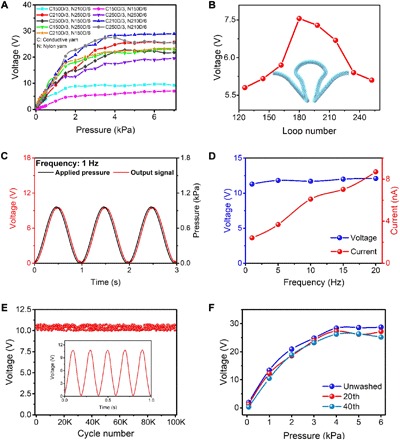
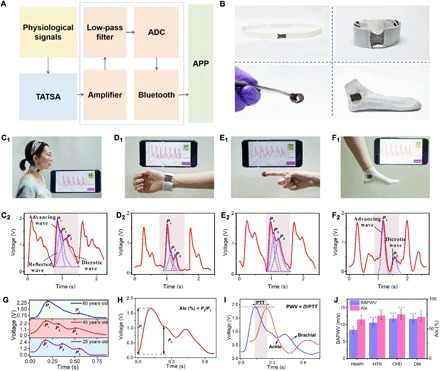
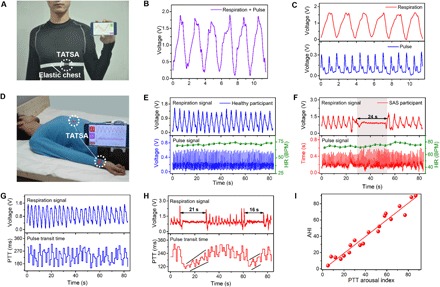
Wearable textile electronics are highly desirable for realizing personalized health management. However, most reported textile electronics can either periodically target a single physiological signal or miss the explicit details of the signals, leading to a partial health assessment. Furthermore, textiles with excellent property and comfort still remain a challenge. Here, we report a triboelectric all-textile sensor array with high pressure sensitivity and comfort. It exhibits the pressure sensitivity (7.84 mV Pa-1), fast response time (20 ms), stability (>100,000 cycles), wide working frequency bandwidth (up to 20 Hz), and machine washability (>40 washes). The fabricated TATSAs were stitched into different parts of clothes to monitor the arterial pulse waves and respiratory signals simultaneously. We further developed a health monitoring system for long-term and noninvasive assessment of cardiovascular disease and sleep apnea syndrome, which exhibits great advancement for quantitative analysis of some chronic diseases.


Figures

Fig. 1
Fig. 1. Fabrication and structure of all-textile pressure sensors.
(A) Two TATSAs integrated into a shirt for the monitoring of pulse and respiratory signals in real time. (B) Schematic illustration of the combination of TATSA and clothes. The inset shows the enlarged view of the sensor. (C) Photograph of the conductive yarn (scale bar, 4 cm). The inset is the SEM image of the cross section of the conductive yarn (scale bar, 100 μm), which consists of stainless steel and Terylene yarns. (D) Photograph of the nylon yarn (scale bar, 4 cm). The inset is the SEM image of the nylon yarn surface (scale bar, 100 μm). (E) Image of the computerized flat knitting machine carrying out the automatic weaving of the TATSAs. (F) Photograph of TATSAs in different colors (scale bar, 2 cm). The inset is the twisted TATSA, which demonstrates its excellent softness. (G) Photograph of two TATSAs completely and seamlessly stitched into a sweater. Photo credit: Wenjing Fan, Chongqing University.
Fig. 2
Fig. 2. Demonstration of the working principle of TATSA.
(A) The TATSA with the front, right, and top sides of the knit loops. (B) Simulation result of the force distribution of a TATSA under an applied pressure of 2 kPa using the COMSOL software. (C) Schematic illustrations of the charge transfer of a contact unit under short-circuit conditions. (D) Simulation results of the charge distribution of a contact unit under an open circuit condition using the COMSOL software.
Fig. 3
Fig. 3. Performance of the TATSA.
(A) Output voltage under nine knitting patterns of the conductive yarn (150D/3, 210D/3, and 250D/3) combined with the nylon yarn (150D/6, 210D/6, and 250D/6). (B) Voltage response to various numbers of loop units in the same fabric area when keeping the loop number in the wale direction unchanged. (C) Plots showing the frequency responses under a dynamic pressure of 1 kPa and pressure input frequency of 1 Hz. (D) Different output and current voltages under the frequencies of 1, 5, 10, and 20 Hz. (E) Durability test of a TATSA under a pressure of 1 kPa. (F) Output characteristics of the TATSA after washing 20 and 40 times.
Fig. 4
Fig. 4. Pulse wave measurements at various artery positions and analysis of the pulse signals.
(A) Illustration of the WMHMS. (B) Photographs of the TATSAs stitched into a wristband, fingerstall, sock, and chest strap, respectively. Measurement of the pulse at the (C1) neck, (D1) wrist, (E1) fingertip, and (F1) ankle. Pulse waveform at the (C2) neck, (D2) wrist, (E2) fingertip, and (F2) ankle. (G) Pulse waveforms of different ages. (H) Analysis of a single pulse wave. Radial augmentation index (AIx) defined as AIx (%) = P2/P1. P1 is the peak of the advancing wave, and P2 is the peak of the reflected wave. (I) A pulse cycle of the brachial and the ankle. Pulse wave velocity (PWV) is defined as PWV = D/∆T. D is the distance between the ankle and the brachial. ∆T is the time delay between the peaks of the ankle and brachial pulse waves. PTT, pulse transit time. (J) Comparison of AIx and brachial-ankle PWV (BAPWV) between healthy and CADs. *P < 0.01, **P < 0.001, and ***P < 0.05. HTN, hypertension; CHD, coronary heart disease; DM, diabetes mellitus. Photo credit: Jin Yang, Chongqing University.
Fig. 5
Fig. 5. Respiratory wave measurements and analysis of SAS.
(A) Photograph showing the display of the TATSA placed on the chest for measuring the signal in the pressure associated with respiration. (B) Voltage-time plot for the TATSA mounted on the chest. (C) Decomposition of the signal (B) into the heartbeat and the respiratory waveform. (D) Photograph showing two TATSAs placed on the abdomen and wrist for measuring respiration and pulse, respectively, during sleep. (E) Respiratory and pulse signals of a healthy participant. HR, heart rate; BPM, beats per minute. (F) Respiratory and pulse signals of a SAS participant. (G) Respiratory signal and PTT of a healthy participant. (H) Respiratory signal and PTT of a SAS participant. (I) Relationship between PTT arousal index and apnea-hypopnea index (AHI). Photo credit: Wenjing Fan, Chongqing University.

References

    1. Han S., Kim J., Won S. M., Ma Y., Kang D., Xie Z., Lee K.-T., Chung H. U., Banks A., Min S., Heo S. Y., Davies C. R., Lee J. W., Lee C.-H., Kim B. H., Li K., Zhou Y., Wei C., Feng X., Huang Y., Rogers J. A., Battery-free, wireless sensors for full-body pressure and temperature mapping. Sci. Transl. Med. 10, eaan4950 (2018). - PMC - PubMed
    1. Chen L. Y., Tee B. C.-K., Chortos A. L., Schwartz G., Tse V., Lipomi D. J., Wong H.-S. P., McConnell M. V., Bao Z., Continuous wireless pressure monitoring and mapping with ultra-small passive sensors for health monitoring and critical care. Nat. Commun. 5, 5028 (2014). - PubMed
    1. Jang K.-I., Jung H. N., Lee J. W., Xu S., Liu Y. H., Ma Y., Jeong J.-W., Song Y. M., Kim J., Kim B. H., Banks A., Kwak J. W., Yang Y., Shi D., Wei Z., Feng X., Paik U., Huang Y., Ghaffari R., Rogers J. A., Ferromagnetic, folded electrode composite as a soft interface to the skin for long-term electrophysiological recording. Adv. Funct. Mater. 26, 7281–7290 (2016). - PMC - PubMed
    1. Krishnan S. R., Su C.-J., Xie Z., Patel M., Madhvapathy S. R., Xu Y., Freudman J., Ng B., Heo S. Y., Wang H., Ray T. R., Leshock J., Stankiewicz I., Feng X., Huang Y., Gutruf P., Rogers J. A., Epidermal electronics: Wireless, battery-free epidermal electronics for continuous, quantitative, multimodal thermal characterization of skin (Small 47/2018). Small 14, 1870226 (2018). - PubMed
    1. Liu Y., Norton J. J. S., Qazi R., Zou Z., Ammann K. R., Liu H., Yan L., Tran P. L., Jang K.-I., Lee J. W., Zhang D., Kilian K. A., Jung S. H., Bretl T., Xiao J., Slepian M. J., Huang Y., Jeong J.-W., Rogers J. A., Epidermal mechano-acoustic sensing electronics for cardiovascular diagnostics and human-machine interfaces. Sci. Adv. 2, e1601185 (2016). - PMC - PubMed

Publication types

LinkOut - more resources