

Low Toxicity, High Resolution, and Red Tissue Imaging in the Vivo of Yb/Tm/GZO@SiO2 Core-Shell Upconversion Nanoparticles
- PMID: 32201824
- PMCID: PMC7081422
- DOI: 10.1021/acsomega.9b04381
Low Toxicity, High Resolution, and Red Tissue Imaging in the Vivo of Yb/Tm/GZO@SiO2 Core-Shell Upconversion Nanoparticles
Abstract
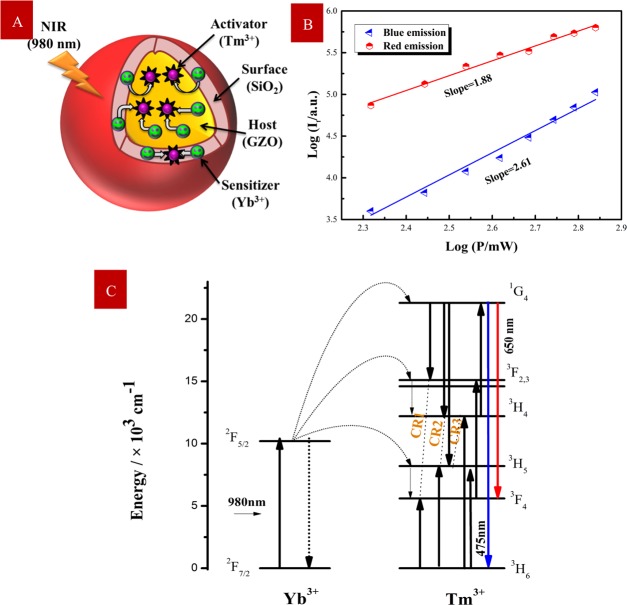
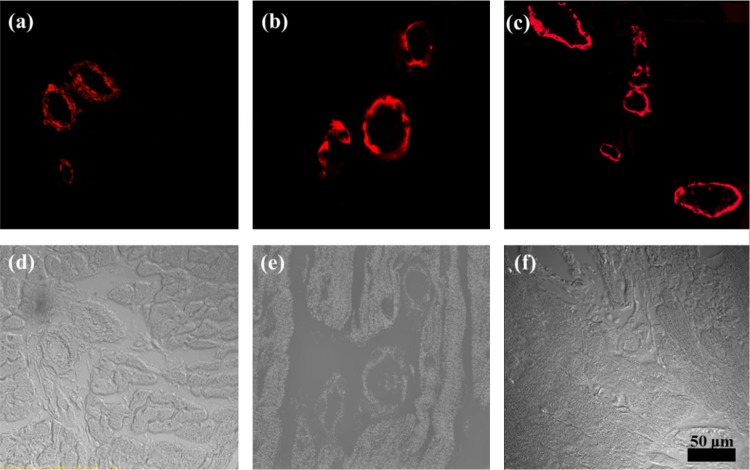
Lanthanide-doped upconversion nanoparticles (UCNPs) have attracted great attention in bioimaging applications. However, the stability and resolution of bioimaging based on UCNPs should be further improved. Herein, we synthesized SiO2-coated Ga(III)-doped ZnO (GZO) with lanthanide ion Yb(III) and Tm(III) (Yb/Tm/GZO@SiO2) UCNPs, which realized red fluorescence imaging in heart tissue. With increasing injection concentrations of Yb/Tm/GZO@SiO2 (1-10 mg/kg), the red fluorescence imaging intensity of heart tissue gradually increased. Moreover, the experimental results of toxicity in vitro and histological assessments of representative organs in vivo were studied, indicating that Yb/Tm/GZO@SiO2 UCNPs had low biological toxicity. These results proved that Yb/Tm/GZO@SiO2 can be used as a probe for fluorescence imaging in vivo.
Copyright © 2020 American Chemical Society.
Conflict of interest statement
The authors declare no competing financial interest.
Figures


Similar articles
-
Silica-Coated Ga(III)-Doped ZnO: Yb3+, Tm3+ Upconversion Nanoparticles for High-Resolution in Vivo Bioimaging using Near-Infrared to Near-Infrared Upconversion Emission.Inorg Chem. 2019 Jun 17;58(12):8230-8236. doi: 10.1021/acs.inorgchem.9b01056. Epub 2019 May 24. Inorg Chem. 2019. PMID: 31125211
-
Effect of silica surface coating on the luminescence lifetime and upconversion temperature sensing properties of semiconductor zinc oxide doped with gallium(III) and sensitized with rare earth ions Yb(III) and Tm(III).Mikrochim Acta. 2018 Feb 26;185(3):197. doi: 10.1007/s00604-018-2733-6. Mikrochim Acta. 2018. PMID: 29594728
-
Influence of Silica Surface Coating on Operated Photodynamic Therapy Property of Yb3+-Tm3+: Ga(III)-Doped ZnO Upconversion Nanoparticles.Inorg Chem. 2018 Jul 2;57(13):8012-8018. doi: 10.1021/acs.inorgchem.8b01169. Epub 2018 Jun 15. Inorg Chem. 2018. PMID: 29905468
-
Aminosilane Functionalization and Cytotoxicity Effects of Upconversion Nanoparticles Y2O3 and Gd2O3 Co-Doped with Yb3+and Er3.Nanobiomedicine (Rij). 2016 Jan 1;3:1. doi: 10.5772/62252. eCollection 2016 Jan-Dec. Nanobiomedicine (Rij). 2016. PMID: 29942376 Free PMC article. Review.
-
Nanocomposites based on lanthanide-doped upconversion nanoparticles: diverse designs and applications.Light Sci Appl. 2022 Jul 13;11(1):222. doi: 10.1038/s41377-022-00871-z. Light Sci Appl. 2022. PMID: 35831282 Free PMC article. Review.
Cited by
-
Large enhancement of red upconversion luminescence in beta Ba2Sc0.67Yb0.3Er0.03AlO5 phosphor via Mn2+ ions doping for thermometry.Sci Rep. 2024 Apr 17;14(1):8893. doi: 10.1038/s41598-024-59732-x. Sci Rep. 2024. PMID: 38632459 Free PMC article.
-
Dual-mode vehicles with simultaneous thermometry and drug release properties based on hollow Y2O3:Er,Yb and Y2O2SO4:Er,Yb spheres.RSC Adv. 2022 Nov 21;12(51):33239-33250. doi: 10.1039/d2ra06162g. eCollection 2022 Nov 15. RSC Adv. 2022. PMID: 36425207 Free PMC article.
-
A Systematic Review of Toxicity, Biodistribution, and Biosafety in Upconversion Nanomaterials: Critical Insights into Toxicity Mitigation Strategies and Future Directions for Safe Applications.BME Front. 2025 May 23;6:0120. doi: 10.34133/bmef.0120. eCollection 2025. BME Front. 2025. PMID: 40416504 Free PMC article. Review.
-
Recent advances of lanthanide nanomaterials in Tumor NIR fluorescence detection and treatment.Mater Today Bio. 2023 May 2;20:100646. doi: 10.1016/j.mtbio.2023.100646. eCollection 2023 Jun. Mater Today Bio. 2023. PMID: 37214552 Free PMC article. Review.
References
-
- Zhou J.; Sun Y.; Du X.; Xiong L.; Hu H.; Li F. Dual-modality in vivo, imaging using rare-earth nanocrystals with near-infrared to near-infrared (NIR-to-NIR) upconversion luminescence and magnetic resonance properties. Biomaterials 2010, 31, 3287–3295. 10.1016/j.biomaterials.2010.01.040. - DOI - PubMed
LinkOut - more resources
Full Text Sources
