Review
. 2020 Apr 22;120(8):3787-3851.
doi: 10.1021/acs.chemrev.9b00738. Epub 2020 Mar 23.

ImmunoPET: Concept, Design, and Applications

Affiliations
Review

ImmunoPET: Concept, Design, and Applications

Weijun Wei et al. Chem Rev. .

Abstract

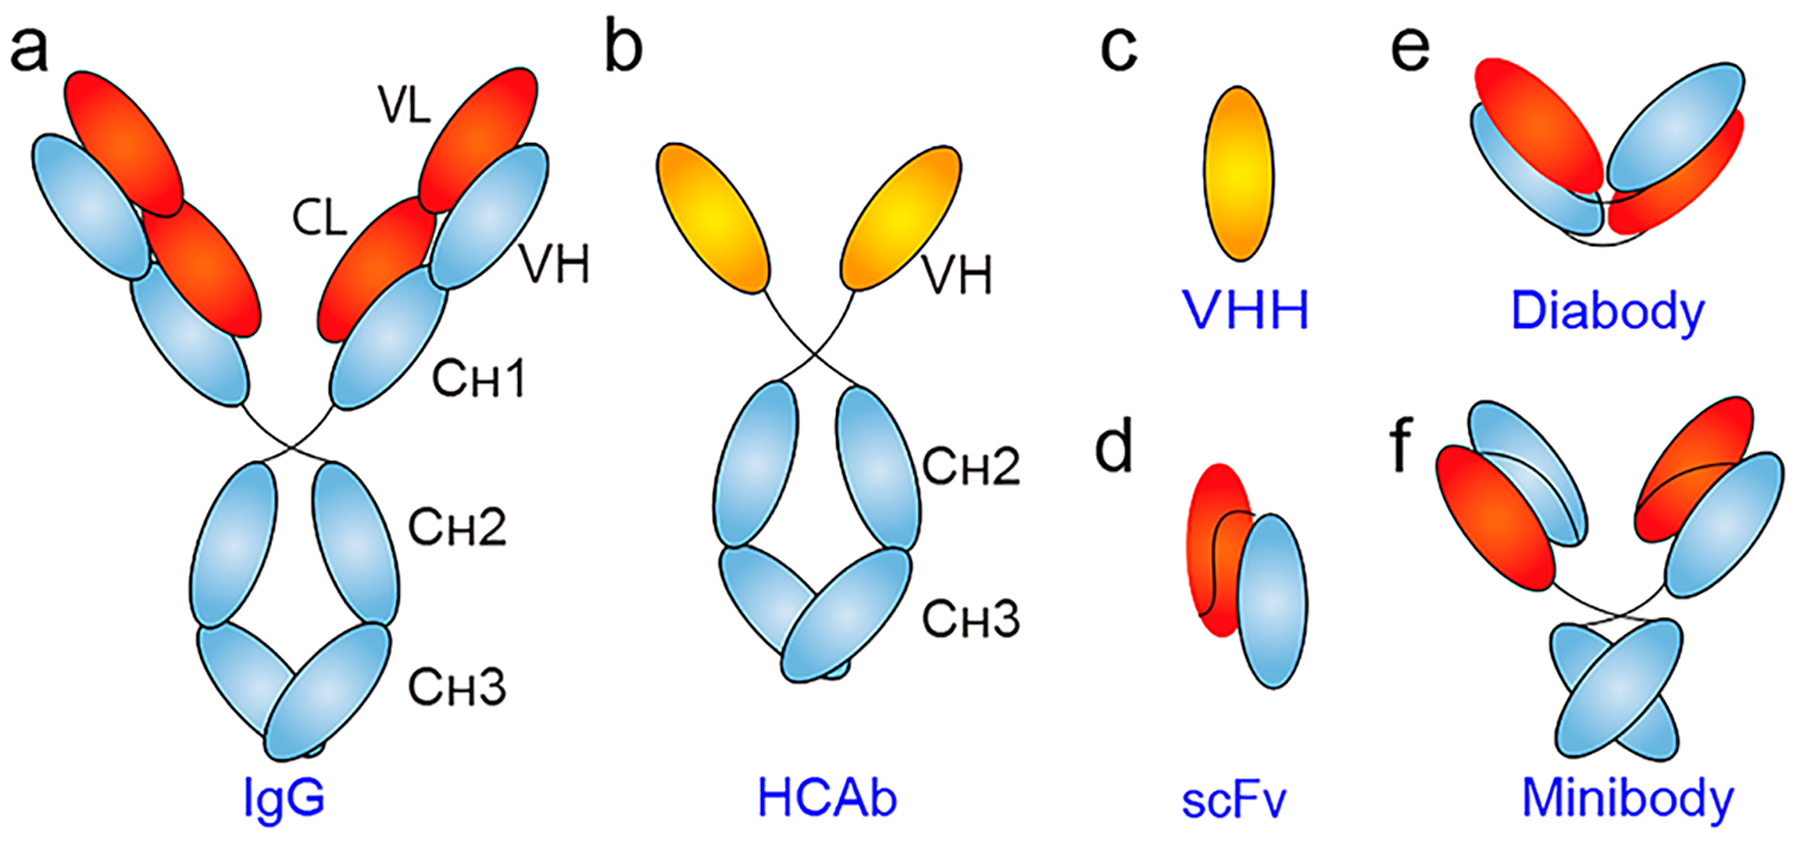
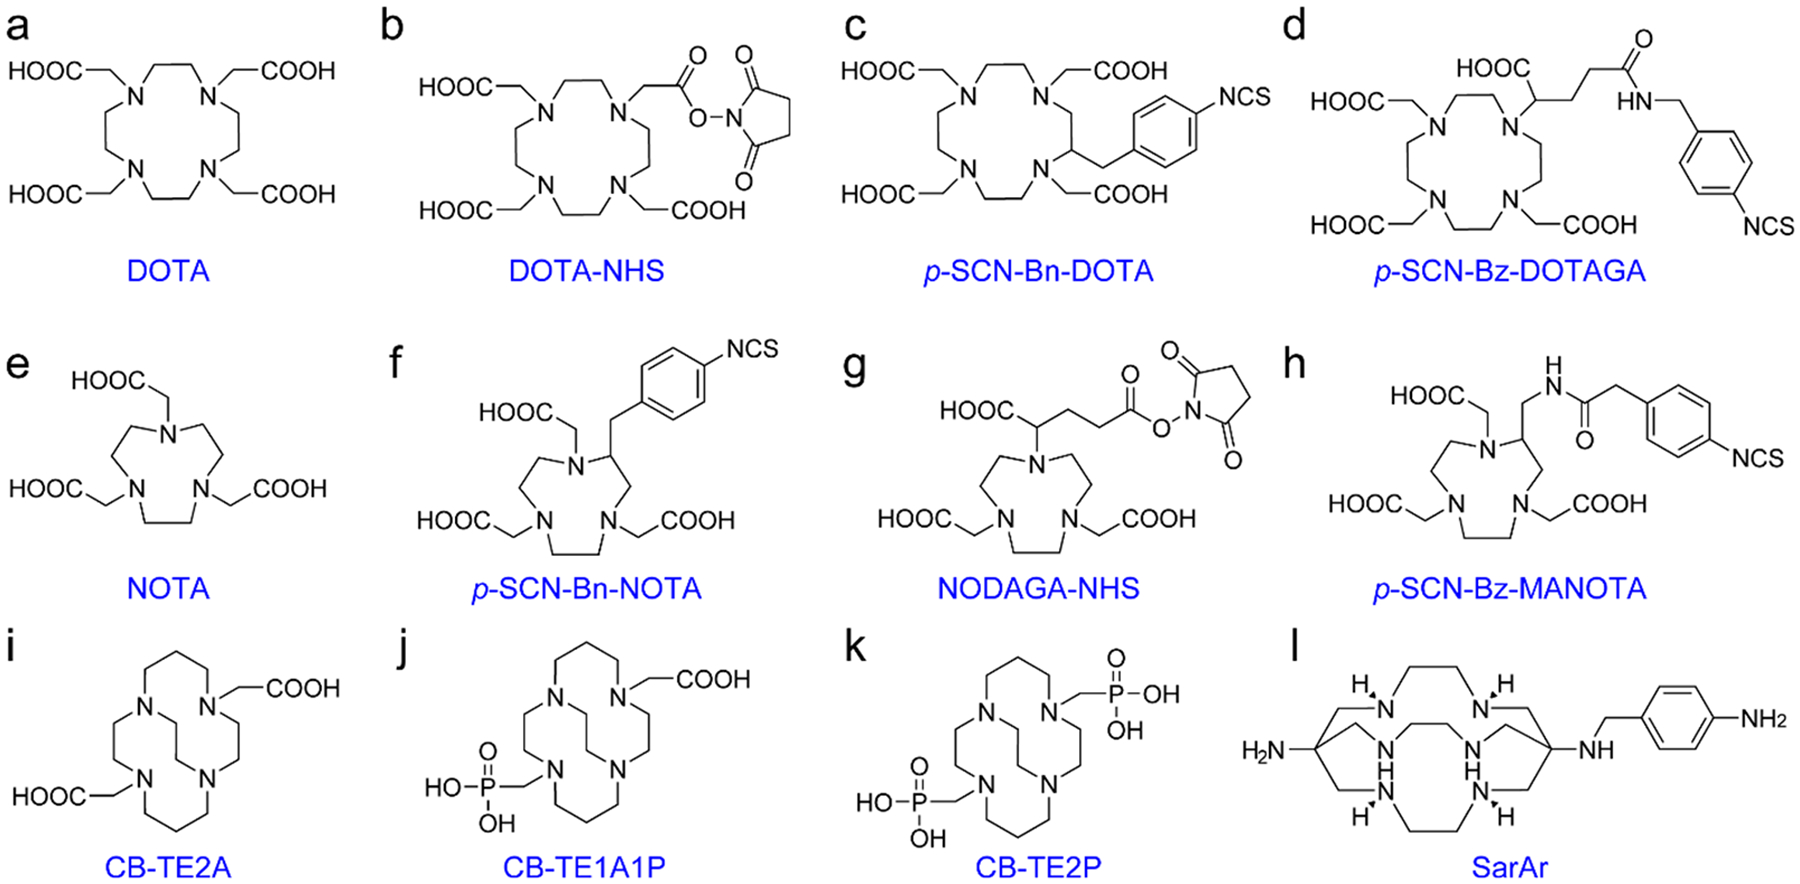
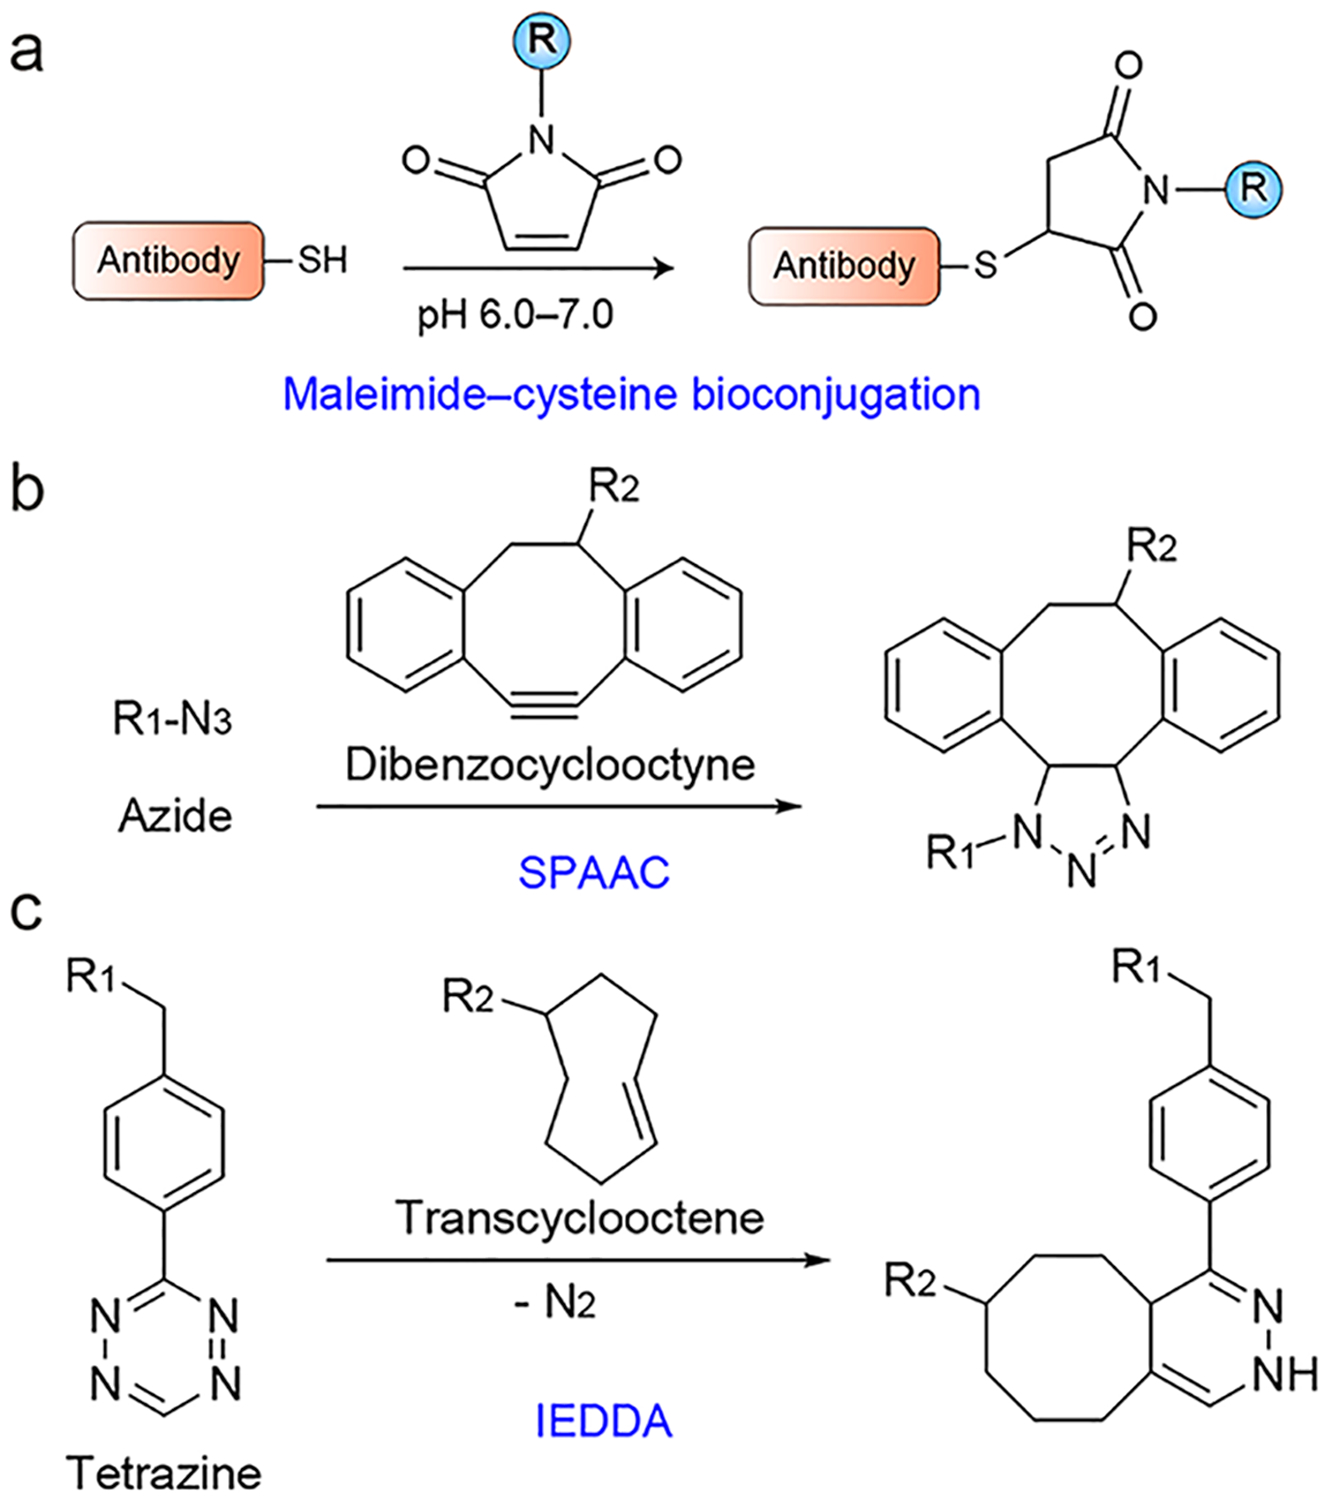
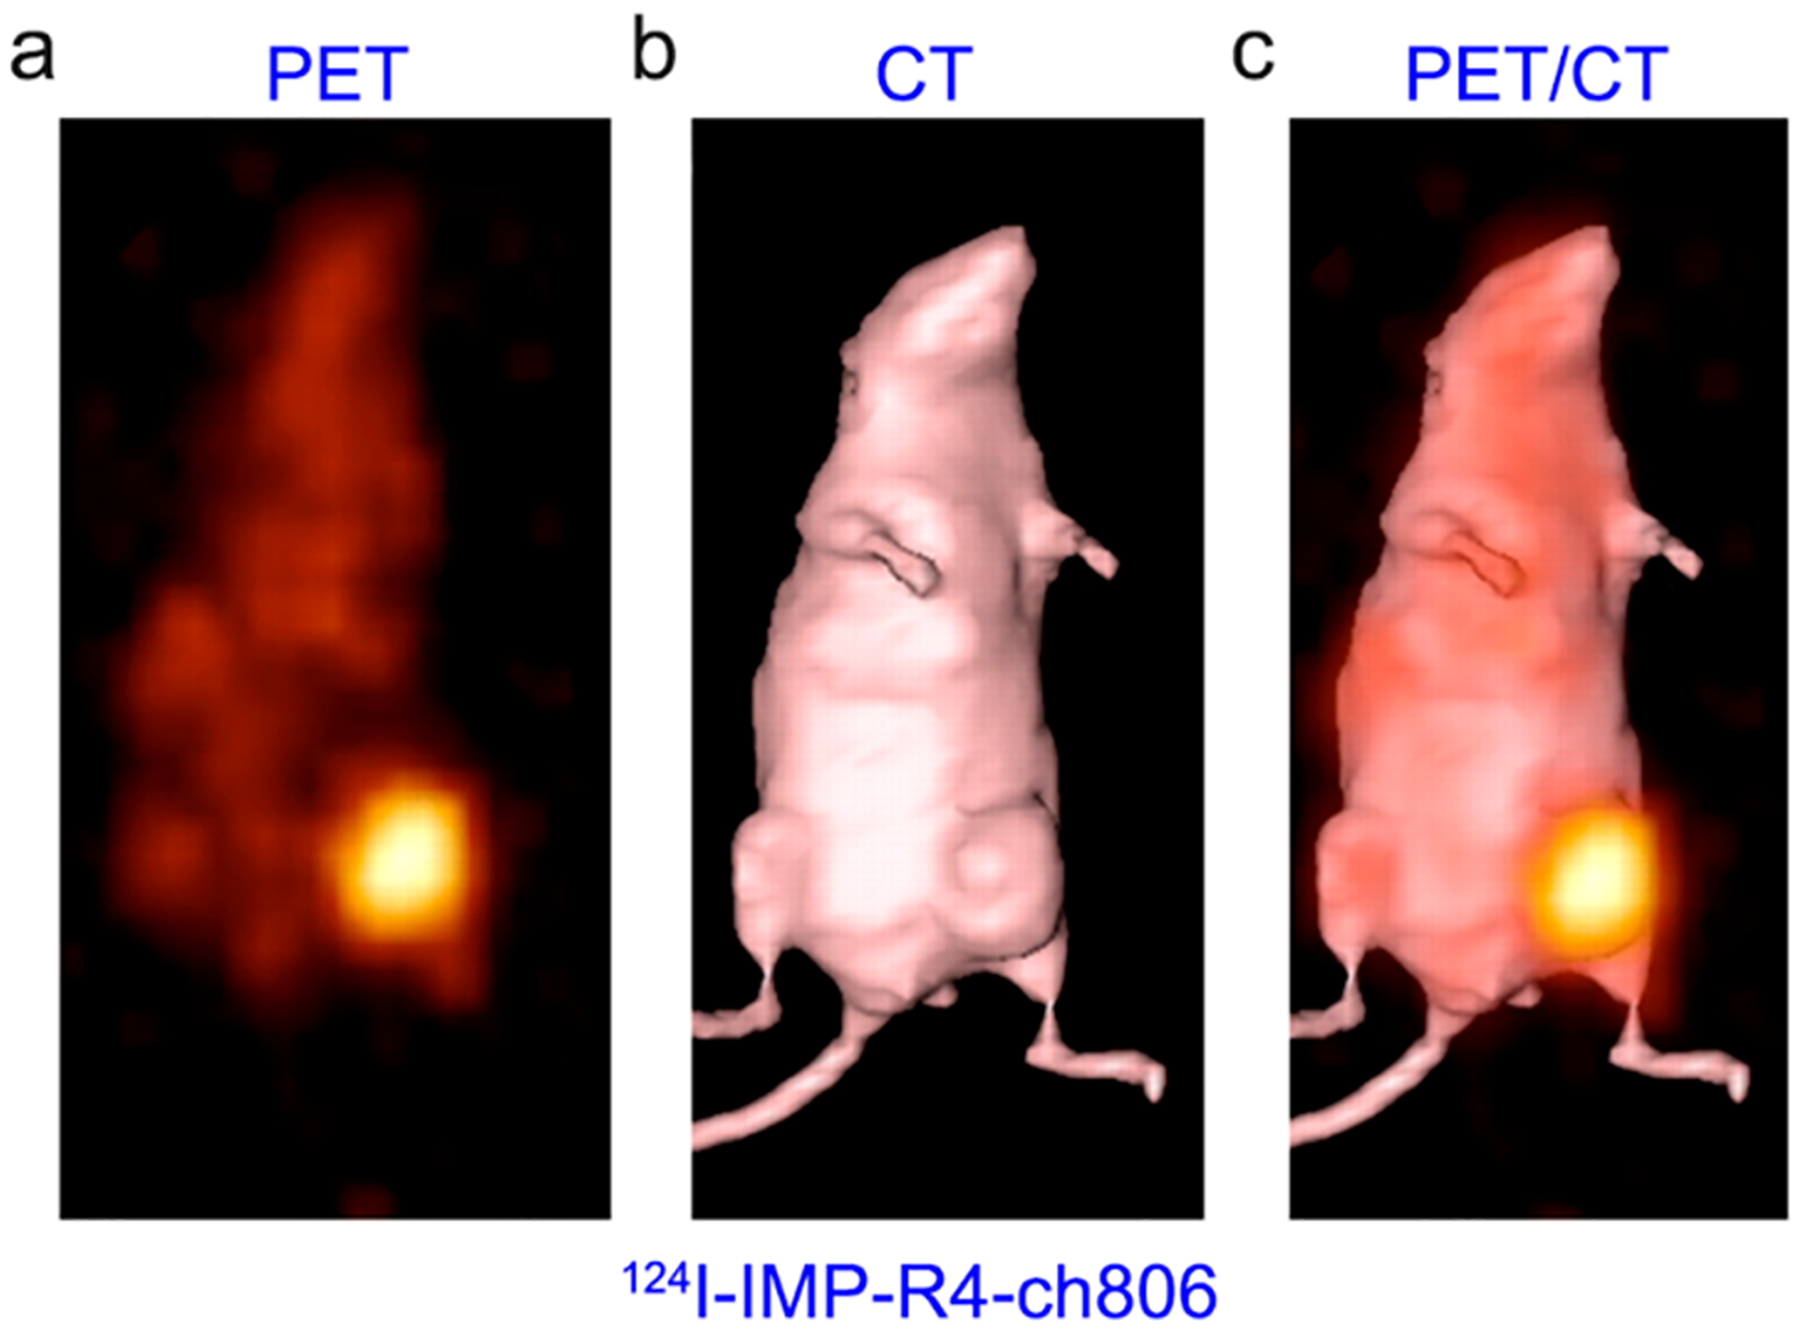
Immuno-positron emission tomography (immunoPET) is a paradigm-shifting molecular imaging modality combining the superior targeting specificity of monoclonal antibody (mAb) and the inherent sensitivity of PET technique. A variety of radionuclides and mAbs have been exploited to develop immunoPET probes, which has been driven by the development and optimization of radiochemistry and conjugation strategies. In addition, tumor-targeting vectors with a short circulation time (e.g., Nanobody) or with an enhanced binding affinity (e.g., bispecific antibody) are being used to design novel immunoPET probes. Accordingly, several immunoPET probes, such as 89Zr-Df-pertuzumab and 89Zr-atezolizumab, have been successfully translated for clinical use. By noninvasively and dynamically revealing the expression of heterogeneous tumor antigens, immunoPET imaging is gradually changing the theranostic landscape of several types of malignancies. ImmunoPET is the method of choice for imaging specific tumor markers, immune cells, immune checkpoints, and inflammatory processes. Furthermore, the integration of immunoPET imaging in antibody drug development is of substantial significance because it provides pivotal information regarding antibody targeting abilities and distribution profiles. Herein, we present the latest immunoPET imaging strategies and their preclinical and clinical applications. We also emphasize current conjugation strategies that can be leveraged to develop next-generation immunoPET probes. Lastly, we discuss practical considerations to tune the development and translation of immunoPET imaging strategies.


Conflict of interest statement

The authors declare no competing financial interest.

Figures

Figure 1.
Figure 1.
Schematic of representative antibody and antibody fragments. (a) Conventional IgG is composed of two identical heavy chains and two identical light chains. While each heavy chain consists of three constant domains (i.e., CH1, CH2, and CH3) and a variable domain (VH), an IgG light chain has one constant domain (CL) and one variable domain (VL). (b) Heavy-chain-only antibody (HCAb) lacks the light chains and the typical CH1 domain. (c) The antigen-binding specificity of a HCAb is due to the single VHH domain. (d) Single-chain variable fragment (scFv) is the smallest unit of the IgG molecule that retains antigen-binding capacity. Using scFv as the building block, (e) diabody (dimers of scFv), and (f) minibody (dimers of scFv–CH3) can be constructed.
Figure 2.
Figure 2.
Chemical structures of chelators used in 89Zr-labeling of antibody vectors.
Figure 3.
Figure 3.
Comparison DFO, DFO*, and DFOcyclo* in immunoPET imaging. (a) Chemical structure of DFOcyclo*-pPhe-NCS. (b) ImmunoPET imaging with 89Zr-DFO-trastuzumab (left), 89Zr-DFOcyclo*-trastuzumab (middle), and 89Zr-DFO*-trastuzumab (right) in HER2+ SKOV-3 models. The results showed bone uptake in mice injected with 89Zr-DFO-trastuzumab but not with 89Zr-DFOcyclo*-trastuzumab or 89Zr-DFO*-trastuzumab at 168 h after injection of the radiotracers. Reproduced with permission from ref . Copyright 2019 Springer Berlin Heidelberg under [CC LICENSE] [http://creativecommons.org/licenses/by/4.0/].
Figure 4.
Figure 4.
Chemical structures of chelators used in 64Cu-labeling of antibody vectors.
Figure 5.
Figure 5.
Chemical structures of chelators used in 86Y-labeling of antibody vectors.
Figure 6.
Figure 6.
Chemical structures of prosthetic groups and chelators in 18F-labeling of antibody vectors.
Figure 7.
Figure 7.
Chemical structures of chelators used in 68Ga-labeling of antibody vectors.
Figure 8.
Figure 8.
Site-specific radiolabeling strategies. (a) The maleimide–cysteine reaction is among the most commonly used strategies for site-specific radiolabeling of antibody vectors. R = chelator of interest. (b) The strain-promoted azide–alkyne cycloaddition (SPAAC) reaction. R1 = antibody of interest, R2 = chelator of interest. (c) The inverse electron demand Diels–Alder (IEDDA) cycloaddition reaction. R1 = chelator of interest, R2 = antibody of interest. It is worth noting that radiolabeling via the click chemistry reaction goes both ways.
Figure 9.
Figure 9.
Sortase-catalyzed site-specific labeling of antibody moieties. (a) For C-terminal labeling, the LPXTG motif is expressed at the C-terminus of the targeting vector (e.g., VHH and antibody fragment). (b) For N-terminal labeling, sortase recognition tag (i.e., LPXTG) is positioned at the C-terminus of the modification (e.g., chelator and dye) with the oligoglycine nucleophile inserted at the N-terminus of the targeting vector.
Figure 10.
Figure 10.
Schematic of a chemoenzymatic methodology for site-specifically grafting cargoes (e.g., chelator) to the heavy-chain glycans of an antibody of interest. Reproduced with permission from ref . Copyright 2016 American Chemical Society.
Figure 11.
Figure 11.
Chemical structures of DOTA-HSG and NOTA-HSG hapten peptides used in pretargeted immunoPET imaging.
Figure 12.
Figure 12.
ImmunoPET imaging of EGFR expression using 124I-labeled residualizing radiotracer. (a–c) 124I-IMP-R4-ch806 immuno-PET imaging clearly delineated EGFR-positive gliomas with negligible uptake in normal tissues. Reproduced with permission from ref . Copyright 2010 SNMMI.
Figure 13.
Figure 13.
ImmunoPET imaging of HER2 expression. (a) T1-weighed MR imaging of a 46-year-old woman showed brain metastases from breast cancer (red arrows). (b–d) 89Zr-Dfpertuzumab immunoPET/CT imaging of the same patient demonstrated varying uptake of the radiotracer in brain metastases (red arrows) and minimal uptake in the superior sagittal sinus (red arrowhead). Reproduced with permission from ref . Copyright 2018 SNMMI. (e) Chemical structure of [18F]AlF-NOTA-Tz-TCOGK-2Rs15d. (f) ImmunoPET/CT imaging of a human ovarian cancer xenograft at 2 and 3 h after injection of [18F]AlF-NOTA-Tz-TCOGK-2Rs15d. Reproduced with permission from ref . Copyright 2018 American Chemical Society.
Figure 14.
Figure 14.
ImmunoPET imaging of HER3 expression. (a) MSB0010853 is composed of two Nanobodies targeting two different epitopes of HER3 and an additional Nanobody targeting albumin. (b) 89Zr-MSB0010853 immunoPET imaging of HER3-positive mouse xenografts (H441 and FaDu) and HER3-negative mouse xenograft (Calu-1) demonstrated the ability of this imaging approach to reveal varying HER3 expression levels. Reproduced with permission from ref . Copyright 2017 SNMMI.
Figure 15.
Figure 15.
ImmunoPET imaging of PDGFRa expression using 64Cu-NOTA-D13C6. While lower uptake of 64Cu-NOTA-D13C6 was seen in the PDGFRα-negative B-CPAP tumor (left flank), higher accumulation of the radiotracer was observed in the transfected PDGFRα-positive B-CPAP tumor (right flank) at late time-points. Reproduced with permission from ref . Copyright 2018 Elsevier Inc.
Figure 16.
Figure 16.
ImmunoPET imaging of non-Hodgkin’s lymphomas. (a) In a patient with circulating CD20+ lymphocytes, significant uptake of 89Zr-rituximab was observed in the spleen, which was blocked by preloading with unlabeled rituximab (250 mg/m2) prior to injection of 89Zr-rituximab. The spleen is indicated with black arrows. (b) In the same patient, preloading reduced 89Zr-rituximab uptake in the involved lymph nodes (white arrows), but enhanced uptake of the radiotracer in the visceral lesions (blue arrows). Reproduced with permission from ref . Copyright 2015 Springer Berlin Heidelberg.
Figure 17.
Figure 17.
ImmunoPET imaging of CD38 expression. (a) 89Zr-DFO-daratumumab immunoPET/CT imaging of a mouse bearing bilateral MM1.S tumors (T1 and T2). (b) 89Zr-DFO-daratumumab immuno-PET/CT imaging of a mouse bearing a unilateral MM1.S tumor (T3) in the presence of unlabeled daratumumab as a blocking agent. (c) Representative bioluminescence imaging of the mice in the blocking group receiving an injection of cold daratumumab. The bioluminescent signal indicates the successful establishment of the tumor on the right flank of the mouse. Reproduced with permission from ref . Copyright 2018 SNMMI. (d) 89Zr-DFO-daratumumab immunoPET imaging of lymphoma (Ramos tumor) at 120 h after administration of the tracer. Reproduced with permission from ref . Copyright 2018 Springer Berlin Heidelberg.
Figure 18.
Figure 18.
ImmunoPET probes targeting CD146 and CD105. (a) ImmunoPET and (b) near-infrared fluorescence (NIRF) imaging performed at different time-points after intravenous injection of 89Zr-Df-YY146-ZW800 demonstrated prominent and persistent uptake of the tracer in HepG2 tumors but not in the YY146 blocking group. H (heart), L (liver), and T (tumor). (c) Clear delineation of orthotopic HepG2 tumors by both PET and NIRF imaging was enabled through 89Zr-Df-YY146-ZW800, which further facilitated image-guided resection of the multiple tumors (red and yellow arrows). Reproduced with permission from ref . Copyright 2016 Ivyspring International Publisher. (d) Serial coronal immunoPET imaging using a tissue factor and CD105 dual-targeting 64Cu-NOTA-heterodimer at 3, 15, 24, and 30 h postinjection of the tracer clearly detected the BxPC-3 tumor. (e) Coronal PET images of mice bearing an orthotopic BxPC-3 tumor at 3, 15, 24, and 30 h following injection of 64Cu-NOTA-heterodimer. This imaging technique realized an easy diagnosis of the orthotopic BxPC-3 tumor with negligible radioactivity around the surrounding tissues. Reproduced with permission from ref . Copyright 2016 American Association for Cancer Research.
Figure 19.
Figure 19.
Pretargeted immunoPET imaging of pancreatic cancer. 5B1-TCO was first administered to target CA19.9-expressing orthotopic Capan-2 xenograft followed by injection of 64Cu-NOTAPEG7-Tz 3 days after the previous injection. (a) Coronal and (b) maximum-intensity projection (MIP) images demonstrated that this pretargeted imaging approach clearly delineated the Capan-2 tumor.(c) Immunohistochemistry (top left), autoradiography (bottom left), and fused PET/CT image (right) from the same mouse further showed precise colocalization of CA19.9-expressing tumor cells and 64Cu-NOTA-PEG7-Tz. Reproduced with permission from ref . Copyright 2016 SNMMI.
Figure 20.
Figure 20.
ImmunoPET imaging of ovarian cancers with a bispecific radiotracer 89Zr-DFO-REGN4018. (a) 89Zr-DFO-REGN4018 immunoPET/CT imaging of humanized tumor-bearing mice showed the distribution of the tracer to the spleen (yellow arrow), lymph nodes (green arrow), and tumor (red arrow). (b) Blocking with a MUC16 parental antibody reduced the tumor uptake of 89Zr-DFO-REGN4018 without influencing the spleen and lymph node uptake. (c) Blocking with an anti-CD3 antibody substantially reduced the spleen and lymph node uptake of 89Zr-DFO-REGN4018 without influencing the tumor uptake. Reproduced with permission from ref . Copyright 2019 American Association for the Advancement of Science.
Figure 21.
Figure 21.
ImmunoPET imaging of prostate cancers with the minibody-based 89Zr-IAB2M. (a) 99mTc-MDP bone scan of a PCa patient showed multiple metastatic lesions in ribs, vertebrae, and left femur. (b) An 18F-FDG PET scanning showed the lesion in the left femur but failed to clearly detect the vertebral lesions. (c) 89Zr-IAB2M immunoPET imaging of the same patient detected more lesions than either conventional imaging modalities. Reproduced with permission from ref . Copyright 2016 SNMMI.
Figure 22.
Figure 22.
Pretargeted immunoPET imaging of metastatic colorectal cancers. (a) In this approach, CEA- and HSG-targeting BsAb TF2 was given first to saturate the LS174T tumors, followed by administration of DOTA- and HSG-containing 68Ga-IMP288 16 h later. This imaging approach clearly delineated tumors, except for two small tumor lesions (T3 and T6). Bladder (BL) uptake indicates excellent excretion of the 68Ga-IMP288 through the urinary system. (b) 18FFDG PET/CT imaging of the same mouse showed less optimal image contrast due to uptake in the intestines. Reproduced with permission from ref . Copyright 2012 Springer Nature.
Figure 23.
Figure 23.
ImmunoPET imaging of solid tumors using 89Zr-CEAIL2v. 89Zr-CEA-IL2v immunoPET imaging of a patient with CEA+ colorectal cancer at cycle 1, day 5 (left) showed uptake of the radiotracer in the bilateral hilar lymph nodes and the left dorsal lung metastasis (white arrows). The uptake in these malignant lesions and a nonpathological lymph node (red arrows) decreased after the fourth cycle of CEA-IL2v treatment (right). Notably, uptake in the liver (yellow arrows) increased and uptake in the spleens (orange arrows) decreased following the treatments. Reproduced with permission from ref . Copyright 2018 Impact Journals, LLC.
Figure 24.
Figure 24.
ImmunoPET imaging of clear cell renal cell carcinoma (ccRCC) with 89Zr-girentuximab. (a) A patient with ccRCC who previously had undergone nephrectomy was subjected to a CT scan that showed neoplasms in the right kidney and the adjacent adrenal (white circle). (b) 89Zr-girentuximab immunoPET/CT imaging of the same patient showed that both the lesions had an uptake of the tracer. Additional uptake in the proximal radius was seen (insert), which changed the management strategy of the patient from a futile radical nephrectomy to radiotherapy. Reproduced with permission from ref . Copyright 2018 European Association of Urology.
Figure 25.
Figure 25.
ImmunoPET imaging of cancer stem cell markers. (a) Chemical structure of a novel chelator L5-NCS. (b) 64Cu-L5-7F5 immunoPET imaging clearly detected PSCA-expressing PC3 tumor 2 days after injection of the tracer. (c) In comparison, 64Cu-NODAGA-7F5 showed much lower tumor uptake and higher liver uptake. Reproduced with permission from ref . Copyright 2018 American Chemical Society.
Figure 26.
Figure 26.
Pretargeted immunoPET imaging of colorectal cancers. (a) Schematic of the imaging strategy, in which huA33-TCO was first administered to accumulate in the tumor followed by injection of 64Cu-Tz-SarAr 24 h later. (b) Coronal image and (c) fused PET/CT images 24 h postinjection of the radioligand showed the effective delineation of the subcutaneous SW1222 xenografts. Reproduced with permission from ref . Copyright 2015 American Chemical Society.
Figure 27.
Figure 27.
ImmunoPET imaging of immune checkpoints in nonsmall-cell lung cancer (NSCLC). (a) 18F-FDG PET/CT scan of a patient with NSCLC showed lung tumors and mediastinal lymph node metastases with high glucose metabolism. (b) PD-1-specific 89Zr-Dfnivolumab immunoPET/CT imaging demonstrated heterogeneous uptake of the radiotracer within and between the tumor lesions. (c) Similarly, heterogeneous uptake of PD-L1-specific 18F-BMS-986192, a 18F-labeled adnectin protein, was seen within and between the tumor lesions. Reproduced with permission from ref . Copyright 2018 Springer Nature.
Figure 28.
Figure 28.
ImmunoPET imaging of programmed death-ligand 1 (PDL1) in brown adipose tissue (BAT). B3 is a single domain antibody specific for mouse PD-L1 and (a) 18F-B3 immunoPET/CT imaging of a 6-week-old wild-type C57BL/6 mouse showed deposition of the radiotracer in the BAT. (b) 18F-B3 immunoPET/CT imaging of an age-matched PD-L1 knockout mouse showed the absence of PD-L1 signal in the BAT, confirming the specificity of the developed radiotracer. Reproduced with permission from ref . Copyright 2017 Springer Nature.
Figure 29.
Figure 29.
ImmunoPET imaging of rheumatoid arthritis (RA). (a) 89Zr-28H1 immunoPET/CT imaging of a mouse with collagen-II-induced arthritis 72 h after injection of the radiotracer. 89Zr-28H1 accumulated in the inflamed joints with high contrast. (b) 18F-FDG PET/CT imaging also showed uptake in the inflamed joints but the uptake was lower than that of 89Zr-28H1. Reproduced with permission from ref . Copyright 2015 SNMMI.
Figure 30.
Figure 30.
ImmunoPET imaging of inflammatory bowel disease (IBD). (a) 89Zr-a-IL-1b, (b) 89Zr-α-CD11b immunoPET imaging, and (c) conventional 18F-FDG PET imaging all detected dextran sulfate sodium (DSS)-induced colonic inflammations, which was indicated by uptake in the colons. Reproduced with permission from ref . Copyright 2019 SNMMI. (d) 89Zr-malDFO-GK1.5 cDb, an immunoPET probe targeting mouse CD4, was used to image IBD by capturing CD4+ T cells. Ex vivo 89Zr-malDFO-GK1.5 cDb immunoPET imaging showed increased radiotracer concentration in the DSS-treated colons, ceca, and mesenteric lymph nodes (MLNs).(e) Corresponding gross specimens obtained from the normal mice and from the colitic mice. Note that colons of the DSS-treated mice were shorter than that of the control mice. Reproduced with permission from ref . Copyright 2018 SNMMI.
Figure 31.
Figure 31.
Representative immunoPET/MR imaging of a patient with diffuse intrinsic pontine glioma after convection-enhanced delivery of 124I-8H9. The axial (upper sections) and sagittal (lower sections) fused PET/MR images showed predominant retention of 124I-8H9 in the brainstem. In this case, 124I-8H9 servers as a theranostic agent allowing for concurrent imaging, dosimetry, and therapy. Reproduced with permission from ref . Copyright 2018 Elsevier Inc.
Figure 32.
Figure 32.
ImmunoPET imaging guides antibody drug development. (a) Trastuzumab-Lx-AF is an antibody–drug conjugate developed by linking trastuzumab with auristatin F (AF) via the linker Lx. To evaluate the influence of drug-to-antibody ratios (DARs), 89Zr-DFO-trastuzumab-Lx-AF immunoPET/CT imaging was carried out at 96 h postinjection of the radiotracer. The imaging results demonstrated the varying stabilities of the Lx-based ADCs. Importantly, a DAR of 2.6 did compromise the tumor targeting. (b) Biodistribution studies further confirmed the immunoPET imaging results (black bars, DAR of 0; red bars, DAR of 2.6; blue bars, DAR of 5.2; *, P < 0.05). Reproduced with permission from ref . Copyright 2018 SNMMI.

References

    1. Mankoff DA A definition of molecular imaging. J. Nucl. Med 2007, 48, 18N–21N. - PubMed
    1. Ametamey SM; Honer M; Schubiger PA Molecular imaging with PET. Chem. Rev 2008, 108, 1501–1516. - PubMed
    1. James ML; Gambhir SS A molecular imaging primer: modalities, imaging agents, and applications. Physiol. Rev 2012, 92, 897–965. - PubMed
    1. Rahmim A; Lodge MA; Karakatsanis NA; Panin VY; Zhou Y; McMillan A; Cho S; Zaidi H; Casey ME; Wahl RL Dynamic whole-body PET imaging: principles, potentials and applications. Eur. J. Nucl. Med. Mol. Imaging 2019, 46, 501–518. - PubMed
    1. Scott AM; Wolchok JD; Old LJ Antibody therapy of cancer. Nat. Rev. Cancer 2012, 12, 278–287. - PubMed

Publication types

MeSH terms