. 2020 May 28;29(8):1319-1329.
doi: 10.1093/hmg/ddaa047.

Metabolomics hallmarks OPA1 variants correlating with their in vitro phenotype and predicting clinical severity

Affiliations

Metabolomics hallmarks OPA1 variants correlating with their in vitro phenotype and predicting clinical severity

Juan Manuel Chao de la Barca et al. Hum Mol Genet. .

Abstract

Interpretation of variants of uncertain significance is an actual major challenge. We addressed this question on a set of OPA1 missense variants responsible for variable severity of neurological impairments. We used targeted metabolomics to explore the different signatures of OPA1 variants expressed in Opa1 deleted mouse embryonic fibroblasts (Opa1-/- MEFs), grown under selective conditions. Multivariate analyses of data discriminated Opa1+/+ from Opa1-/- MEFs metabolic signatures and classified OPA1 variants according to their in vitro severity. Indeed, the mild p.I382M hypomorphic variant was segregating close to the wild-type allele, while the most severe p.R445H variant was close to Opa1-/- MEFs, and the p.D603H and p.G439V alleles, responsible for isolated and syndromic presentations, respectively, were intermediary between the p.I382M and the p.R445H variants. The most discriminant metabolic features were hydroxyproline, the spermine/spermidine ratio, amino acid pool and several phospholipids, emphasizing proteostasis, endoplasmic reticulum (ER) stress and phospholipid remodeling as the main mechanisms ranking OPA1 allele impacts on metabolism. These results demonstrate the high resolving power of metabolomics in hierarchizing OPA1 missense mutations by their in vitro severity, fitting clinical expressivity. This suggests that our methodological approach can be used to discriminate the pathological significance of variants in genes responsible for other rare metabolic diseases and may be instrumental to select possible compounds eligible for supplementation treatment.


Figures

Figure 1
Figure 1
First principal plan of the PCA. When samples are projected into the first principal component (PC1) different isoforms are well separated according to their proximity to Opa1+/+ (black circles) or Opa1−/− (red circles) which have opposite coordinates in PC1 and represent normal and totally deleted Opa1 gene, respectively. Two subgroups are less well separated though: transfected human normal isoform (ISO1, gray circles) from I382M (blue circles) variant and R445H (brown circles) variant from totally deleted murine Opa1−/− MEF. When projecting samples into the second PC (PC2) non-transfected MEF (Opa1+/+ and Opa1−/−) cannot be separated from each other but plot far away from the projection of transfected MEFs in PC2, indicating a possible effect of transfection. Samples transfected with D603H and G439V isoforms have been represented as green and pink circles, respectively.
Figure 2
Figure 2
Volcano plot (loadings versus VIP) from the OPLS-DA model comparing murine Opa1+/+ and Opa1−/− MEF. Only most important metabolites, i.e. those with VIP ≥ 1, have been labelled. Negative loadings indicate relatively decreased metabolite concentrations in Opa1−/− compared to Opa1+/+ MEF. Main features of the metabolomic signature are decreased level in Opa1−/− MEF of many dialkyl and acyl-alkyl (PC aa and PC ae) phosphatidylcholine species (orange bubbles), almost all amino acids (green bubbles), some biogenic amines (blue bubbles) including spermidine, trans-hydroxyproline (t4-OH-Pro), taurine and methionine-sulfoxide (Met-SO) along with lysophosphatidylcholines (lysoPC, brown bubbles) with acyl chain length of less than 22 carbons. On the other side, many sphingomyelins (SM, yellow bubbles), mainly hydroxylated (SM(OH)), some phosphatidylcholine species, the highest order polyamine spermine and lysophosphatidylcholines species with acyl chain with more than 22 carbons were found increased in Opa1−/− compared to Opa1+/+ MEF. Glutamine was the only amino acid relatively increased in Opa1−/− MEF. Legend: Ala, alanine; Asn, asparagine; Asp, aspartate; Gln, glutamine; Gly, glycine; His, histidine; Ile, isoleucine; Met, methionine; Phe, phenylalanine; Pro, proline; Ser, serine; Thr, threonine; Trp, tryptophan; Val, valine. For phosphatidylcholines, the sum of the length of the two acyl or acyl–alkyl groups is noted after the C and is followed by the number of double bonds. The same notation is used for representing the length and the number of double bonds in the acyl chain of sphingomyelins and lysophosphatidylcholines.
Figure 3
Figure 3
Scatter plots of the PCA first principal plan (A) and the Spearman correlation coefficient (ρ) versus VIP (B) comparing MEF metabolomes transfected with five human OPA1 variants. (A) Out of 5, 4 groups are easily distinguishable in the first principal component (PC1): ISO1- I382M, D603H, G439B and R445H. No group discrimination can be seen in the second principal component (PC2). (B) Spearman correlation coefficients (ρ) where obtained from the non-parametric correlation between sample’s scores in the first principal component or t1 in (A) and each metabolite concentration whilst VIP comes from the OPLS model. Only most important metabolites, i.e. those with VIP ≥ 1, have been labelled. For a given metabolite, negative values of ρ indicate negative correlation between its concentration and t1 (i.e. metabolite concentration are relatively close to Opa1+/+ MEF concentration and relative far from Opa1−/− MEF concentration) whilst a positive ρ value indicates the opposite situation (i.e. metabolite concentration are relatively close to Opa1−/− MEF concentration and relative far from Opa1+/+ MEF concentration. Main features of the metabolomic signature are decreased level of many dialkyl and acyl-alkyl (PC aa and PC ae) phosphatidylcholine species (orange bubbles), almost all amino acids (green bubbles), some biogenic amines (blue bubbles) including taurine, putrescine, trans-4-hydroxyproline (t4-OH-Pro) and methionine-sulfoxide (Met-SO) along with three lysophosphatidylcholines (lysoPC, brown bubbles) and two sphingomyelins (SM, yellow bubbles). On the other side, four sphingomyelins (SM, yellow bubbles), two of them hydroxylated (SM(OH)), some phosphatidylcholine species and the highest order polyamine spermine were found to increase while approaching the metabolomic signature of Opa1−/−. Legend: Ala, alanine; Arg, arginine; Asn, asparagine; Asp, aspartate; Gly, glycine; His, histidine; Ile, isoleucine; Leu, leucine; Lys, lysine; Met, methionine; Phe, phenylalanine; Pro, proline; Ser, serine; Thr, threonine; Trp, tryptophan; Ser, serine; Val, valine. For phosphatidylcholines, the sum of the length of the two acyl or acyl–alkyl groups is noted after the C and is followed by the number of double bonds. The same notation is used for representing the length and the number of double bonds in the acyl chain of sphingomyelins and lysophosphatidylcholines.
Figure 4
Figure 4
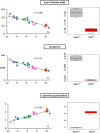
Regression and box plots for polar metabolites. Relative metabolite concentrations for the sum of amino acids (upper panel), trans-4-hydroxyproline (t4-OH-Pro) (middle panel) and the ratio spermine to spermidine (downer panel) have been linearly regressed with t1 (scores of PC1 of the PCA for transfected cells) (left) or represented as a box plots for Opa1+/+ and Opa1−/− MEFs (right). In MEFs transfected with human isoforms of OPA1 gene, regression lines have been drawn along with their respective determination coefficients (R2). Amino acid and t4-OH-Pro linearly decrease whilst spermine synthase activity, measured by spermine/spermidine ratio, linearly decreases with t1 (i.e. when metabolic phenotype approaches Opa1−/− and get far away from Opa1−/− phenotypes). These changes are obviously verified in Opa1+/+ and Opa1−/− MEFs. In regression plots, the following color code has been used: ISO1 (gray); I382M (blue); D603H (green); G439V (pink) and R445H (brown). In box plots Opa1+/+ (WT) box has been colored in dark gray whilst red was used for Opa1−/− boxes.
Figure 5
Figure 5
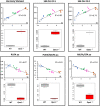
Regression and box plots for lipid metabolites. Upper panels: relative metabolite concentrations for hydroxy sphingomyelins SM OH 22:1 and SM OH 22:2 (upper middle and right panels, respectively) and the ratio between octadecanoyl (SM 18:0) and hexadecanoyl (SM 16:0) sphingomyelins (upper left panel) have been linearly regressed with t1 (scores of PC1 of the PCA for transfected cells) or represented as box plots for Opa1+/+ and Opa1−/− MEFs (bottom position in each panel). As for polar metabolites, in MEFs transfected with human isoforms of OPA1 gene, regression lines have been drawn along with their respective determination coefficients (R2). There exists a clear parallel increasing between the two structurally close related SM OH 22:1 and SM OH 22:2 and t1. Also, the proportion of SM 18:0 seems to increase when the metabolic phenotype approaches that of Opa1−/− compared to the concentration of SM 16:0. Bottom panels: the sum of polyunsaturated diacyl phosphatidylcholines (PUFA aa) (bottom left) and the ratios between PUFA aa and monounsaturated diacyl phosphatidylcholines (PUFA/MUFA aa) (bottom middle) and between monounsaturated and saturated fatty acids in the alkyl-acyl family (MUFA/SFA ae) (bottom right) decrease linearly with t1. As expected these changes are verified in Opa1+/+ (WT) and Opa1−/− MEFs. In regression plots, the following color code has been used: ISO1 (gray); I382M (blue); D603H (green); G439V (pink) and R445H (brown). In box plots Opa1+/+ (WT) box has been colored in dark gray whilst red was used for Opa1−/− boxes.

Similar articles

Cited by

References

    1. Ferré M., Caignard A., Milea D., Leruez S., Cassereau J., Chevrollier A., Amati-Bonneau P., Verny C., Bonneau D., Procaccio V. and Reynier P. (2015) Improved locus-specific database for OPA1 mutations allows inclusion of advanced clinical data. Hum. Mutat., 36, 20–25. - PubMed
    1. Le Roux B., Lenaers G., Zanlonghi X., Amati-Bonneau P., Chabrun F., Foulonneau T., Caignard A., Leruez S., Gohier P., Procaccio V. et al. (2019) OPA1: 516 unique variants and 831 patients registered in an updated centralized Variome database. Orphanet J. Rare Dis., 14, 214. - PMC - PubMed
    1. Olichon A., Baricault L., Gas N., Guillou E., Valette A., Belenguer P. and Lenaers G. (2003) Loss of OPA1 perturbates the mitochondrial inner membrane structure and integrity, leading to cytochrome c release and apoptosis. J. Biol. Chem., 278, 7743–7746. - PubMed
    1. Olichon A., Elachouri G., Baricault L., Delettre C., Belenguer P. and Lenaers G. (2007) OPA1 alternate splicing uncouples an evolutionary conserved function in mitochondrial fusion from a vertebrate restricted function in apoptosis. Cell Death Differ., 14, 682–692. - PubMed
    1. Zanna C., Ghelli A., Porcelli A.M., Karbowski M., Youle R.J., Schimpf S., Wissinger B., Pinti M., Cossarizza A., Vidoni S. et al. (2008) OPA1 mutations associated with dominant optic atrophy impair oxidative phosphorylation and mitochondrial fusion. Brain, 131, 352–367. - PubMed

Publication types