Cyclin B1 scaffolds MAD1 at the kinetochore corona to activate the mitotic checkpoint
- PMID: 32202322
- PMCID: PMC7298293
- DOI: 10.15252/embj.2019103180
Cyclin B1 scaffolds MAD1 at the kinetochore corona to activate the mitotic checkpoint
Abstract
Cyclin B:CDK1 is the master kinase regulator of mitosis. We show here that, in addition to its kinase functions, mammalian Cyclin B also scaffolds a localised signalling pathway to help preserve genome stability. Cyclin B1 localises to an expanded region of the outer kinetochore, known as the corona, where it scaffolds the spindle assembly checkpoint (SAC) machinery by binding directly to MAD1. In vitro reconstitutions map the key binding interface to a few acidic residues in the N-terminal region of MAD1, and point mutations in this sequence abolish MAD1 corona localisation and weaken the SAC. Therefore, Cyclin B1 is the long-sought-after scaffold that links MAD1 to the corona, and this specific pool of MAD1 is needed to generate a robust SAC response. Robustness arises because Cyclin B1:MAD1 localisation loses dependence on MPS1 kinase after the corona has been established, ensuring that corona-localised MAD1 can still be phosphorylated when MPS1 activity is low. Therefore, this study explains how corona-MAD1 generates a robust SAC signal, and it reveals a scaffolding role for the key mitotic kinase, Cyclin B1:CDK1, which ultimately helps to inhibit its own degradation.
Keywords: MAD; Cyclin B1; RZZ complex; kinetochore corona; spindle assembly checkpoint.
© 2020 The Authors. Published under the terms of the CC BY 4.0 license.
Conflict of interest statement
The authors declare that they have no conflict of interest.
Figures
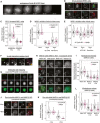
- A
Endogenous Cyclin B1‐YFP localisation during mitosis live in RPE1 cells (still from Movie EV1).
- B, C
Immunofluorescence images (B) and quantifications (C) of relative Cyclin B1 and MAD1 levels at unattached and attached kinetochores in cells arrested in STLC. Each dot represents a kinetochore, and data are from 40 kinetochore pairs (13 cells, max 5 kinetochore pairs/cell).
- D, E
Quantification of relative kinetochore intensities of Cyclin B1 and MAD1 in nocodazole‐arrested cells (noco) treated with the MPS1 inhibitors, AZ‐3146 (5 μM) or reversine (500 nM), either before (D) or after (E) mitotic entry.
- F
Immunofluorescence images of LacI‐MAD1 and Cyclin B1 in U2OS cells containing a LacO arrays on chromosome 1.
- G
Live imaging of Cyclin B1‐mCherry (CycB1‐mCh) in LacO‐U2OS cells transfected with LacI‐MAD1‐FL (full length: aa 1–718) or various LacI‐MAD1 truncations (amino acid numbers indicated).
- H, I
Immunofluorescence images (H) and quantifications (I) of Cyclin B1 and MAD1 kinetochore levels in control (MAD1‐WT) or MAD1β HeLa cells (two independent clones: C13 and C24) treated with nocodazole.
- J, K
Immunofluorescence images (J) and quantification (K) of Cyclin B1 and MAD1 kinetochore localisation in doxycycline‐inducible MAD1α and MAD1β knockouts treated with or without dox for 10 days and then arrested in nocodazole. Cells were selected that had full MAD1 knockout in the doxycycline treatment (this constituted approximately 30% of cells).
- L
Relative kinetochore volumes occupied by Cyclin B1 and MAD1 (relative to CENP‐C) in nocodazole‐arrested MAD1α and MAD1β cells (calculated from experiments shown in (H, I).
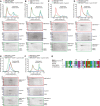
Elution profiles and SDS–PAGE for SEC runs on the indicated column of the Cyclin B1:CDK1 complex (blue profile), MBP‐MAD1:MAD2 (red) and their combination (green). Note that the same Cyclin B1:CDK1 elution profile and SDS–PAGE are also displayed as reference in panels (D and F) to improve clarity. For the same reason, the MBP‐MAD1:MAD2 elution profile and SDS–PAGE are also displayed in panels (A–C).
Elution profiles and SDS–PAGE for SEC runs on the indicated column of CDK1 (blue), MBP‐MAD1:MAD2 (red) and their combination (green).
Elution profiles and SDS–PAGE for SEC runs on the indicated column of Cyclin B1 (blue), MBP‐MAD1:MAD2 (red) and their combination (green).
Elution profiles and SDS–PAGE for SEC runs of the Cyclin B1:CDK1 complex (blue), MBP‐MAD1∆93:MAD2 (green) and their combination (red).
Elution profiles and SDS–PAGE for SEC runs of the Cyclin B1:CDK1 complex (blue), MBP‐MAD11–92‐SNAP (red) and their combination (green).
Elution profiles and SDS–PAGE for SEC runs of Cyclin B1:CDK1 (blue), MBP‐MAD13EK:MAD2 (E52K, E53K and E56K mutations; red) and their combination (green). In (A‐D), individual potential binding partners were combined at a concentration of 5 μM.
Alignment of the N‐terminal region of Cyclin B1 that contains the MAD1‐binding region. Numbering refers to the human MAD1 sequence. *conserved, negatively charged residues in MAD1 (E52K, E53K and E56K) required for MAD1:Cyclin B1 interaction.
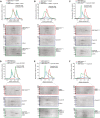
- A–F
Elution profiles and SDS–PAGE for SEC runs on the indicated columns of (A) CDK1 (blue), MBP‐MAD11–92‐SNAP (red; note that the same elution profile and SDS–PAGE are also displayed as reference in panel (B) and in Fig 2E to improve clarity) and their combination (green); (B) Cyclin B1 (blue), MBP‐MAD11–92‐SNAP (red) and their combination (green). Asterisks in (A and B) indicate free MBP, a byproduct of the MBP‐MAD11–92‐SNAP purification; (C) Cyclin B1:CDK1 (blue; note that the same elution profile and SDS–PAGE are also displayed as reference in panel (D) and in Fig 2E to improve clarity), MBP‐MAD141–92 (red) and their combination (green); (D) Cyclin B1:CDK1 (blue), MBP‐MAD160–92 (red) and their combination (green); (E) Cyclin B1:CDK1 (blue), MBP‐MAD141–62 (red; note that the same elution profile and SDS–PAGE are also displayed as reference in panel F to improve clarity) and their combination (green). (F) Cyclin B1 (blue), MBP‐MAD141–62 (red) and their combination (green). In all experiments, proteins were combined at 5 μM concentration.

- A
Western blot analysis of indicated vsv‐MAD1‐WT or 3EK HeLa clones treated with or without doxycycline for 10 days.
- B
Immunofluorescence images showing MAD1 and ZW10 kinetochore levels in nocodazole‐arrested MAD1‐WT‐C13 and 3EK‐C14 just after nuclear envelope breakdown (early prometaphase) or later in mitosis when the chromatin is condensed (late prometaphase). Note that early and late prometaphase was defined based on the level of chromatin condensation.
- C, D
Relative kinetochore volumes occupied by MAD1 (C) and ZW10 (D) (relative to CENP‐C) in MAD1‐WT and MAD1‐3EK cells in early and late prometaphase.
- E
Quantification of MAD1 kinetochore intensity from indicated MAD1‐WT and 3EK clones treated as in (B).

Western blot analysis of indicated YFP‐MAD1‐WT and YFP‐MAD1‐3EK clones treated with doxycycline.
Immunofluorescence images showing MAD1 and ZW10 kinetochore levels in nocodazole‐arrested YFP‐MAD1‐WT‐C19 and 3EK‐C6 cells just after nuclear envelope breakdown (early prometaphase—EPM) or later in mitosis when the chromatin is condensed (late prometaphase—LPM). Scale bars = 5 μM.
Quantification of MAD1 kinetochore localisation from cells treated as in (B). In all kinetochore intensity graphs, each dot represents a cell, horizontal lines indicate the median, and vertical bars show the 95% confidence interval. Note, when these vertical bars do not overlap, the difference is considered statistically significant at a level of at least P < 0.05 (see Materials and Methods). The graph displays data that are relative to the early prometaphase controls, which are normalised to 1. The mean level of the normalised controls is indicated by the dotted lines. Sixty cells from 3 experiments.

- A–C
Immunofluorescence images (A) and quantifications (B, C) of relative MAD1 and MAD2 kinetochore levels in indicated cells lines arrested in nocodazole and treated with/without AZ‐3146 for 30 min to inhibit MPS1. In all kinetochore intensity graphs, each dot represents a cell, horizontal lines indicate the median, and vertical bars show the 95% confidence interval. Note, when these vertical bars do not overlap, the difference is considered statistically significant at a level of at least P < 0.05 (see Materials and Methods). All kinetochore intensity graphs display data that is relative to WT C11 controls in nocodazole, which are normalised to 1. The mean level of the normalised controls is indicated by the dotted lines. Thirty cells from 3 experiments. Scale bars = 5 μM.
- D
Duration of mitotic arrest in indicated cell lines arrested in nocodazole and then treated with 1.25 μM AZ‐3146. Graph shows cumulative mean (±SEM) of 3 experiments, 50 cells per condition per experiment.

- A–C
Duration of mitotic arrest in MAD1‐WT and MAD1‐3EK clones treated with 50 nM (A), 25 nM (B) or 12.5 nM (C) GSK923295 to inhibit CENP‐E. Graph shows cumulative mean (±SEM) of 3 experiments, 50 cells per condition per experiment.

- A, B
Immunofluorescence images (A) and quantification (B) of relative MAD1 and MAD1‐pT716 kinetochore levels in dox‐inducible vsv‐MAD1‐WT cells with doxycycline removed (‐Dox) and vsv‐MAD1‐WT or vsv‐MAD1‐T716A. Vsv‐MAD1‐WT cells were cultured without Dox for 11d prior to transient transfection with vsv‐MAD1‐WT or vsv‐MAD1‐T716A plasmids. After 43 h, nocodazole was added for 8 h prior to fixation. In all kinetochore intensity graphs, each dot represents a cell, horizontal lines indicate the median, and vertical bars show the 95% confidence interval. Note, when these vertical bars do not overlap, the difference is considered statistically significant at a level of at least P < 0.05 (see Materials and Methods). The graphs display data that are relative to doxycycline(dox)‐treated controls, which are normalised to 1. The mean level of the normalised controls is indicated by the dotted lines.
- C
Immunofluorescence images of MAD1 and MAD1‐pT716 kinetochore levels in nocodazole‐arrested HeLa FRT cells.
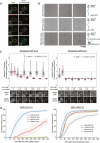
Immunofluorescence images of MAD1 and MAD1‐pT716 kinetochore levels in nocodazole‐arrested RPE1 cells treated with or without AZ‐3146. Scale bars = 5 μM.
Electron micrographs of rotary‐shadowed MAD193–718:MAD2 (top row), MBP‐MAD1:MAD2 (middle row) and MBP‐MAD1:MAD2 in complex with GST‐CDK1:Cyclin B1 (bottom row). Scale bar = 50 nm.
Quantifications (top) and corresponding immunofluorescence images (underneath) of relative kinetochore MAD1 and MAD1‐pT716 levels in nocodazole‐arrested of MAD1‐WT‐C14 and MAD1‐3EK‐C12 cells treated with different doses of AZ‐3146 for 30 min. MG132 was included at the time of AZ‐3146 addition to prevent mitotic exit. Each dot represents a cell, horizontal lines indicate the median and error bars show the 95% confidence interval. Note, when these vertical bars do not overlap, the difference is considered statistically significant at a level of at least P < 0.05 (see Materials and Methods). Thirty cells from 3 experiments. Both kinetochore intensity graphs display data that is relative to the WT‐C14 untreated controls, which are normalised to 1. The mean level of the normalised controls is indicated by the dotted lines.
Duration of mitotic arrest in MAD1‐WT‐C14 or MAD1‐3EK‐C12 cells arrested in nocodazole and then treated with indicated concentrations of AZ‐3146. Note, the 1.25 μM AZ‐3146 data are displayed in Fig 4D, but also included here to allow comparison with other drug doses. Graph shows cumulative mean (±SEM) of 3 experiments, 50 cells per condition per experiment.

Quantifications (top) and corresponding immunofluorescence images (underneath) of kinetochore MAD1 and MAD1‐pT716 levels in nocodazole‐arrested MAD1‐WT‐C11 and 3EK‐C10 treated with different doses of AZ‐3146 for 30 min. MG132 was included at the time of AZ‐3146 addition to prevent mitotic exit. Each dot represents a cell, horizontal lines indicate the median and error bars show 95% confidence interval. Note, when these vertical bars do not overlap, the difference is considered statistically significant at a level of at least P < 0.05 (see Materials and Methods). Both kinetochore intensity graphs display data that are relative to the WT‐C11 untreated controls, which are normalised to 1. The mean level of the normalised controls is indicated by the dotted lines. Thirty cells from 3 experiments.
Duration of mitotic arrest in MAD1‐WT‐C11 or MAD1‐3EK‐C10 cells arrested in nocodazole and then treated with indicated concentrations of AZ‐3146. Graph shows cumulative mean (±SEM) of 3 experiments, 50 cells per condition per experiment. Note, the 1.25 μM AZ‐3146 data are displayed in Fig 4D, but also included here to allow comparison with other drug doses.
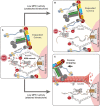
On unattached kinetochores, Cyclin B1 tethers MAD1 to the corona: note that Cyclin B (CycB) is placed next to ROD for illustrative purposes only, since the actual Cyclin B1 binding site at the corona is unknown. Corona‐localised MAD1 can be phosphorylated by MPS1 on a key C‐terminal residue needed for MCC catalysis (pT716), although this phosphorylation occurs mainly in the vicinity of the KMN network. MAD1 is also known to bind in a phospho‐dependent manner to BUB1, but this is not illustrated because it is possible that corona‐tethered MAD1 can simultaneously bind to phospho‐BUB1 and drive MCC production (this is illustrated by a question mark and a double arrow).
If MPS1 activity is reduced without microtubule attachment, then Cyclin B1:MAD1 is maintained at the corona where it can still be phosphorylated by low‐level MPS1 activity. This is sufficient to drive a SAC response, perhaps together with the residual BUB1 that remains bound to KNL1.
When microtubules attach, then MPS1 activity is lowered and the corona is stripped to remove all MAD1. These combined events lead to rapid silencing of the localised SAC signal.
Comment in
-
Spindle checkpoint: trapped by the corona, cyclin B1 goes MAD.EMBO J. 2020 Jun 17;39(12):e105279. doi: 10.15252/embj.2020105279. Epub 2020 May 18. EMBO J. 2020. PMID: 32419215 Free PMC article.
References
-
- Buffin E, Lefebvre C, Huang J, Gagou ME, Karess RE (2005) Recruitment of Mad2 to the kinetochore requires the Rod/Zw10 complex. Curr Biol 15: 856–861 - PubMed
Publication types
MeSH terms
Substances
Grants and funding
LinkOut - more resources
Full Text Sources
Other Literature Sources
Molecular Biology Databases
Research Materials
Miscellaneous

