

Role of respiratory NADH oxidation in the regulation of Staphylococcus aureus virulence
- PMID: 32202364
- PMCID: PMC7202225
- DOI: 10.15252/embr.201845832
Role of respiratory NADH oxidation in the regulation of Staphylococcus aureus virulence
Abstract
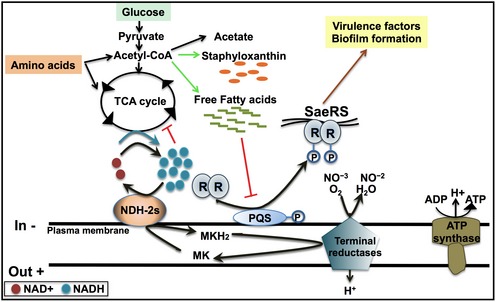
The success of Staphylococcus aureus as a pathogen is due to its capability of fine-tuning its cellular physiology to meet the challenges presented by diverse environments, which allows it to colonize multiple niches within a single vertebrate host. Elucidating the roles of energy-yielding metabolic pathways could uncover attractive therapeutic strategies and targets. In this work, we seek to determine the effects of disabling NADH-dependent aerobic respiration on the physiology of S. aureus. Differing from many pathogens, S. aureus has two type-2 respiratory NADH dehydrogenases (NDH-2s) but lacks the respiratory ion-pumping NDHs. Here, we show that the NDH-2s, individually or together, are not essential either for respiration or growth. Nevertheless, their absence eliminates biofilm formation, production of α-toxin, and reduces the ability to colonize specific organs in a mouse model of systemic infection. Moreover, we demonstrate that the reason behind these phenotypes is the alteration of the fatty acid metabolism. Importantly, the SaeRS two-component system, which responds to fatty acids regulation, is responsible for the link between NADH-dependent respiration and virulence in S. aureus.
Keywords: Staphylococcus aureus; NADH dehydrogenase; NADH/NAD+; respiratory chain; two-component system.
© 2020 The Authors.
Conflict of interest statement
The authors declare that they have no conflict of interest.
Figures
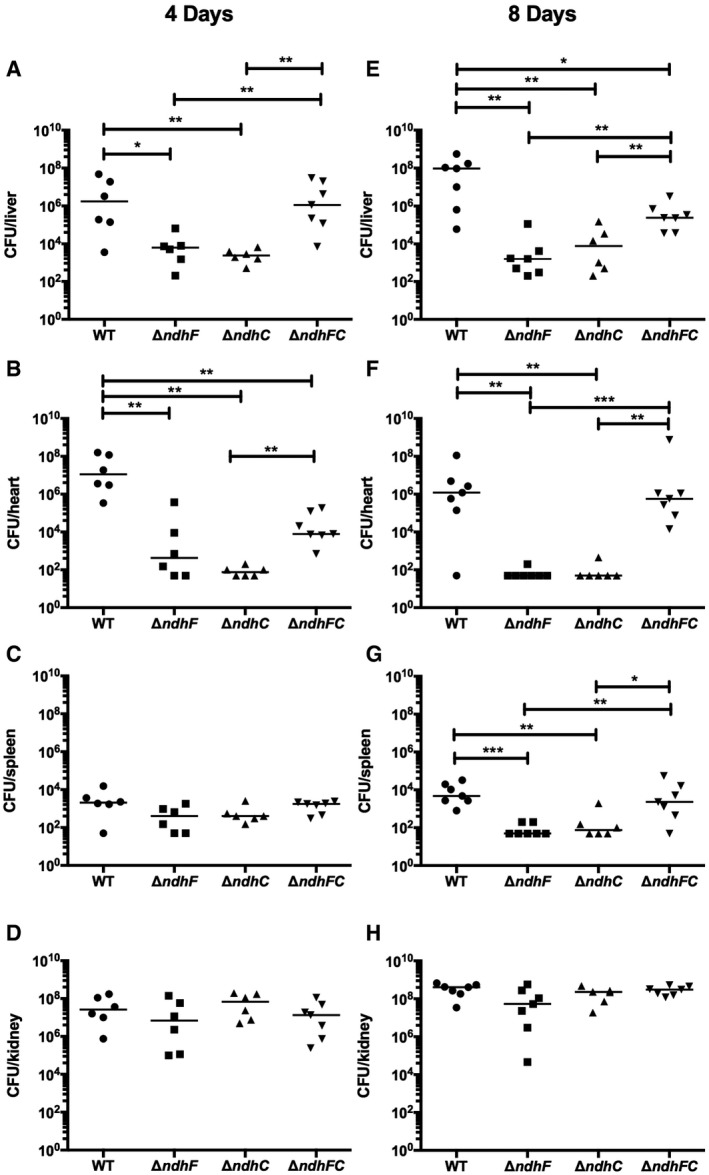
- A–H
Six‐ to eight‐week‐old female outbred CD‐1 mice were infected via tail vein injection with 5 × 10⁷ CFU of WT S. aureus Newman or isogenic mutant strains grown in TSB medium to an OD600 of 0.5. Organs were harvested after (A–D) 4 days or (E–H) 8 days postinfection, and bacterial burdens in the (A and E) liver, (B and F) heart, (C and G) spleen, and (D and H) kidney were determined. Data represent mean ± SEM (n = 7 biological replicates). *P < 0.05, **P < 0.005, and ***P < 0.0007, using the Mann–Whitney test.
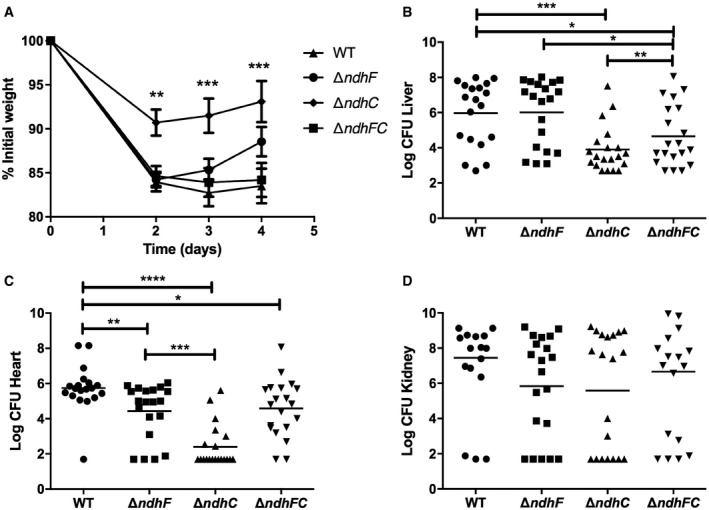
- A–D
Nine‐week‐old female C57BL/6 mice were infected retro‐orbitally with approximately 1 × 10⁷ CFU of WT S. aureus Newman or isogenic mutant strains grown in TSB medium to an OD600 of 0.4. (A) Mean weight loss and (B–D) bacterial burdens in the (B) liver, (C) heart, and (D) kidneys were assessed after 4 days of infection. Data represent mean ± SEM (n = 20 biological replicates). *P < 0.05, **P < 0.005, ***P < 0.0009, and ****P < 0.0001, using the Mann–Whitney test.
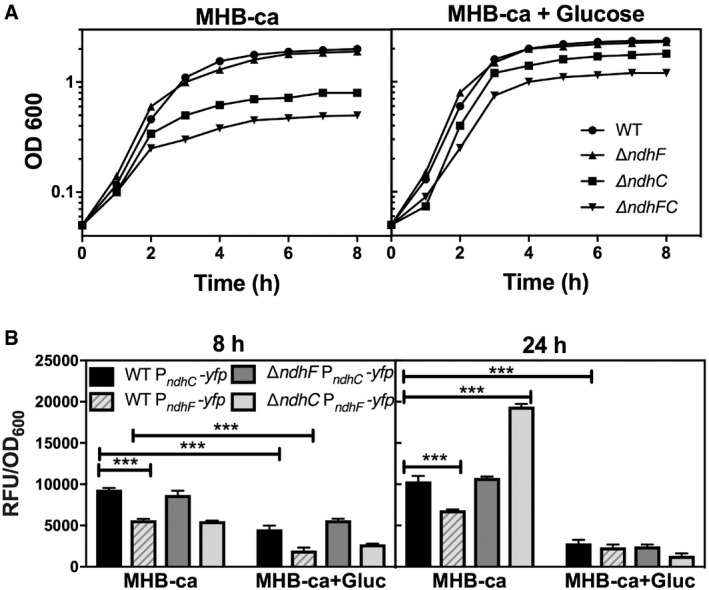
Bacterial growth was measured by optical density at 600 nm. Data are representative of five independent experiments.
PndhC and PndhF YFP reporter constructs were used for following gene expression, and data were normalized by growth. Data are expressed as average ± SEM of three independent experiments. ***P < 0.001 compared to ndhC expression in WT strain grown in MHB‐ca medium via two‐way ANOVA with Tukey's posttest.
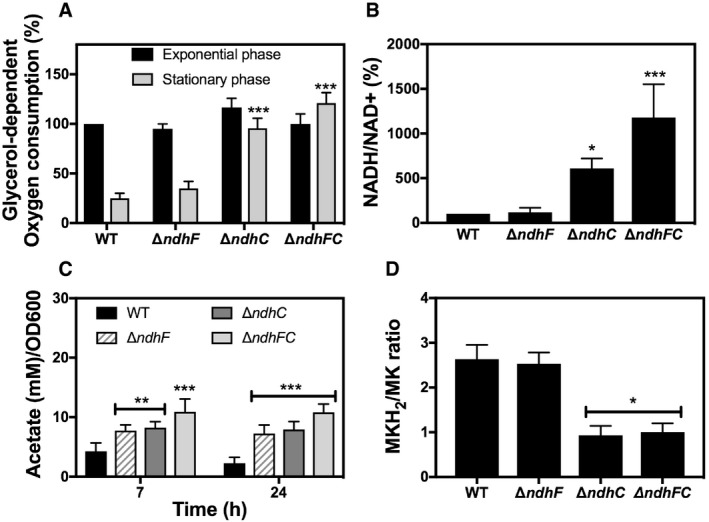
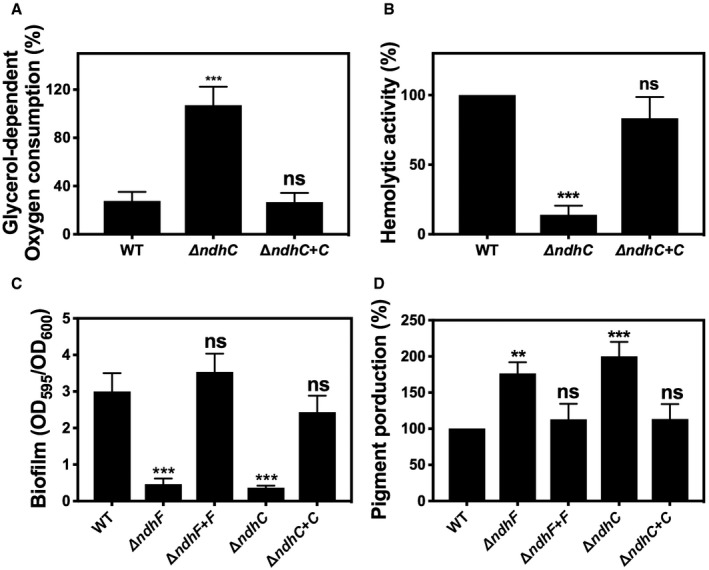
Oxygen consumption of WT and isogenic mutant strains was measured with Clark oxygen electrode. Cells were grown in MHB‐ca medium until exponential phase (OD600 = 0.6) or until late stationary phase (24 h). Cells were washed with PBS and respiration initiated by the addition of 20 mM glycerol. Data are expressed as average ± SD of four independent experiments. ***P < 0.001 compared to WT via two‐way ANOVA with Tukey's posttest.
NADH/NAD+ ratios were measured in cells grown aerobically in MHB‐ca medium for 20 h. 100% corresponds to a NADH/NAD+ ratio of 0.003. Data are expressed as average ± SD of four independent experiments. *P < 0.05 and ***P < 0.001 compared to WT via one‐way ANOVA with Dunnett's posttest.
Acetate concentration was monitored in the supernatants of WT and isogenic ndh strains at 7 and 24 h of growth in MHB‐ca medium. Data are expressed as average ± SD of three independent experiments. **P < 0.005 and ***P < 0.001 compared to WT via two‐way ANOVA with Tukey's posttest.
MKH2/MK ratios were measured in cells grown aerobically for 20 h in MHB‐ca medium. Data are expressed as average ± SD of three independent experiments. *P < 0.05 compared to WT via one‐way ANOVA with Dunnett's posttest.
Comparison of whole cell respiration. Data are expressed as average ± SD of three independent experiments. ***P < 0.001 and ns denotes no significant compared to WT via one‐way ANOVA with Dunnett's posttest.
Hemolytic activity was measured by incubation of rabbit blood cells with serially diluted supernatants from 20‐h cultures grown in MHB‐ca medium. Data are expressed as average ± SD of three independent experiments. ***P < 0.001 and ns denotes no significant compared to WT via one‐way ANOVA with Dunnett's posttest.
Comparison of biofilm formation. Data are expressed as average ± SD of three independent experiments performed by octuplicates. ***P < 0.001 and ns denotes no significant compared to WT via one‐way ANOVA with Dunnett's posttest.
Comparison of pigment production. Data are expressed as average ± SD of three independent experiments. ***P < 0.001, **P < 0.005, and ns denotes no significant compared to WT via one‐way ANOVA with Dunnett's posttest.
- A–D
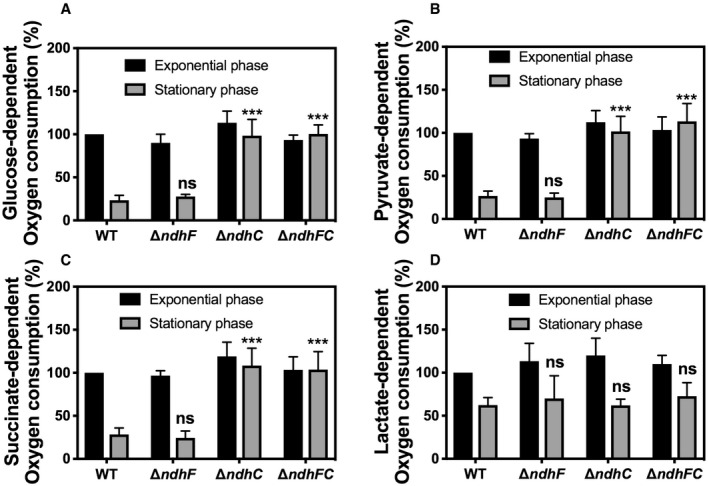
Oxygen consumption of WT and isogenic mutant strains was measured with Clark oxygen electrode. Cells were grown in MHB‐ca medium until exponential phase (OD600 = 0.6) or until late stationary phase (24 h). Cells were washed with PBS and respiration initiated by the addition of (A) 20 mM glucose, (B) 40 mM sodium pyruvate, (C) 30 mM sodium succinate, or (D) 50 mM
dl ‐lactate. Data are expressed as average ± SD of three independent experiments. ***P < 0.001 and ns denotes no significant compared to WT via two‐way ANOVA with Tukey's posttest.
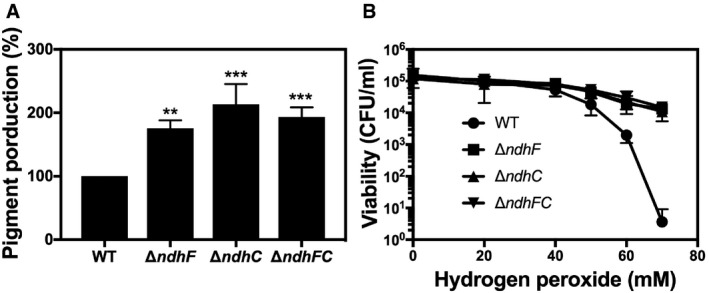
The carotenoid pigment of different Staphylococcus aureus strains was extracted by methanol and quantified by the optical density at 465 nm, and the values were normalized to WT Newman strain, which was set at 100. Data are expressed as the average ± SD of five independent experiments. **P < 0.005 and ***P < 0.001 compared to WT via one‐way ANOVA with Dunnett's posttest.
Hydrogen peroxide sensitivity was measured by incubating WT and isogenic strains, previously grown for 20 h in MHB‐ca, with different concentrations of hydrogen peroxide. Serial dilutions were plated in TSB medium for measuring CFU. Data are expressed as the average ± SD of three independent experiments.
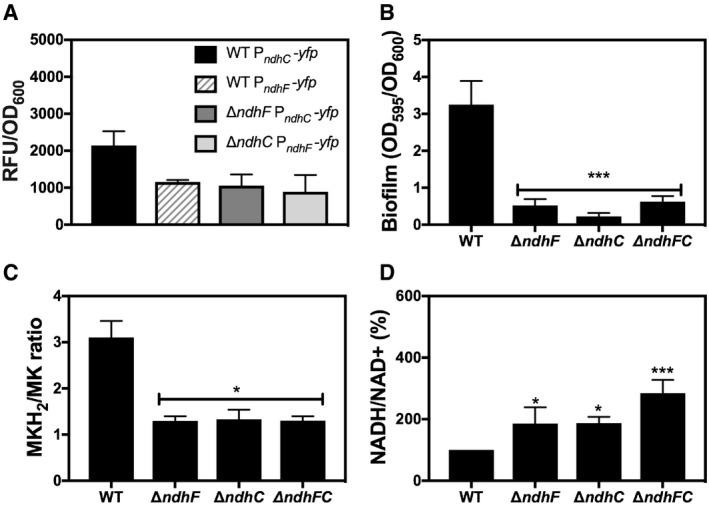
PndhC and PndhF YFP reporter constructs were used to follow gene expression under the biofilm growth conditions. Data collected after 24 h of static incubation were normalized by optical density at 600 nm. Data are expressed as average ± SEM of three independent experiments. No significant differences were found when ndhC expression in WT strain was compared via one‐way ANOVA with Dunnett's posttest.
Biofilm formation of Newman WT and ndh‐deficient mutants after static incubation at 37°C for 20 h. The histogram shows the amount of biofilm biomass attached to the microtiter plate when cells were grown in MHB‐ca supplemented with 10% human plasma, 0.5% glucose, and 2% NaCl. Data are expressed as average ± SD of four independent experiments performed by octuplicates. ***P < 0.001 compared to WT via one‐way ANOVA with Dunnett's posttest.
MKH2/MK ratios were measured in cells grown under the same conditions as for biofilm formation. Data are expressed as average ± SD of three independent experiments. *P < 0.05 compared to WT via one‐way ANOVA with Dunnett's posttest.
NADH/NAD+ ratios were measured in cells grown under the same conditions as for biofilm formation. 100% corresponds to a NADH/NAD+ ratio of 0.09. Data are expressed as average ± SD of four independent experiments performed by duplicates. *P < 0.05 and ***P < 0.001 compared to WT via one‐way ANOVA with Dunnett's posttest.
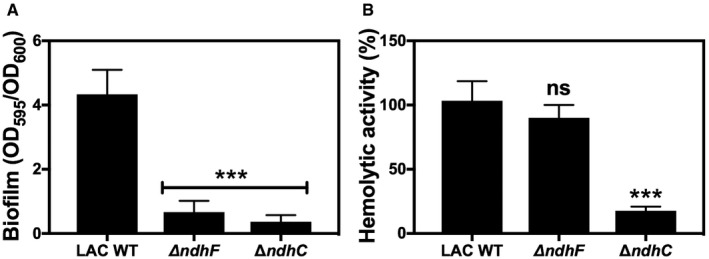
Biofilm formation of LAC WT and ndh‐deficient mutants after static incubation at 37°C for 20 h. The histogram shows the amount of biofilm biomass attached to the microtiter plate when cells were grown in MHB‐ca supplemented with 10% human plasma, 0.5% glucose, and 2% NaCl. Data are expressed as average ± SD of four independent experiments performed by octuplicates. ***P < 0.001 compared to WT via one‐way ANOVA with Dunnett's posttest.
Hemolytic activity of the LAC WT and isogenic mutant strains was measured by incubation of rabbit blood cells with serially diluted supernatants from 20‐h cultures grown in MHB‐ca medium. LAC WT has about 50% less hemolytic activity than Newman WT strain. Data are expressed as average ± SD of four independent experiments. ***P < 0.001 and ns denotes no significant compared to WT via one‐way ANOVA with Dunnett's posttest.
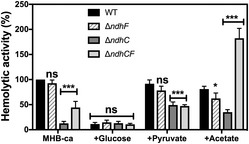
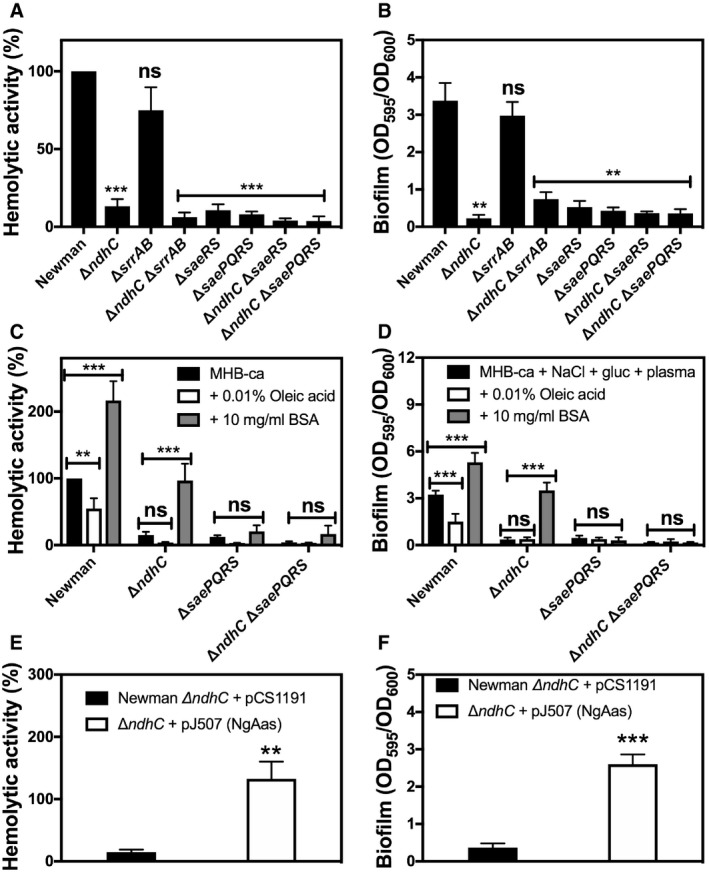
Hemolytic activity of the Newman WT and isogenic mutant strains was measured by incubation of rabbit blood cells with serially diluted supernatants from 20‐h cultures grown in MHB‐ca medium. Lysis was monitored by the release of hemoglobin. Data are expressed as average ± SD of four independent experiments. ***P < 0.001 and ns denotes no significant compared to WT via one‐way ANOVA with Dunnett's posttest.
Biofilm formation of Newman WT and isogenic mutant strains after static incubation at 37°C for 20 h. The histogram shows the amount of biofilm biomass attached to the microtiter plate when cells were grown in MHB‐ca supplemented with 10% human plasma, 0.5% glucose and 2% NaCl. Data are expressed as average ± SD of four independent experiments performed by octuplicates. **P < 0.005 and ns denotes no significant compared to WT via one‐way ANOVA with Dunnett's posttest.
Hemolytic activity of the Newman WT and isogenic mutant strains grown aerobically for 20 h in MHB‐ca medium, in the absence or presence of 10 mg/ml FA‐deficient BSA and 0.01% oleic acid. Data are expressed as average ± SD of five independent experiments. **P < 0.005 and ***P < 0.001 compared to each strain without any BSA or oleic acid addition via two‐way ANOVA with Tukey's posttest.
Biofilm formation of Newman WT and isogenic mutant strains after static incubation for 20 h in MHB‐ca supplemented with 10% human plasma, 0.5% glucose, and 2% NaCl, in the absence or presence of 10 mg/ml FA‐deficient BSA and 0.01% oleic acid. Data are expressed as average ± SD of four independent experiments performed by octuplicates. ***P < 0.001 compared to each strain without any BSA or oleic acid addition via two‐way ANOVA with Tukey's posttest.
Hemolytic activity of Newman ΔndhC strain overexpressing the Neisseria gonorrhoeae acyl‐ACP synthetase and grown aerobically for 20 h in MHB‐ca medium. Data are expressed as average ± SD of four independent experiments. **P < 0.005 compared to ΔndhC strain with the empty plasmid via Student's t‐test.
Biofilm formation of Newman ΔndhC strain overexpressing the N. gonorrhoeae acyl‐ACP synthetase and grown under biofilm producing conditions. Data are expressed as average ± SD of three independent experiments performed by octuplicates. ***P < 0.001 compared to ΔndhC strain with the empty plasmid via Student's t‐test.
References
-
- Kuehnert MJ, Kruszon‐Moran D, Hill HA, McQuillan G, McAllister SK, Fosheim G, McDougal LK, Chaitram J, Jensen B, Fridkin SK et al (2006) Prevalence of Staphylococcus aureus nasal colonization in the United States, 2001–2002. J Infect Dis 193: 172–179 - PubMed
-
- Klevens RM, Morrison MA, Nadle J, Petit S, Gershman K, Ray S, Harrison LH, Lynfield R, Dumyati G, Townes JM et al (2007) Invasive methicillin‐resistant Staphylococcus aureus infections in the United States. JAMA 298: 1763–1771 - PubMed
Publication types
MeSH terms
Substances
Grants and funding
LinkOut - more resources
Full Text Sources
Medical
