. 2020 Jun;12(3):334-341.
doi: 10.1111/1758-2229.12837. Epub 2020 Apr 7.

Autotrophic carbon fixation pathways along the redox gradient in oxygen-depleted oceanic waters

Affiliations

Autotrophic carbon fixation pathways along the redox gradient in oxygen-depleted oceanic waters

Paula Ruiz-Fernández et al. Environ Microbiol Rep. 2020 Jun.

Abstract

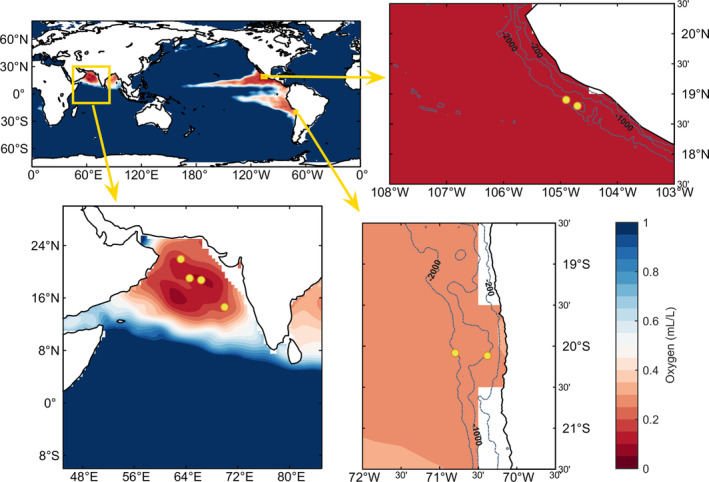
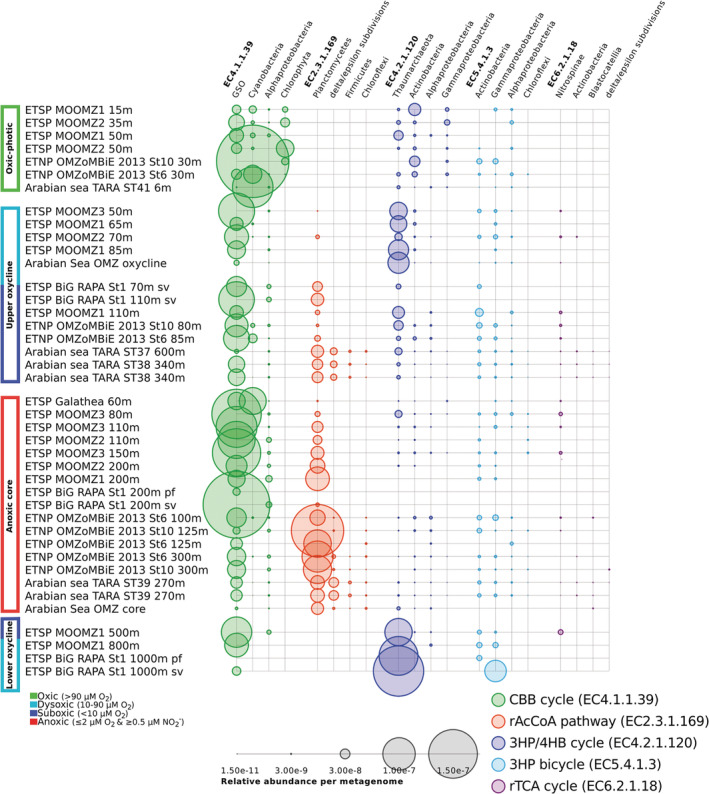
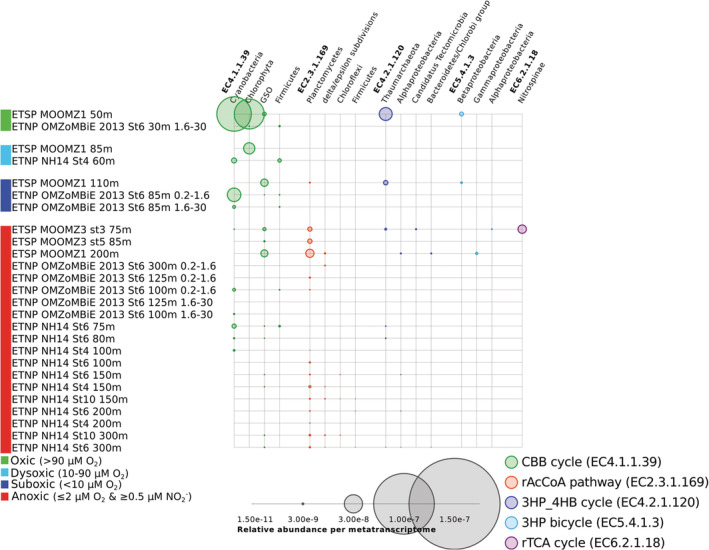
Anoxic marine zones (AMZs), also known as 'oxygen-deficient zones', contribute to the loss of fixed nitrogen from the ocean by anaerobic microbial processes. While these microbial processes associated with the nitrogen cycle have been extensively studied, those linked to the carbon cycle in AMZs have received much less attention, particularly the autotrophic carbon fixation - a crucial component of the carbon cycle. Using metagenomic and metatranscriptomic data from major AMZs, we report an explicit partitioning of the marker genes associated with different autotrophic carbon fixation pathways along the redox gradient (from oxic to anoxic conditions) present in the water column of AMZs. Sequences related to the Calvin-Benson-Bassham cycle were found along the entire gradient, while those related to the reductive Acetyl-CoA pathway were restricted to suboxic and anoxic waters. Sequences putatively associated with the 3-hydroxypropionate/4-hydroxybutyrate cycle dominated in the upper and lower oxyclines. Genes related to the reductive tricarboxylic acid cycle were represented from dysoxic to anoxic waters. The taxonomic affiliation of the sequences is consistent with the presence of microorganisms involved in crucial steps of biogeochemical cycles in AMZs, such as the gamma-proteobacteria sulfur oxidisers, the anammox bacteria Candidatus Scalindua and the thaumarcheota ammonia oxidisers of the Marine Group I.


Figures

Figure 1
Figure 1
Map of the origin of the metagenomes and metatranscriptomes from AMZs used in this study. The colour palette represents the oxygen concentrations at 300 m depth and was constructed with the data extracted from the CSIRO Atlas of Regional Seas (CARS2009: http://www.marine.csiro.au/~dunn/cars2009/). The yellow circles represent the location of the metagenomes and metatranscriptomes; details are given in the Supporting Information Table S1.
Figure 2
Figure 2
Relative abundances of a subset of the marker genes of autotrophic carbon fixation pathways, in the metagenomes extracted from AMZs worldwide, and their putative taxonomic affiliations. Metagenomes from the Arabian Sea, the ETNP, and ETSP Oceans were separated by their oxygen concentrations (boxes at the left) according to Thamdrup et al., 2012 and Wright et al., 2012. The sizes of the coloured circles are proportional to the relative abundance of the sequences per metagenome (computed as proportions of the number of reads to the total number of reads per data set and normalized according to the corresponding gene size). The taxonomy used in this figure corresponds to the third taxonomic rank in the NCBI taxonomy, which is normally associated with the class. Supporting Information Table S3 shows the taxonomy at the species level and Table S4 shows the percentages of coverage of the taxa for each marker gene present in the figure. The sequences from each of the datasets were directly aligned to a subset of the KEGG protein sequence database that only contained sequences with a defined KEGG orthology (KO). The algorithm BLASTX from the Diamond software package was used in all these massive sequence alignments. Only the alignments that had a bit‐score equal or higher than 50 were used in the downstream analyses. Afterward, the profiles of KOs and Enzyme Commission (EC) numbers, for each metagenome and metatranscriptome, were created. The mapping file ‘ko2ec’, from the KEGG distribution, was used to convert the KOs to ECs, whenever the KO corresponded to an enzyme. Subsequently, profiles for each metagenomic and metatranscriptomic dataset were created, with the relative abundances of the genes encoding the enzymes listed in the Supporting Information Table S2. The metagenomic and metatranscriptomic sequences associated with the marker genes of Supporting Information Table S2 were extracted from the original nucleotide FASTA files and aligned with BLASTX algorithm from the DIAMOND software package against the NCBI RefSeq, NCBI‐nr and a custom database composed of sequences associated with samples from low‐oxygen marine zones, available in IMG/ER. The sequences in the reference databases with the best bit‐score (whenever it was equal or higher than 50) for each input sequence (aligned to the marker genes only) was used as the putative taxonomic affiliation. When this taxonomic annotation was associated with an ‘uncultured organism’, the second or the third best bit‐scored alignment was used in this process. Singletons were eliminated, and only the fourth most abundant taxa related to each EC were considered in this figure. The results indicated that the distances determined by the correlations of the profiles of proportions of the marker genes (normalized as mentioned before) confirmed the predefined grouping by oxygen concentration with F = 18.10842 (P‐value = 9.999e‐05, Supporting Information Table S5).
Figure 3
Figure 3
Relative abundances and putative taxonomic affiliation of a subset of the marker genes of autotrophic carbon fixation in metatranscriptomes from AMZs. Metatranscriptomes were sampled from the ETNP and ETSP Oceans and were arranged by their oxygen concentrations (boxes at the left). The sizes of the coloured circles are proportional to the relative abundances of sequences, per metatranscriptome (computed as proportions of the number of reads to the total number of reads per meta‐ome and normalized according to the corresponding gene size). The taxonomy used in this figure corresponds to the third taxonomic rank in the NCBI taxonomy, which is normally associated with the class. Supporting Information Fig. S1 and Table S3 show the taxonomy at the species level and Table S4 shows the percentages of coverage of the taxa for each marker gene present in the figure. The results indicated that the distances determined by the correlations of the profiles of proportions of the marker genes (normalized as mentioned before) confirmed the predefined grouping by oxygen concentration with F = 2.78573 (P‐value = 0.02449755, Supporting Information Table S5).

Similar articles

Cited by

References

    1. Belmar, L. , Molina, V. , and Ulloa, O. (2011) Abundance and phylogenetic identity of archaeoplankton in the permanent oxygen minimum zone of the eastern tropical South Pacific. FEMS Microbiol Ecol 78: 314–326. - PubMed
    1. Berg, I.A. , Kockelkorn, D. , Ramos‐Vera, W.H. , Say, R.F. , Zarzycki, J. , Hügler, M. , et al (2010) Autotrophic carbon fixation in archaea. Nat Rev Microbiol 8: 447–460. - PubMed
    1. Canfield, D.E. , Stewart, F.J. , Thamdrup, B. , Brabandere, L.D. , Dalsgaard, T. , Delong, E.F. , et al (2010) A cryptic sulfur cycle in oxygen‐minimum‐zone waters off the Chilean coast. Science 330: 1375–1378. - PubMed
    1. Callbeck, C.M. , Lavik, G. , Ferdelman, T.G. , Fuchs, B. , Gruber‐Vodicka, H.R. , Hach, P.F. , et al (2018) Oxygen minimum zone cryptic sulfur cycling sustained by offshore transport of key sulfur oxidizing bacteria. Nat Commun 9: 1729. - PMC - PubMed
    1. Caspi, R. , Billington, R. , Fulcher, C.A. , Keseler, I.M. , Kothari, A. , Krummenacker, M. , et al (2017) The meta Cyc database of metabolic pathways and enzymes. Nucl Acids Res 46: D623–D631.

Publication types

MeSH terms

LinkOut - more resources