. 2020 Mar 23:9:e56095.
doi: 10.7554/eLife.56095.

Inflammatory osteolysis is regulated by site-specific ISGylation of the scaffold protein NEMO

Affiliations

Inflammatory osteolysis is regulated by site-specific ISGylation of the scaffold protein NEMO

Naga Suresh Adapala et al. Elife. .

Abstract

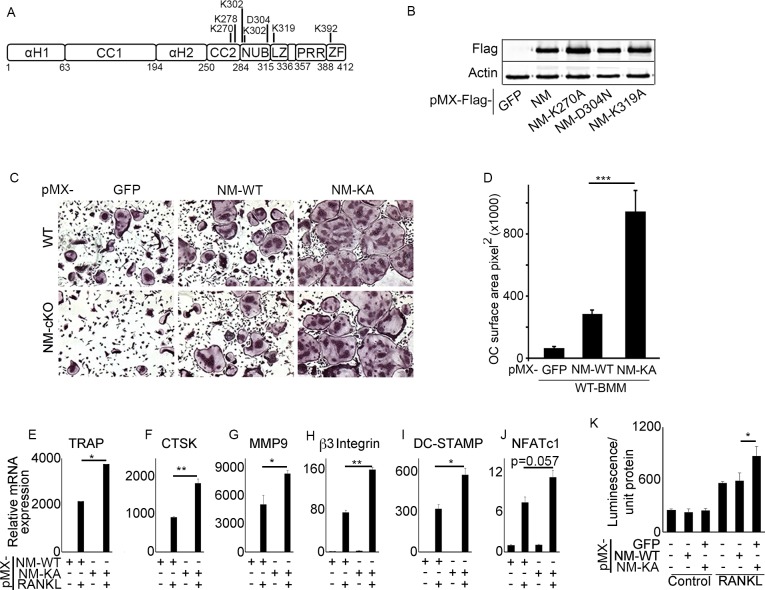
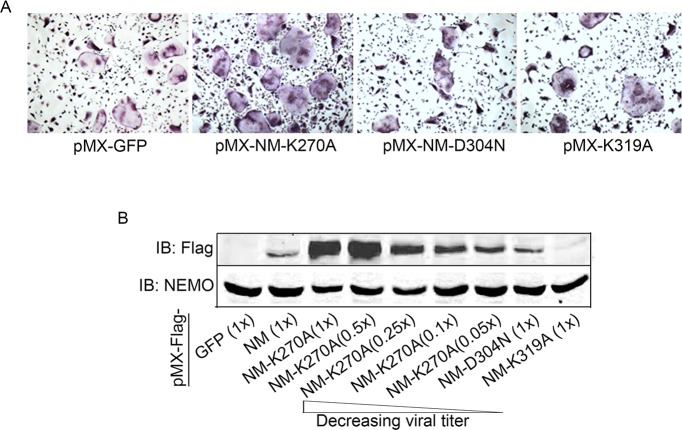
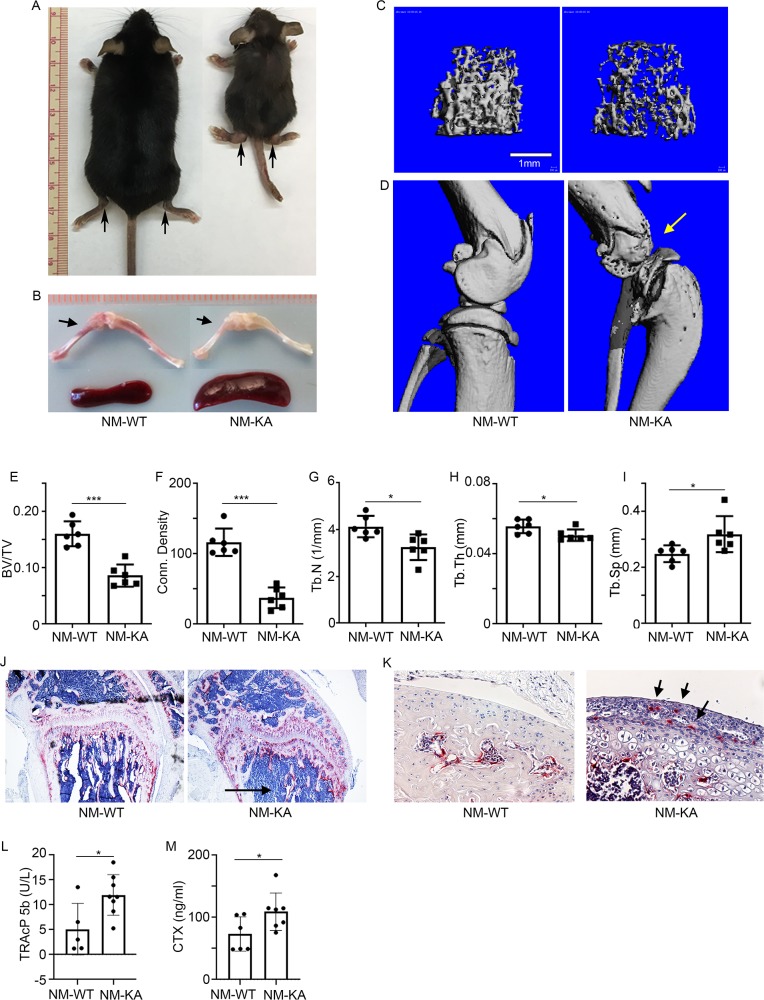
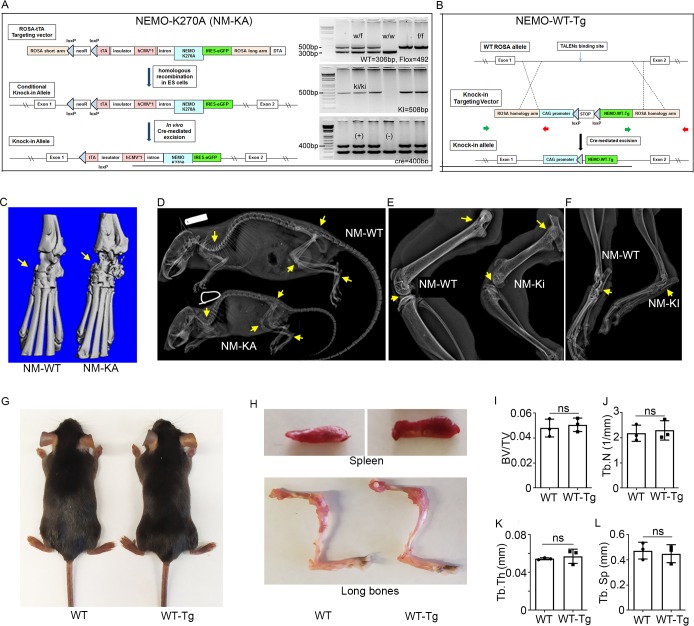
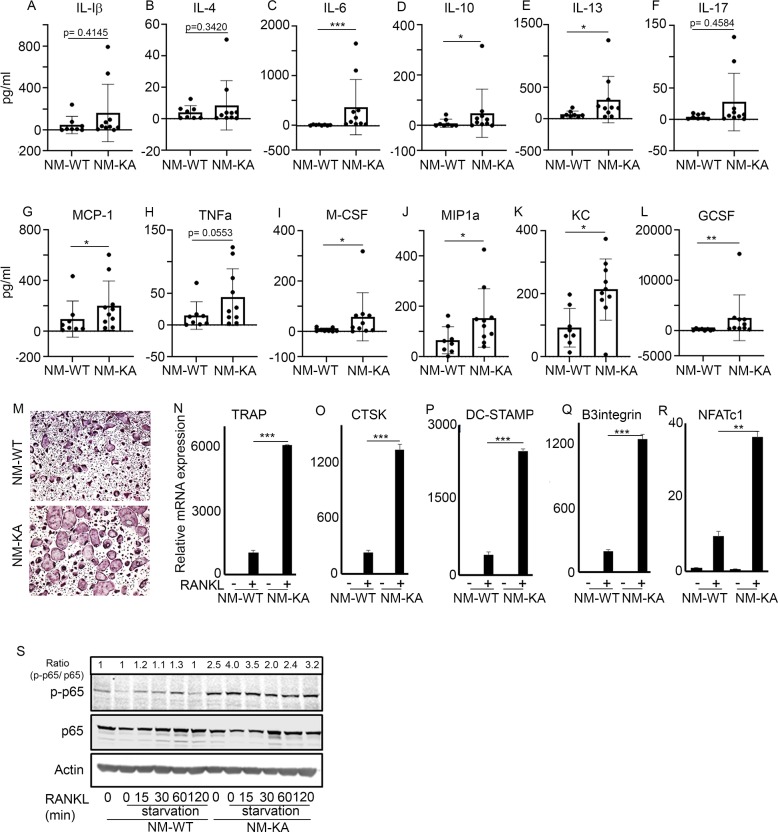
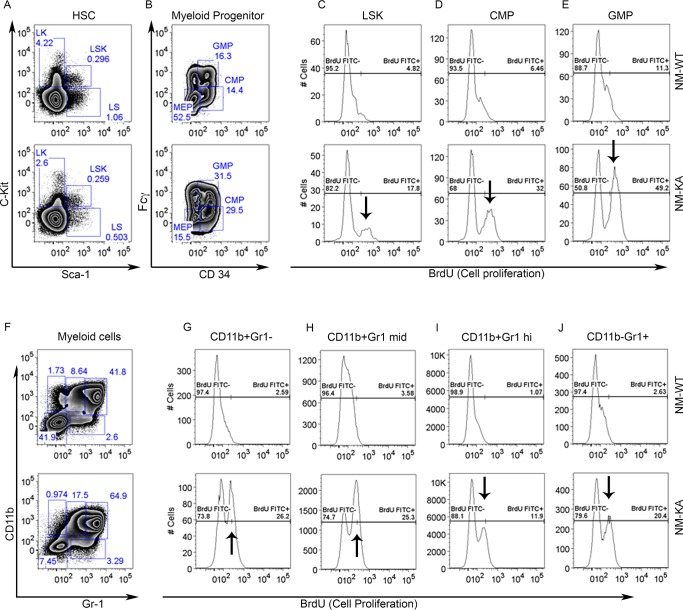
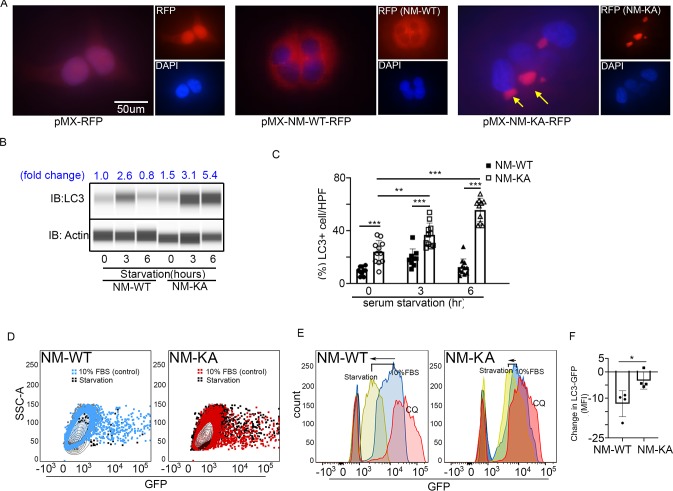
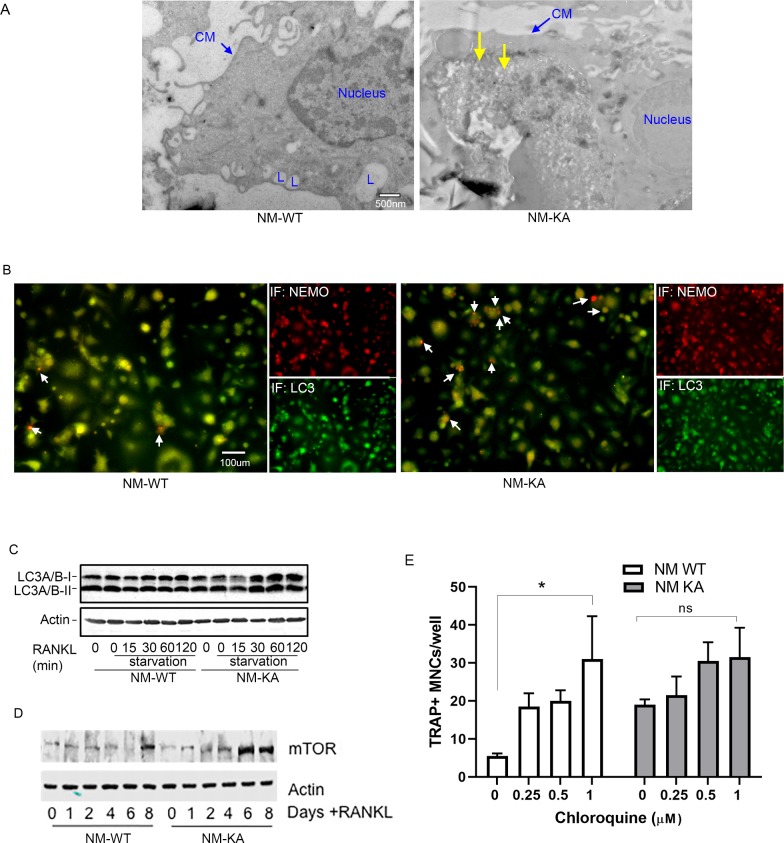
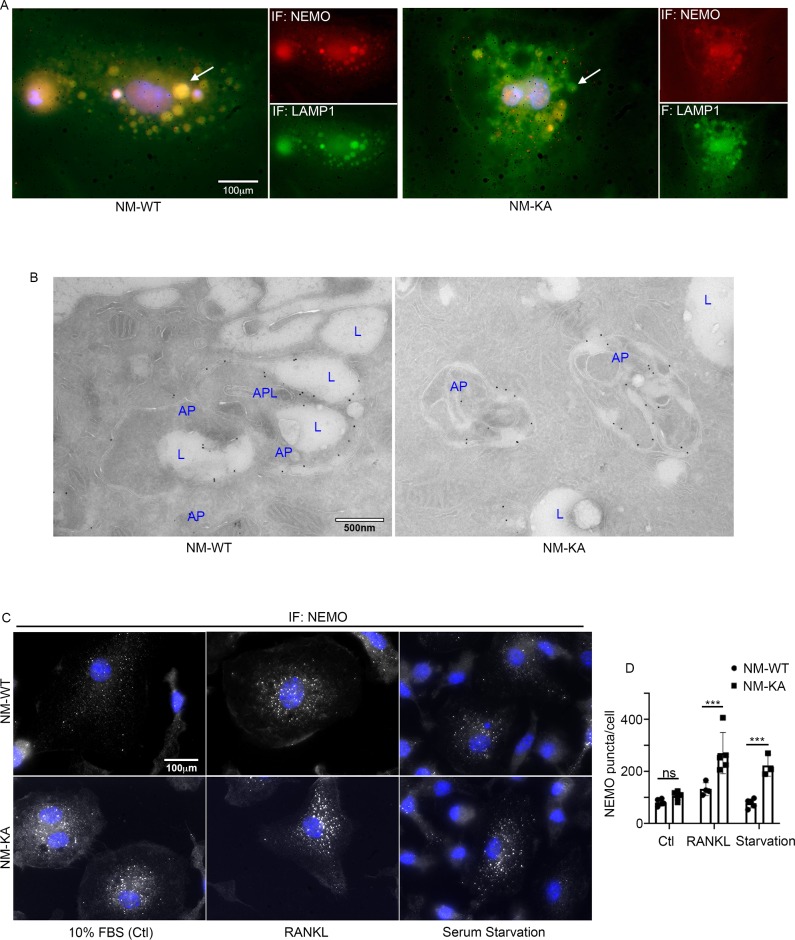
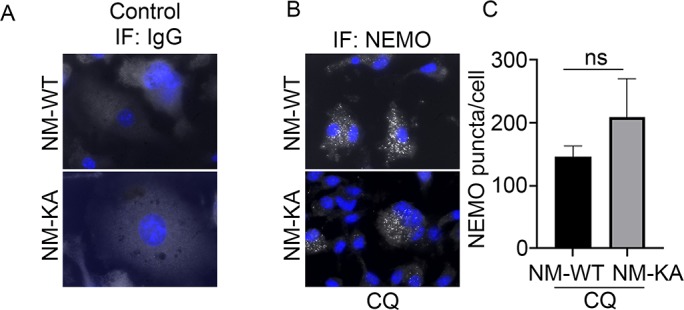
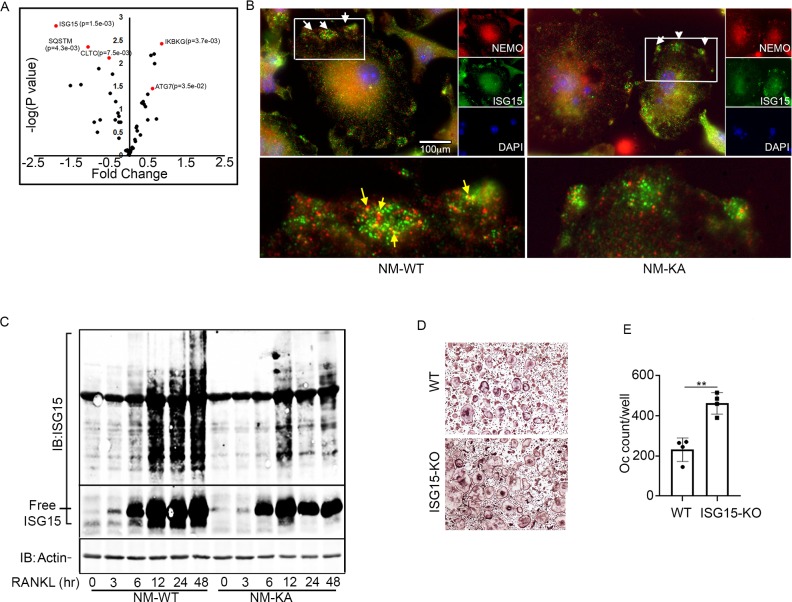
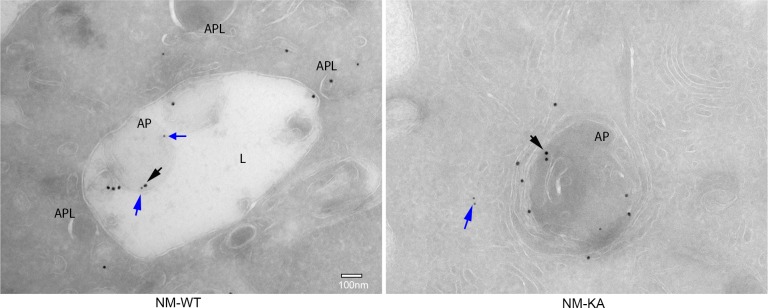
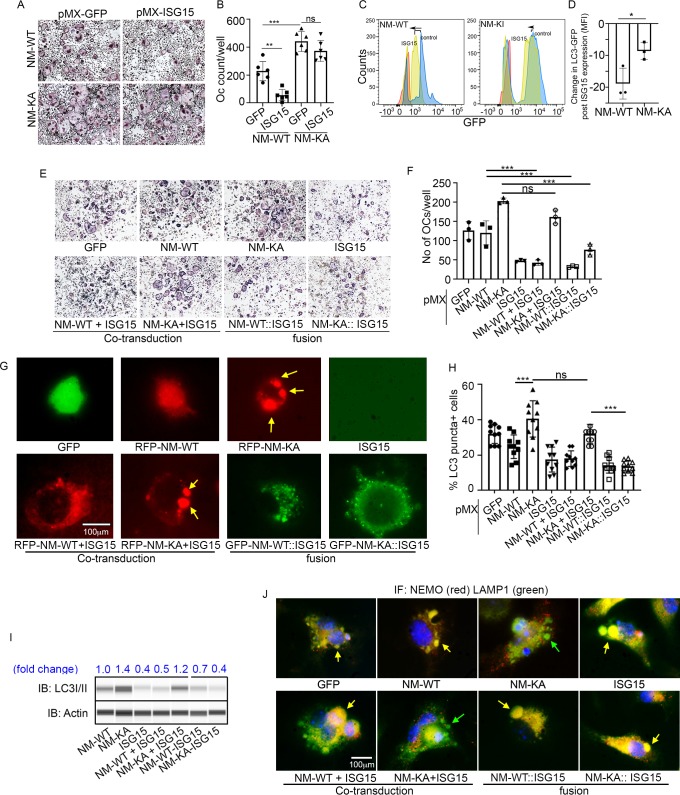
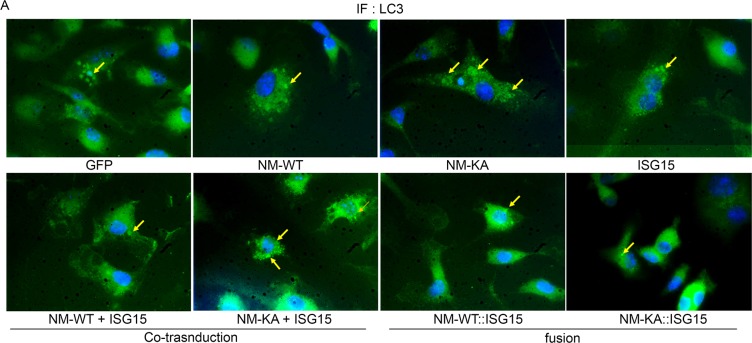
Inflammatory osteolysis is governed by exacerbated osteoclastogenesis. Ample evidence points to central role of NF-κB in such pathologic responses, yet the precise mechanisms underpinning specificity of these responses remain unclear. We propose that motifs of the scaffold protein IKKγ/NEMO partly facilitate such functions. As proof-of-principle, we used site-specific mutagenesis to examine the role of NEMO in mediating RANKL-induced signaling in mouse bone marrow macrophages, known as osteoclast precursors. We identified lysine (K)270 as a target regulating RANKL signaling as K270A substitution results in exuberant osteoclastogenesis in vitro and murine inflammatory osteolysis in vivo. Mechanistically, we discovered that K270A mutation disrupts autophagy, stabilizes NEMO, and elevates inflammatory burden. Specifically, K270A directly or indirectly hinders binding of NEMO to ISG15, a ubiquitin-like protein, which we show targets the modified proteins to autophagy-mediated lysosomal degradation. Taken together, our findings suggest that NEMO serves as a toolkit to fine-tune specific signals in physiologic and pathologic conditions.

Keywords: ISG15; NEMO; RANKL; human biology; medicine; mouse; nk-kb; osteoclast; osteolysis.

Plain language summary

The human skeleton contains over 200 bones that together act as an internal framework for the body. Over our lifetime, the body constantly removes older bone tissue from the skeleton and replaces it with new bone tissue. This “bone remodeling” also controls how bones are repaired after being damaged by injuries, disease or normal wear and tear. Cells known as osteoclasts are responsible for breaking down old bone tissue and participate in repairing damaged bone. A cellular pathway known as NF-kB signaling stimulates other cells called “bone marrow macrophages” to become osteoclasts. A certain level of NF-kB signaling is required to maintain a healthy skeleton. However, under certain inflammatory conditions, the level of NF-kB signaling becomes too high causing hyperactive osteoclasts to accumulate and inflict severe bone breakdown. This abnormal osteoclast activity leads to eroded and fragile bones and joints, as is the case in diseases such as rheumatoid arthritis and osteoporosis. Previous studies have shown that a protein called NEMO is a core component of the NF-kB signal pathway, but the precise role of NEMO in the diseased response remained unclear. Adapala, Swarnkar, Arra et al. have now used site-directed mutagenesis approach to study the role of NEMO in bone marrow macrophages in mice. The experiments showed that one specific site within the NEMO protein, referred to as lysine 270, is crucial for its role in controlling osteoclasts and the breakdown of bone tissue. Mutating NEMO at lysine 270 led to uncontrolled NF-kB signaling in the bone marrow macrophages. Further experiments showed that lysine 270 served as a sensor to allow NEMO to bind another protein called ISG15, which in turn helped to decrease NF-kB signaling and slow down the erosion of the bone. These findings suggest that site-specific targeting of NEMO, rather than inhibiting the whole NF-kB pathway, may help to reduce the symptoms of bone disease while maintaining the beneficial roles of this essential pathway. However, additional research is required to identify NEMO sites responsible for controlling the inflammatory component.


Conflict of interest statement

NA, GS, MA, JS, GM, KK, YA No competing interests declared

Figures

Figure 1.
Figure 1.. NEMOK270A mutant expression in BMMs exacerbates RANKL-induced osteoclastogenesis.
(A) Domain structure of NEMO (B) Western blot showing expression of pMX-NEMOWT (NM) and pMX-NEMO mutants (NM-K270A, NEMO-D304N and NM-K319A). (C) BMMs from WT and (LysM-cre-NEMO f/f) NEMO-cKO mice were transduced with viral particles (generated by transfecting pMX- retroviral vectors in PLAT-E cells) expressing NEMOWT (NM-WT) and NEMOK270A (NM-KA) and cultured in the presence of MCSF (10 ng/ml) and RANKL (50 ng/ml). (D) Representative TRAP staining for osteoclast (n = 8) and (D) quantification of TRAP positive OCs. qPCR analysis for OC marker genes (E) TRAP, (F) CTSK, (G) MMP9, (H) β3integrin, (I) DC-STAMP and (J) NFATC1 (p=0.057). Representative data (n = 3 independent experiments). (K) BMMs from RelA_luc reporter mice expressing NM-WT and NM-KA were cultured in the presence of MCSF (10 ng/ml) for 3 days followed by RANKL stimulation with RANKL (50 ng/ml) for 6 hr and RelA-luciferase activity measurement (n = 3). pMX-Flag-NEMOWT-RFP (NM-WT), pMX-Flag-NEMOK270A-RFP (NM-KA). (*p<0.05, **p<0.01 and ***p<0.001).
Figure 1—figure supplement 1.
Figure 1—figure supplement 1.. BMMs from wild type mice were transduced with viral particles (generated by transfecting pMX- retroviral vectors in PLAT-E cells) expressing NEMOWT (NM-WT), NEMOK270A (NM-KA), NEMO-D304N and NEMO-K319A constructs followed by culture in the presence of MCSF (10 ng/ml) and RANKL (50 ng/ml) for 4 days.
(A) Representative images for TRAP staining for osteoclast (n = 8). (B) Wild type BMMs were transduced with different dilution (1x, 0.5x, 0.25x, 0.1x and 0.05x) of retroviral particles expressing NEMOK270A (NM-KA). Wild type BMMs were also transduced with viral particles expressing NEMO-D304N and NEMO-K319N at 1x dilution. Western-blot using anti-flag antibody shows higher expression of NEMOK270A even at low viral dilution. pMX-Flag-NEMOWT-RFP (NM-WT), pMX-Flag-NEMOK270A-RFP (NM-KA).
Figure 2.
Figure 2.. Expression of NEMOK270A in vivo leads to inflammatory osteolysis and joint destruction.
NEMOK270A was conditionally expressed in myeloid cells (NM-KA mice) by crossing NEMOK270A f/f mice with LysozymeM cre expressing mice. (A) Whole body images of NM-KA mice compared to littermate wild type control mice (6 weeks old). The arrows point to deformed joints and swelling. (B) Photomicrograph of spleen and bone from NM-WT and NM-KA mice. MicroCT analysis of bone from NM-WT and NM-KA mice showing (C) femur trabecular bone, (D) knee joint osteolysis (arrow) and quantification of (E) Bone volume/total volume (BV/TV), (F) Connectivity density, (G) Trabecular number (Tb.N), (H) Trabecular thickness (Tb.Th) and (I) Trabecular separation (Tb.Sp) in the femur trabecular region (n = 6). Long bones from 6 weeks old NM-WT and NM-KA mice were processed for histology and stained for TRAP to visualize TRAP+ osteoclasts in (K) bone sections and (K) Articular surfaces of knee joint (arrow). Representative images (n = 6) Serum was collected from NM-WT and NM-KA to measure serum (L) TRAP and (M) CTX concentration as an indicator of increased osteoclast activity (n = 6–8). LysM-cre-NEMOWT-f/f (NM-WT), LysM-cre-NEMOK270A-f/f (NM-KA) mice. (*p<0.05, **p<0.01 and ***p<0.001).
Figure 2—figure supplement 1.
Figure 2—figure supplement 1.. Generation of NEMO transgenic mice.
Schematic diagram showing generation of conditional (A) NEMO-K270A-KI (NM-KA) and (B) NEMO-WT-Tg (NM-WT-Tg) mice (6 weeks old). (C) MicroCT images of paw and ankle joint showing osteolysis in NM-KA mice (arrow). X-ray images of NM-WT and NM-KA mice showing significant bone loss and deformities in (D) whole body (E) Knee joint (F) ankle and paw (arrow pointing towards osteolysis and deformed bones). (G) Whole body images of NM-WT and NM-WT-Tg mice (6 weeks old). (H) Photomicrograph of spleen and bone from NM-WT and NM-WT-Tg mice. MicroCT analysis showing quantification of (I) Bone volume/total volume (BV/TV), (J) Trabecular number (Tb.N), (K) Trabecular thickness (Tb.Th) and (L) Trabecular separation, between NM-WT and NM-WT-Tg mice (n = 3).
Figure 3.
Figure 3.. NEMOK270A mutation instigates systemic inflammation.
Serum was collected from NM-WT and NM-KA mice (n = 8–10) to measure concentration of inflammatory cytokines (A) Interleukin (IL) 1b, (B) IL-4, (C) IL-6, (D) IL-10, (E) IL-13, (F) IL-17, (G) Monocyte chemoattractant protein1 or CCL2, (H) Tumor necrosis factor alpha, (I) Macrophage colony stimulating factor, (J) macrophage Inflammatory protein (MCP)−1 or CCL3, (K) keratinocyte chemoattractant or neutrophil activating protein three or CXCL1 and (L) granulocyte colony stimulating factor (GCSF). (M) BMMs from NM-WT and NM-KA mice were isolated and cultured in the presence of MCSF (10 ng/ml) and RANKL (10 ng/ml). Representative TRAP staining for osteoclast (n = 8) is shown. (N–R) Representative qPCR analysis for OC marker genes TRAP, CTSK, β3integrin, DC-STAMP and NFATC1 (n = 3). (S) BMMs from NM-WT and NM-KA mice were isolated and cultured in the presence of MCSF (10 ng/ml) four days followed by serum starvation and stimulation with RANKL (50 ng/ml) for different time points (n = 8). Representative western-blot showing activation of p65 (phos-p65/p65 ratio) post RANKL stimulation in BMMs from NM-WT and NM-KA mice. LysM-cre-NEMO-WT-f/f (NM-WT), LysM-cre-NEMO-K270A-f/f (NM-KA) mice. (*p<0.05, **p<0.01 and ***p<0.001).
Figure 3—figure supplement 1.
Figure 3—figure supplement 1.. BrdU was injected to NM-WT and NM-KA mice.
1 day after injection single cell suspensions from bone marrow were prepared by flushing the marrow out of femur and tibia. Following RBC lysis, cells were stained with different antibody cocktails. Flow analysis showing percentage of (A) Lin-Sca1+Kit+ (LSK) cells in haemopoietic stem cells (HSC), (B) percentage of common myeloid progenitor (CMP), granulocyte-monocyte progenitors (GMP) cells; proliferation of (C) LSK, (D) CMP and (E) GMP cells, (F) Myeloid cells and (G–J) proliferation of neutrophils populations. LysM-cre-NEMO-WT-f/f (NM-WT), LysM-cre-NEMO-K270A-f/f (NM-KA) mice.
Figure 4.
Figure 4.. NEMOK270A mutation hampers autophagy.
PLAT-E cells were transfected with retroviral pMX-Flag-NEMO-WT-RFP (NM-WT) and pMX-flag-NEMO-K270-RFP (NM-KA) expression vector. (A) Fluorescence images showing distribution of NM-WT-RFP in cytoplasm compared to puncta (yellow arrows) (juxtaposed to nuclei- DAPI stained) formation in case of NM-KA-RFP in PLAT-E cells. (B) Western blot for LC3 using WES (protein simple). BMMs were cultured for 2 days with RANKL (preOC) followed by 6 hr of serum starvation and western blotting. Fold change of LC3 relative to actin is indicated on top. (C) Quantification of LC3+ cells per high magnification field. (D) For flow cytometry, BMMs were transduced with pMX-GFP-LC3-RFP retrovirus generated in PLAT-E packing cells, and flow analysis was done to detect GFP signal or LC3 flux. Contour plots showing LC3-GFP+ expressing cells in NM-WT and NM-KA preOC (Blue: NM-WT without serum starvation, Red: NM-KA without serum starvation, and Black: after 6 hr of serum starvation), (E) Histograms representing shift in LC3-GFP+ cells following induction of autophagy (Red histogram: background signal in uninfected cells, Blue histogram: No serum starvation or 10% FBS control, yellow: 6 hr serum starvation, and pink: chloroquine), (F) Change in Mean fluorescent intensity (MFI) showing LC3-GFP signal in NM-WT and NM-KA preOC cells post autophagy induction. LysM-cre-NEMO-WT-f/f (NM-WT), LysM-cre-NEMO-K270A-f/f (NM-KA) mice. (*p<0.05). (*p<0.05, **p<0.01 and ***p<0.001).
Figure 4—figure supplement 1.
Figure 4—figure supplement 1.. Autophagy is negatively impacted in NEMOK270A cells.
(A) Pre-OC (RANKL-treated BMMs) from NM-WT and NM-KA mice were pelleted and processed for electron microscopic and Immunofluorescence (IF) analysis after 6 hr of serum starvation. Representative Electron microscopic images (x7500) showing nucleus, Cell membrane (CM) lysosome (L) in NM-WT preOC and cytoplasmic aggregates (yellow arrow) in NM-KA preOC. (B) Representative IF images for NEMO (red), LC3 (green) and NEMO-LC3 colocalization (yellow). Arrows indicate accumulation of NEMO in LC3 positive vacuole-like structures. (C) Representative western blot showing expression of LC3 from BMMs starved and stimulated with RANKL as shown. (D) Representative Western blot for mTOR expression in BMMs from NM-WT and NM-KA mice treated as shown. (E) Pre-osteoclasts were treated with chloroquine as indicated and number of TRAP+ multi nucleated osteoclasts (MNC) per well were counted in triplicate wells from three independent experiments (*p<0.05).
Figure 5.
Figure 5.. NEMOK270A is restricted to autophagosomes whereas NEMOWT is delivered to lysosomes.
preOC from NM-WT and NM-KA mice were pelleted and processed for Immunofluorescence (IF) and electron microscopic analyses after 6 hr of serum starvation. (A) Representative IF images showing NEMO (red) and LAMP1 (green). Arrows indicate colocalization of NEMO in LAMP1 positive vacuole-like structures in NM-WT, which is decreased in NM-KA preOC. (B) Representative electron microscopic images (x7500) lysosome (L), Autophagosome (AP) and APL (Autophagolysosome). (C) Representative IF images showing changes in cellular NEMO organization in response to autophagy induction by serum starvation in NM-WT and NM-KA preOC cells. NEMO-puncta (white) and nucleus (blue). (D) NEMO-puncta quantification. LysM-cre-NEMO-WT-f/f (NM-WT), LysM-cre-NEMO-K270A-f/f (NM-KA) mice. (*p<0.05, **p<0.01 and ***p<0.001).
Figure 5—figure supplement 1.
Figure 5—figure supplement 1.. preOC from NM-WT and NM-KA mice were processed for Immunofluorescence (IF) analysis after 6 hr of serum starvation.
(A) NEMO-puncta determination in IgG control and (B) chloroquinone (CQ) treated pOC and quantification. (C) NEMO puncta quantification in presence of chloroquinone (CQ).
Figure 6.
Figure 6.. Intact NEMO K270 residue is essential for post-translational modification (PTM) by ISG15.
(A) Volcano plot showing changes in autophagy and PTM related proteins in immunoprecipitated lysates from NM-WT compared with NM-KA BMMs using anti-NEMO antibody. preOC from NM-WT and NM-KA mice were processed for Immunofluorescence (IF) and Immuno-electron microscopy (EM) analysis after 6 hr of serum starvation. (B) Representative IF images of NEMO (red) and ISG15 (green) co-localization in preOC. White arrows indicate foci of expression of ISG15 (enlarged inset at bottom of panel B). Yellow arrows indicating NEMO-ISG15 co-localization. (C) ISGylated proteins (upper panel) and free ISG15 in response to RANKL treatment. (D) BMMs from WT and ISG15-KO mice were isolated and cultured in the presence of MCSF (10 ng/ml) and RANKL (50 ng/ml) for four days. Representative TRAP staining for osteoclast (D) and quantification (E). (**p<0.01).
Figure 6—figure supplement 1.
Figure 6—figure supplement 1.. Representative Immuno-EM images (x7,500) showing localization of NEMO (black arrows) and ISG15 (blue arrow) in NM-WT and NM-KA cells; lysosomes (L), autophagosome (AP).
Large black dot: NEMO (18 nm gold particle), small black dot: ISG15 (12 nm gold particle). BMMs from NM-WT and NM-KA mice cells treated with RANKL for different time points followed by western blot.
Figure 7.
Figure 7.. ISGylation of NEMO is essential to restrain osteoclastogenesis.
BMMs from NM-WT and NM-KA mice were transduced with viral particles (generated by transfecting pMX- retroviral vectors in PLAT-E cells) expressing ISG15 and cultured in the presence of MCSF (10 ng/ml) and RANKL (50 ng/ml) for 4 days. (A) Representative TRAP staining for osteoclast (n = 6) and (B) quantification of TRAP positive OCs. (C) BMMs from NM-WT and NM-KA mice were transduced with ISG15 and pMRX-GFP-LC3-RFP retrovirus generated in PLAT-E packing cells. The cells were cultured for 2 days (preOC) followed by 6 hr of serum starvation and flow analysis to detect GFP signal or LC3 flux. (C) Histograms representing shift in LC3-GFP+ cells following induction of autophagy. Blue histogram: serum starvation, yellow histogram: serum starvation + ISG15 expression (D) Change in Mean Fluorescent Intensity (MFI) showing LC3-GFP signal. (E) Wild type BMMs transduced with viral particles (generated by transfecting pMX- retroviral vectors in PLAT-E cells) expressing NEMO+/-ISG15, NEMO-K270A+/-ISG15 NEMO-WT::ISG15 (fused) and NEMO-K270A::ISG15 (fused) protein and cultured in the presence of MCSF (10 ng/ml) and RANKL (50 ng/ml) for 4 days.(E) Representative TRAP staining for osteoclast (n = 3) and (F) quantification of TRAP positive OCs. (G) NEMO puncta regulation by ISG15: Live images of preOC expressing RFP-NEMOWT+/-ISG15, RFP-NEMOK270A+/-ISG15, GFP-NEMOWT::ISG15 and GFP-NEMOK270A::ISG15 fusion protein. Yellow arrows indicate NEMOK270A puncta. ISG15 panel which is not tagged serves as background control. (H) Quantification of LC3 puncta+ preOC cells shown in Figure 7—figure supplement 1. (I) WB for LC3 in preOC expressing NEMOWT+/-ISG15, NEMOK270A+/-ISG15, NEMOWT::ISG15 and NEMOK270A::ISG15 fusion protein. (*p<0.05, **p<0.01 and ***p<0.001). (::) denotes fusion. (J) Representative IF images (NEMO (Red); LAMP1(green)). NEMO localization in preOC expressing NEMOWT+/-ISG15, NEMOK270A+/-ISG15, NEMOWT::ISG15 and NEMOK270A::ISG15 fusion protein. Green arrow- Lysosome and Yellow arrow-localization of NEMO in Lysosome.
Figure 7—figure supplement 1.
Figure 7—figure supplement 1.. LC3 puncta accumulation of NEMOK270A is reduced by forced fusion with ISG15.
(A) Representative IF images for LC3 puncta+ cells (arrow) in preOC expressing NEMOWT+/-ISG15, NEMOK270A+/-ISG15, NEMOWT::ISG15 and NEMOK270A::ISG15 fusion protein (quantified in Figure 7H).

Similar articles

Cited by

References

    1. Abu-Amer Y. Inflammation, Cancer, and bone loss. Current Opinion in Pharmacology. 2009;9:427–433. doi: 10.1016/j.coph.2009.06.007. - DOI - PMC - PubMed
    1. Abu-Amer Y. NF-κB signaling and bone resorption. Osteoporosis International. 2013;24:2377–2386. doi: 10.1007/s00198-013-2313-x. - DOI - PMC - PubMed
    1. Abu-Amer Y, Faccio R. Therapeutic approaches in bone pathogeneses: targeting the IKK/NF-κB Axis. Future Rheumatology. 2006;1:133–146. doi: 10.2217/17460816.1.1.133. - DOI
    1. Alhawagri M, Yamanaka Y, Ballard D, Oltz E, Abu-Amer Y. Lysine392, a K63-linked ubiquitination site in NEMO, mediates inflammatory osteoclastogenesis and osteolysis. Journal of Orthopaedic Research. 2012;30:554–560. doi: 10.1002/jor.21555. - DOI - PMC - PubMed
    1. Bloor S, Ryzhakov G, Wagner S, Butler PJG, Smith DL, Krumbach R, Dikic I, Randow F. Signal processing by its coil zipper domain activates IKK . PNAS. 2008;105:1279–1284. doi: 10.1073/pnas.0706552105. - DOI - PMC - PubMed

Publication types

MeSH terms