. 2020 Mar;18(2):130-142.
doi: 10.2450/2020.0256-19. Epub 2020 Feb 28.

Decoding the metabolic landscape of pathophysiological stress-induced cell death in anucleate red blood cells

Affiliations

Decoding the metabolic landscape of pathophysiological stress-induced cell death in anucleate red blood cells

Travis Nemkov et al. Blood Transfus. 2020 Mar.

Abstract

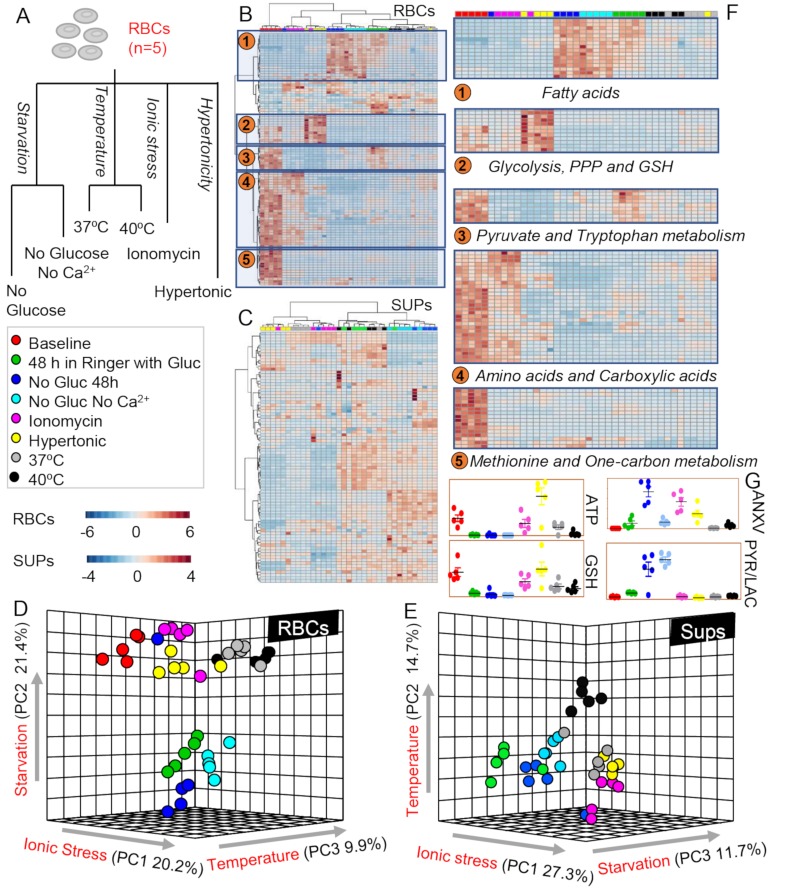
Background: In response to stress, anucleate red blood cells (RBCs) can undergo a process of atypical cell death characterised by intracellular Ca2+ accumulation and phosphatidylserine (PS) externalisation. Here we studied alterations in RBC metabolism, a critical contributor to their capacity to survive environmental challenges, during this process.

Materials and methods: Metabolomics analyses of RBCs and supernatants, using ultra-high-pressure liquid chromatography coupled to mass spectrometry, were performed after in vitro exposure of RBCs to different pathophysiological cell stressors, including starvation, extracellular hypertonicity, hyperthermia, and supraphysiological ionic stress. Cell death was examined by flow cytometry.

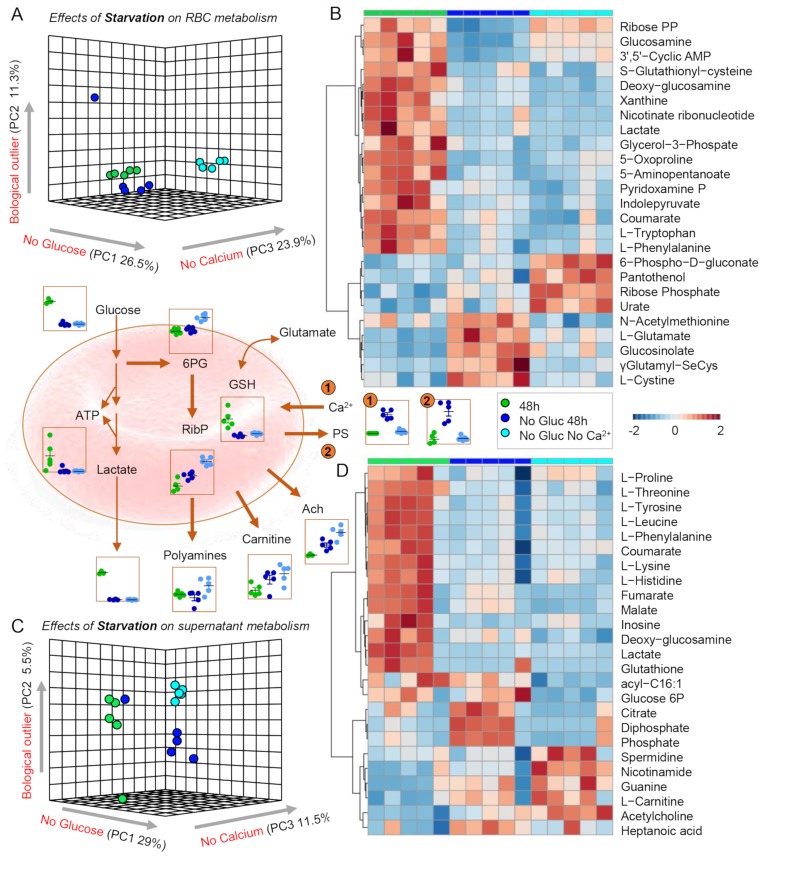
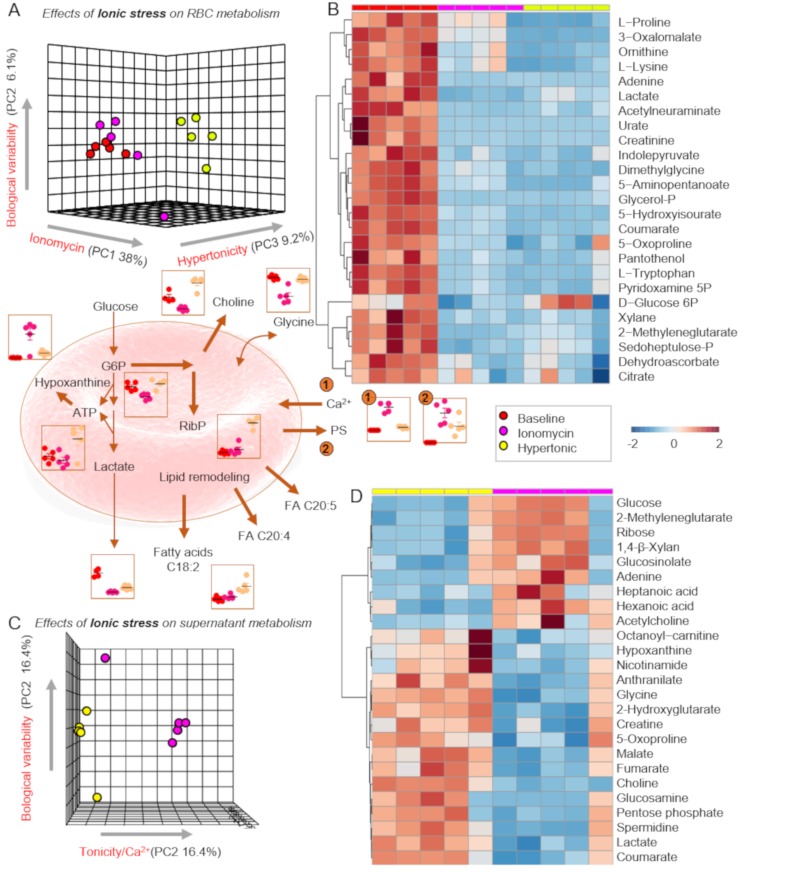
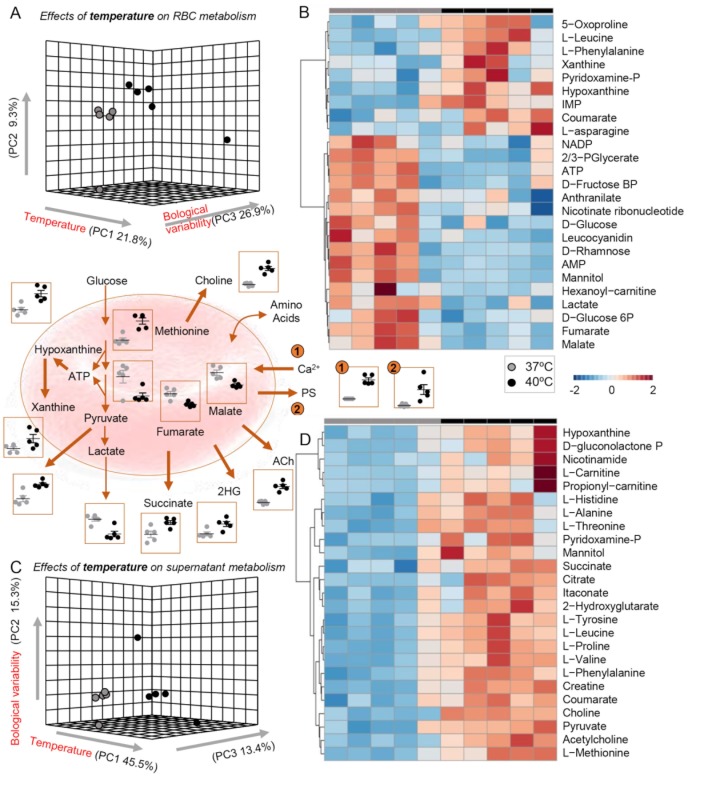
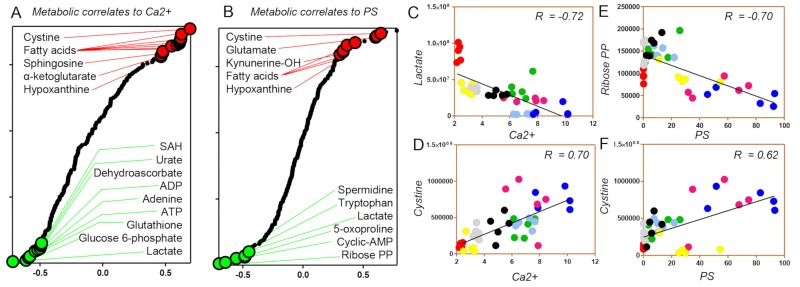
Results: Our data show that artificially enhancing RBC cytosolic Ca2+ influx significantly enhanced purine oxidation and strongly affected cellular bioenergetics by reducing glycolysis. Depleting extracellular Ca2+ curtailed starvation-induced cell death, an effect paralleled by the activation of compensatory pathways such as the pentose phosphate pathway, carboxylic acid metabolism, increased pyruvate to lactate ratios (methemoglobin reductase activation), one-carbon metabolism (protein-damage repair) and glutathione synthesis; RBCs exposed to hypertonic shock displayed a similar metabolic profile. Furthermore, cell stress promoted lipid remodelling as reflected by the levels of free fatty acids, acyl-carnitines and CoA precursors. Notably, RBC PS exposure, independently of the stressor, showed significant correlation with the levels of free fatty acids, glutamate, cystine, spermidine, tryptophan, 5-oxoproline, lactate, and hypoxanthine.

Discussion: In conclusion, different cell death-inducing pathophysiological stressors, encountered in various clinical conditions, result in differential RBC metabolic phenotypes, only partly explained by intracellular Ca2+ levels and ATP availability.


Conflict of interest statement

CONFLICT OF INTERESTS

Though unrelated to the contents of the manuscript, the authors declare that AD and TN are founder of Omix Technologies Inc. and Altis Bioscience LLC. All the other authors have no conflicts of interest to disclose.

Figures

Figure 1
Figure 1
Metabolomics profiling of cell death-inducing stresses in red blood cells (RBCs) and supernatants. Overview of the experimental design. Briefly, RBCs were either tested at baseline (red) or incubated for 48 hours (h) in Ringer’s solution (green). RBCs were either stressed by starvation, i.e., without glucose (dark blue), without glucose and Ca2+ (light blue) or ionic stress, i.e., incubation in presence of ionomycin (violet) or under hypertonic conditions (yellow). RBCs were independently incubated for 12 h at 37ºC (grey) or 40ºC (black) to test the impact of temperature on RBC metabolism. (B and C) and (D and E) Heat maps with hierarchical clustering of the top 50 significant metabolites by ANOVA and partial least square-discriminant analyses (PLS-DA) are shown for RBCs and supernatants, respectively. (F) Top metabolic pathways impacted by the various stresses are highlighted. (G) RBC key metabolites are highlighted, colour-coded as per the legend on the left-hand side of the figure. ANXV: Annexin V binding; ATP: adenosine triphosphate; Gluc: glucose; GSH: glutathione; PPP: pentose phosphate pathway; PYR/LAC: pyruvate to lactate ratio.
Figure 2
Figure 2
Metabolic impact of energy starvation. (A and C) Partial least square-discriminant analyses (PLS-DA) reveals significant impact of both glucose starvation and glucose starvation in the absence of Ca2+ in red blood cells (RBCs) and supernatants, respectively. (B and D) Top 25 significant metabolites following starvation stress by ANOVA in RBCs and supernatants, respectively. Key metabolites are highlighted in the dot plots in the centre of the figure, colour-coded as per the legend on the right-hand side of the figure. Ach: acetylcholine; ATP: adenosine triphosphate; GSH: glutathione; PS: phosphatidylserine; RibP: ribose phosphate; 6PG: 6-phosphogluconolactone.
Figure 3
Figure 3
Metabolic impact of supraphysiological ionic and hypertonic stress. (A and C) Partial least square-discriminant analyses (PLS-DA) reveals significant impact of ionic stress induced by ionomycin (which induces increases in intracellular Ca2+) or hypertonic stress in red blood cells (RBCs) and supernatants, respectively. (B and D) Top 25 significant metabolites by ANOVA in RBCs and supernatants are shown. Key metabolites are highlighted in the dot plots in the centre of the figure, colour-coded as per the legend on the right-hand side of the figure. ATP: adenosine triphosphate; G6P: glucose 6-phosphate; PS: phosphatidylserine; RibP: ribose phosphate.
Figure 4
Figure 4
Metabolic impact of hyperthermic stress. (A and C) Partial least square-discriminant analyses (PLS-DA) reveals significant impact of high fever-like temperatures on RBCs and supernatants, respectively. (B and D) Top 25 significant metabolites following heat stress by ANOVA in RBCs and supernatants, respectively. Key metabolites are highlighted in the dot plots in the centre of the figure, colour-coded as per the legend on the right-hand side of the figure. Ach: acetylcholine; ATP: adenosine triphosphate; 2HG: hydoxyglutarate.
Figure 5
Figure 5
Correlation analyses between red blood cell (RBC) death and metabolism. Correlation analyses between metabolite measurements and intracellular Ca2+ level (A) or phosphatidylserine (PS) exposure (B). (C and D) Intracellular lactate or cystine levels are negative and positive correlates to intracellular Ca2+ levels, respectively. (E and F) Intracellular ibose-diphosphate or cystine levels are negative and positive correlates to PS exposure levels, respectively. (C–F) Stresses are colour-coded as in Figure 1. ADP: adenosine diphosphate; ATP: adenosine triphosphate; SAH: S-adenosylhomocysteine.

Comment in

  • "Valar morghulis": all red cells must die.
    Georgatzakou HT, Antonelou MH, Papageorgiou EG, Kriebardis AG. Georgatzakou HT, et al. Blood Transfus. 2020 Mar;18(2):83-85. doi: 10.2450/2020.0028-20. Epub 2020 Mar 17. Blood Transfus. 2020. PMID: 32203010 Free PMC article. No abstract available.

References

    1. Antonelou MH, Kriebardis AG, Papassideri IS. Aging and death signalling in mature red cells: from basic science to transfusion practice. Blood Transfus. 2010;8(Suppl 3):s39–47. - PMC - PubMed
    1. Lutz HU, Bogdanova A. Mechanisms tagging senescent red blood cells for clearance in healthy humans. Front Physiol. 2013;4:387. - PMC - PubMed
    1. Lang E, Qadri SM, Lang F. Killing me softly - suicidal erythrocyte death. Int J Biochem Cell Biol. 2012;44:1236–43. - PubMed
    1. Qadri SM, Bissinger R, Solh Z, Oldenborg PA. Eryptosis in health and disease: a paradigm shift towards understanding the (patho) physiological implications of programmed cell death of erythrocytes. Blood Rev. 2017;31:349–61. - PubMed
    1. Pretorius E, du Plooy JN, Bester J. A comprehensive review on eryptosis. Cell Physiol Biochem. 2016;39:1977–2000. - PubMed

Publication types