. 2020 May;44(5):1087-1096.
doi: 10.1038/s41366-020-0561-3. Epub 2020 Mar 13.

Impact of maternal obesity on placental transcriptome and morphology associated with fetal growth restriction in mice

Affiliations

Impact of maternal obesity on placental transcriptome and morphology associated with fetal growth restriction in mice

Daniela de Barros Mucci et al. Int J Obes (Lond). 2020 May.

Abstract

Background: In utero exposure to obesity is consistently associated with increased risk of metabolic disease, obesity and cardiovascular dysfunction in later life despite the divergence of birth weight outcomes. The placenta plays a critical role in offspring development and long-term health, as it mediates the crosstalk between the maternal and fetal environments. However, its phenotypic and molecular modifications in the context of maternal obesity associated with fetal growth restriction (FGR) remain poorly understood.

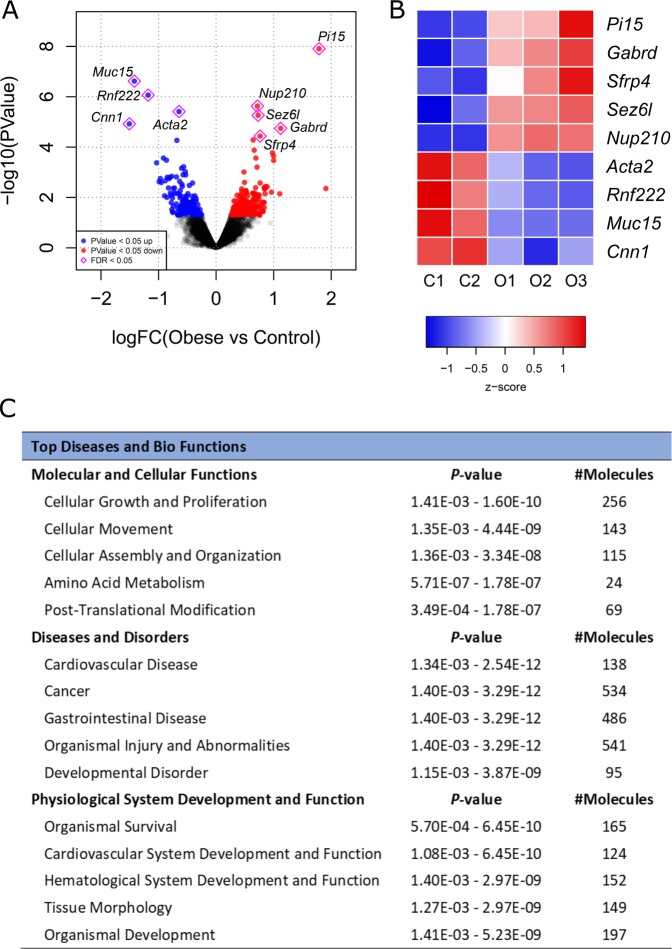
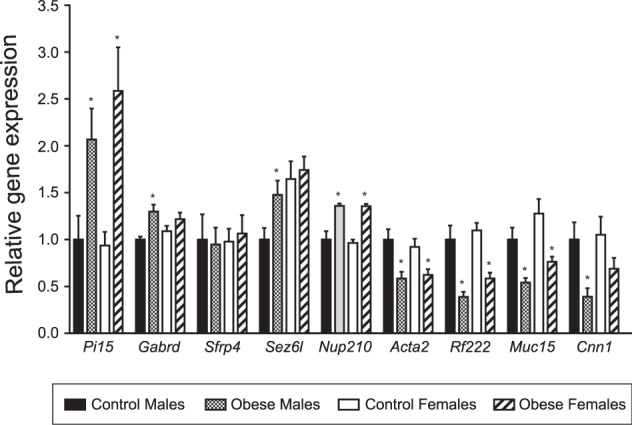
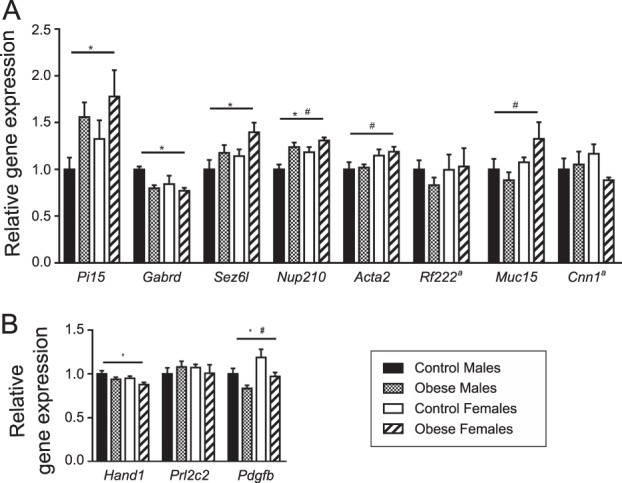
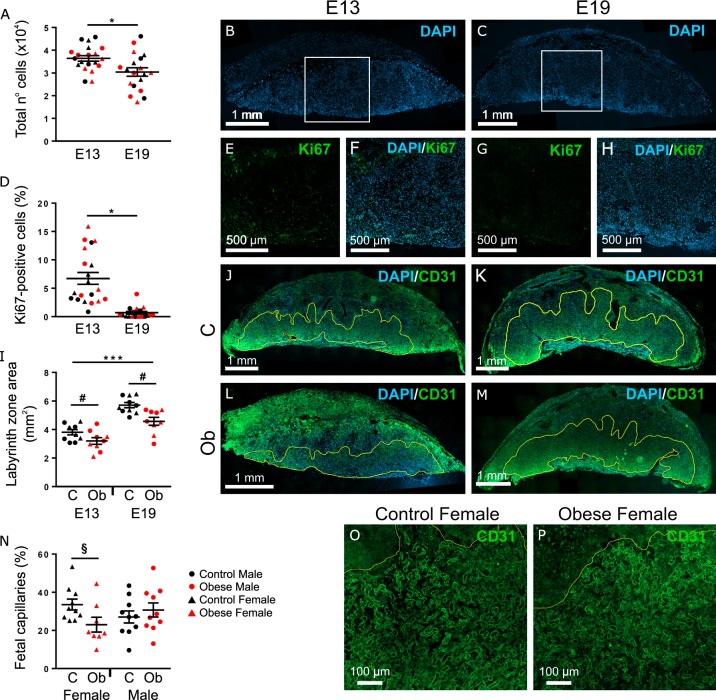
Methods: Using a mouse model of maternal diet-induced obesity, we investigated changes in the placental transcriptome through RNA sequencing (RNA-seq) and Ingenuity Pathway Analysis (IPA) at embryonic day (E) 19. The most differentially expressed genes (FDR < 0.05) were validated by Quantitative real-time PCR (qPCR) in male and female placentae at E19. The expression of these targets and related genes was also determined by qPCR at E13 to examine whether the observed alterations had an earlier onset at mid-gestation. Structural analyses were performed using immunofluorescent staining against Ki67 and CD31 to investigate phenotypic outcomes at both timepoints.

Results: RNA-seq and IPA analyses revealed differential expression of transcripts and pathway interactions related to placental vascular development and tissue morphology in obese placentae at term, including downregulation of Muc15, Cnn1, and Acta2. Pdgfb, which is implicated in labyrinthine layer development, was downregulated in obese placentae at E13. This was consistent with the morphological evidence of reduced labyrinth zone (LZ) size, as well as lower fetal weight at both timepoints irrespective of offspring sex.

Conclusions: Maternal obesity results in abnormal placental LZ development and impaired vascularization, which may mediate the observed FGR through reduced transfer of nutrients across the placenta.


Conflict of interest statement

DBM was the recipient of a FAPERJ sandwich doctorate scholarship (Carlos Chagas Filho Research Support Foundation—FAPERJ—Brazil—E-26/ 200.090/2016). PW is a recipient of a Wellcome Trust studentship (Wellcome—215242/Z/19/Z). LCP was the recipient of a CNPq Science Without Borders Post-Doctoral Fellowship (National Council of Technological and Scientific Development—CNPq—Brazil—PDE/204416/2014–0). The authors declare that they have no conflict of interest.

Figures

Fig. 1
Fig. 1. RNA-seq identification of differentially expressed genes between Control (C, n = 2) and Obese (O, n = 3) male mouse placentae at E19.
a Volcano plot representing all detected transcripts, distributed according to −log10 P value in the y-axis and log2 fold change in the x-axis, with downregulated genes shifted to the left (P < 0.05 in blue) and upregulated genes shifted to the right (P < 0.05 in red). Significantly altered genes after correction for multiple testing (FDR < 0.05) are depicted with a pink diamond. b Heatmap representation of genes significantly regulated by maternal obesity using a cutoff FDR < 0.05, with scaled Z-score color key of normalized counts showing expression levels ranging from blue (lower) to red (higher). Genes are sorted from lowest to highest log2 fold change value. c Top diseases and bio functions from Ingenuity® Pathway Analysis (IPA) of the RNA-seq data with a threshold of P < 0.05, showing the most significant molecular and cellular functions dysregulated in the placenta by maternal obesity, sorted by P value.
Fig. 2
Fig. 2. Validation of RNA-seq data by qPCR in E19 male and female placentae.
qPCR results were normalized to the reference genes Gapdh and Sdha and are expressed as mean ± SEM in arbitrary units relative to Male Controls. *P < 0.05, determined by Student’s t test comparing qPCR data of same sex Control vs Obese, n = 9/group.
Fig. 3
Fig. 3. qPCR expression in E13 male and female placentae.
a Validated RNA-seq genes. b Hand1, required for trophoblast giant cell (TGC) differentiation; Prl2c2, a marker of spiral artery-associated TGC and canal-associated TGC; Pdgfb, a growth factor that regulates placental labyrinthine layer development. qPCR data were normalized to the reference genes Gapdh and Pmm1. Results are shown as mean ± SEM in arbitrary units relative to Male Control average expression. *Denotes maternal obesity effect (P < 0.05) and # denotes sex difference (P < 0.05), according to two-way ANOVA, n = 10/group. ªRnf222 and Cnn1 expression levels were low at E13 placentae, with average Cq values above 31 and 29, respectively.
Fig. 4
Fig. 4. Immunofluorescent staining of targets related to the top three molecular and cellular functions shown in IPA.
All analyses were conducted in both male and female placentae of mothers fed either regular chow (C, Control group) or obesogenic diet (Ob, Obese group), at E13 and E19. ac The total number of cells in the placenta decreased between E13 (n = 20) and E19 (n = 19). dh The proportion of Ki67-positive cells across the whole placenta decreased between E13 (n = 20) and E19 (n = 19). im The size of the labyrinth zone increased between E13 and E19, and was reduced in response to maternal obesity (C n = 10, Ob n = 9, at each time point). np The proportion of fetal capillaries within the labyrinth zone was decreased by maternal obesogenic diet in females (C n = 10, Ob n = 9). a, d, i, n Results are shown as mean ± SEM. Gestational age differences are denoted by *P < 0.05, **P < 0.001, or ***P < 0.0001, and maternal obesity effect is indicated by #P < 0.001, according to three-way ANOVA. §Denotes maternal obesity effect (P < 0.05), determined by two-way ANOVA analysis of E13 and E19 female placentae only.

References

    1. WHO. World Health Organization: obesity and overweight. Fact sheet No. 311. 2018 [updated 16 February 2018]. http://www.who.int/news-room/fact-sheets/detail/obesity-and-overweight.
    1. Chen C, Xu X, Yan Y. Estimated global overweight and obesity burden in pregnant women based on panel data model. PLoS ONE. 2018;13:e0202183. doi: 10.1371/journal.pone.0202183. - DOI - PMC - PubMed
    1. Marchi J, Berg M, Dencker A, Olander EK, Begley C. Risks associated with obesity in pregnancy, for the mother and baby: a systematic review of reviews. Obes Rev. 2015;16:621–38. doi: 10.1111/obr.12288. - DOI - PubMed
    1. Godfrey KM, Reynolds RM, Prescott SL, Nyirenda M, Jaddoe VW, Eriksson JG, et al. Influence of maternal obesity on the long-term health of offspring. The Lancet Diabetes Endocrinol. 2017;5:53–64. doi: 10.1016/S2213-8587(16)30107-3. - DOI - PMC - PubMed
    1. Yu Z, Han S, Zhu J, Sun X, Ji C, Guo X. Pre-pregnancy body mass index in relation to infant birth weight and offspring overweight/obesity: a systematic review and meta-analysis. PloS ONE. 2013;8:e61627. doi: 10.1371/journal.pone.0061627. - DOI - PMC - PubMed

Publication types