. 2020 May;30(5):376-392.
doi: 10.1038/s41422-020-0300-2. Epub 2020 Mar 20.

Embryonic endothelial evolution towards first hematopoietic stem cells revealed by single-cell transcriptomic and functional analyses

Affiliations

Embryonic endothelial evolution towards first hematopoietic stem cells revealed by single-cell transcriptomic and functional analyses

Siyuan Hou et al. Cell Res. 2020 May.

Abstract

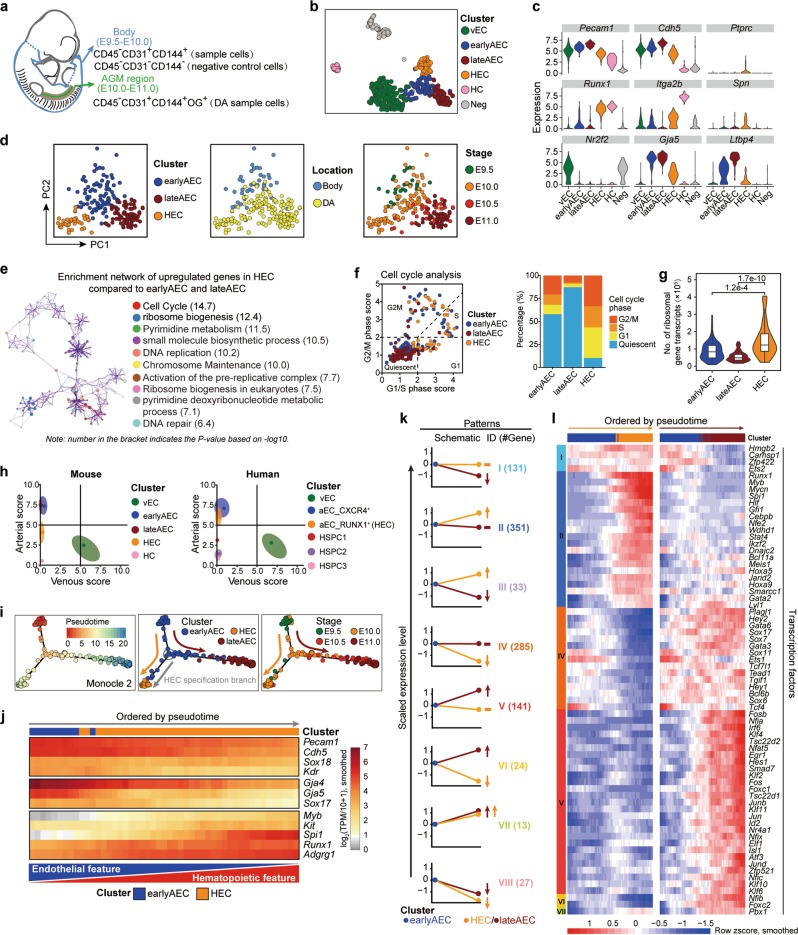
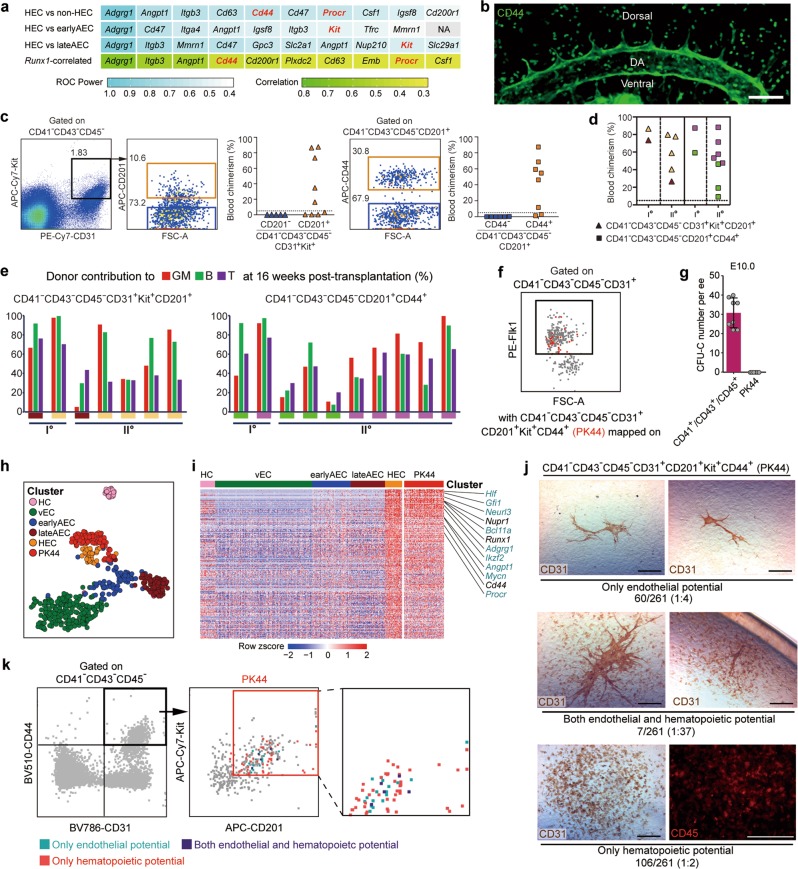
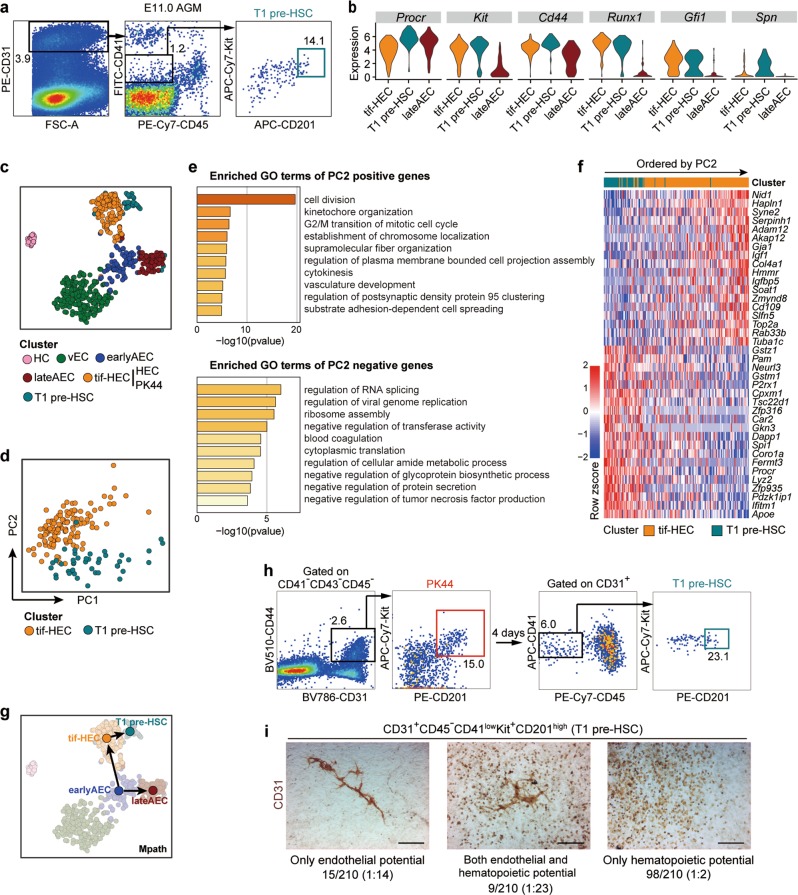
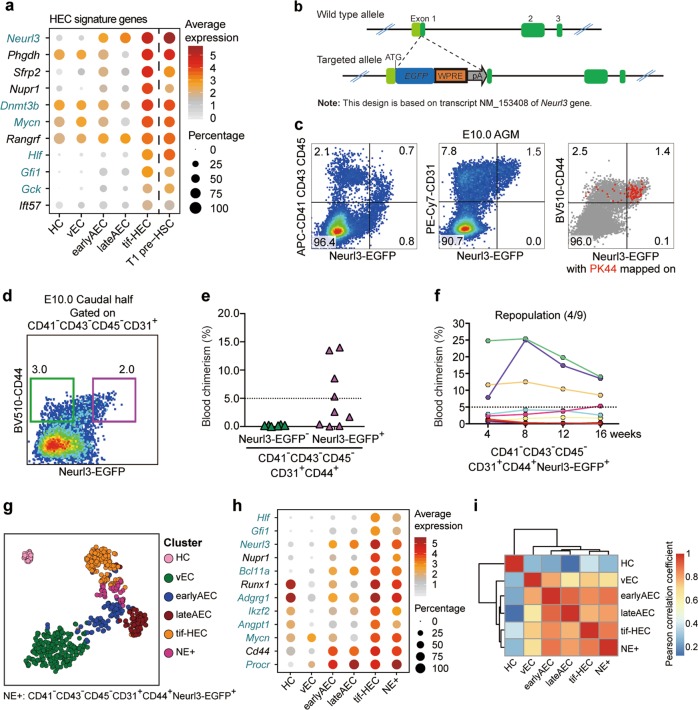
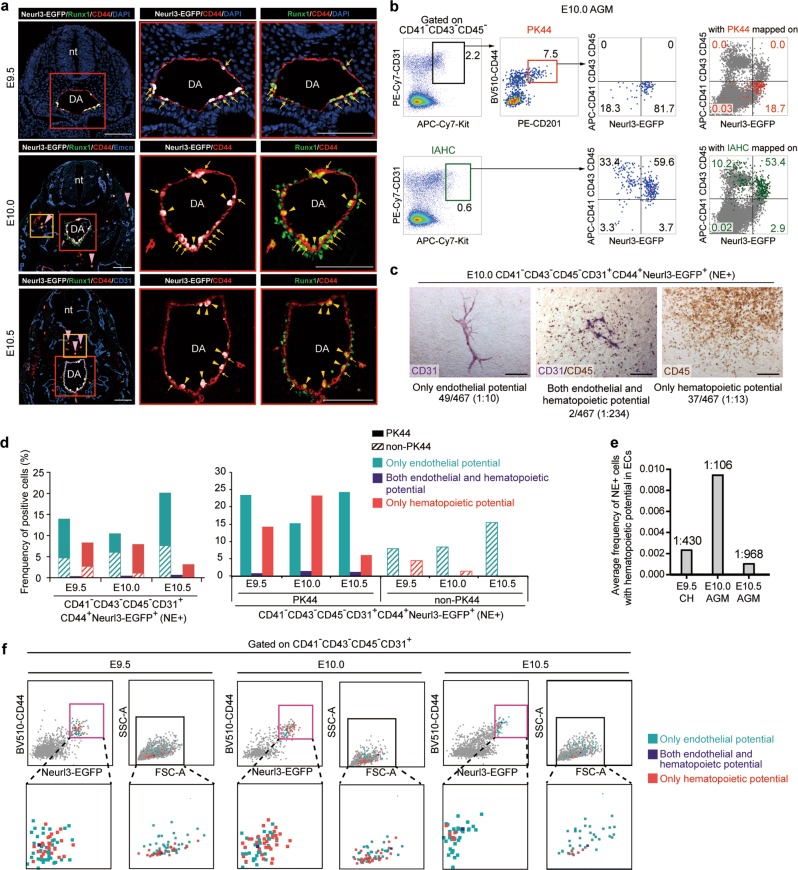
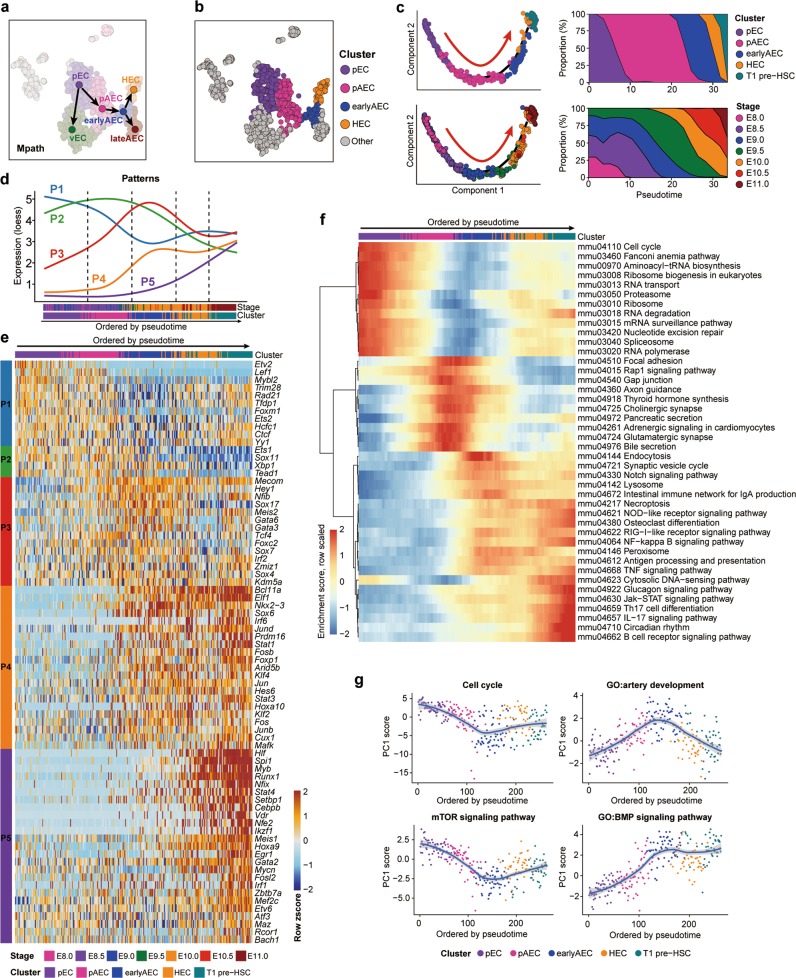
Hematopoietic stem cells (HSCs) in adults are believed to be born from hemogenic endothelial cells (HECs) in mid-gestational embryos. Due to the rare and transient nature, the HSC-competent HECs have never been stringently identified and accurately captured, let alone their genuine vascular precursors. Here, we first used high-precision single-cell transcriptomics to unbiasedly examine the relevant EC populations at continuous developmental stages with intervals of 0.5 days from embryonic day (E) 9.5 to E11.0. As a consequence, we transcriptomically identified two molecularly different arterial EC populations and putative HSC-primed HECs, whose number peaked at E10.0 and sharply decreased thereafter, in the dorsal aorta of the aorta-gonad-mesonephros (AGM) region. Combining computational prediction and in vivo functional validation, we precisely captured HSC-competent HECs by the newly constructed Neurl3-EGFP reporter mouse model, and realized the enrichment further by a combination of surface markers (Procr+Kit+CD44+, PK44). Surprisingly, the endothelial-hematopoietic dual potential was rarely but reliably witnessed in the cultures of single HECs. Noteworthy, primitive vascular ECs from E8.0 experienced two-step fate choices to become HSC-primed HECs, namely an initial arterial fate choice followed by a hemogenic fate conversion. This finding resolves several previously observed contradictions. Taken together, comprehensive understanding of endothelial evolutions and molecular programs underlying HSC-primed HEC specification in vivo will facilitate future investigations directing HSC production in vitro.


Conflict of interest statement

The authors declare no competing interests.

Figures

Fig. 1
Fig. 1. Transcriptomic identification and molecular characteristics of the HECs in the AGM region.
a Schematic illustration of the strategies used for embryo dissection and cell preparation for the subsequent scRNA-seq. The involved body part and the AGM region is indicated as blue and green, respectively, with head, limb buds, heart, visceral bud, and umbilical and vitelline vessels outside the embryo proper excluded. b t-SNE plots with clusters mapped onto it. c Violin plots showing the expression levels of indicated genes in six clusters identified in the initial dataset. d PCA plots with three clusters (earlyAEC, lateAEC and HEC) (left), sampling locations (middle) and embryonic stages (right) mapped onto it. e Metascape network enrichment analysis with top 10 enriched terms exhibited on the right. Each cluster is represented by different colors and each enriched term is represented by a circle node. Number in the bracket indicates the P value based on −log10. f Classification of the indicated cells into quiescent phase and other cycling phases (G1, S and G2M) based on the average expression of G1/S and G2/M gene sets (left). Stacked bar chart showing the constitution of different cell cycle phases in the three corresponding clusters shown on the left (right). g Violin plot showing the number of transcripts for ribosome-related genes detected in each single cell of the indicated clusters. Wilcoxon Rank Sum test is employed to test the significance of difference and P values are indicated for the comparison. P < 0.05 is considered statistically significant. h Scatterplot showing the average arteriovenous scores of the cells in each cluster for mouse dataset in this paper (left) and human dataset from a published article (right), respectively. Main distribution ranges of arteriovenous scores in each cluster are also indicated as an oval shape. i Pseudotemporal ordering of the cells in three selected clusters inferred by monocle 2, with pseudotime (left), clusters (middle) and sampling stages (right) mapped to it. HEC specification and AEC maturation directions are indicated as orange and deep red arrows, respectively. j Heatmap showing the expression of the indicated genes (smoothed over 15 adjacent cells) with cells ordered along the pseudotime axis of HEC specification branch inferred by monocle 2. k Eight major expression patterns identified from the differentially expressed genes in HEC or lateAEC as compared to earlyAEC. Arrows showing the changes in HEC or lateAEC as compared to earlyAEC. The numbers of pattern genes are indicated on the right. l Heatmaps showing the relative expressions (smoothed over 20 adjacent cells) of the TFs belonging to the pattern genes with cells ordered along the pseudotime axis and genes ordered by patterns.
Fig. 2
Fig. 2. Efficient isolation of the HSC-competent and endothelial-hematopoietic dual-potent HECs before HSC emergence.
a Gene lists of the top ten cell surface molecules significantly overrepresented in HEC as compared to the indicated cell populations (first 3 lines) and those positively correlated with Runx1 within 4 EC clusters (vEC, earlyAEC, lateAEC and HEC, last line). Non-HEC, cells except for HEC within 4 EC clusters. Highlights in red font indicate the candidates used for further functional analysis. b Representative whole-mount staining of CD44 at E10.0 AGM region, showing CD44 is expressed in the whole endothelial layer of the dorsal aorta and roots of its proximal branches. DA, dorsal aorta; Scale bar, 100 μm. c Representative FACS plots for cell sorting of the E9.5-E10.0 caudal half for co-culture/transplantation assay and the donor chimerism at 16 weeks after transplantation of the derivatives of the indicated cell populations. d Blood chimerism of the primary (Io) and corresponding secondary (IIo) recipients at 16 weeks post-transplantation. The primary recipients were transplanted with the derivatives of the indicated cells from the caudal half of E9.5-E10.0 embryos. The paired primary and corresponding secondary repopulated mice are shown as the same symbol and color. e Bars represent the percent donor contribution to the granulocytes/monocytes (GM, red), B lymphocytes (green), and T lymphocytes (purple) in the peripheral blood of the primary (I°) and secondary (II°) recipients at 16 weeks post-transplantation. The paired primary and corresponding secondary repopulated mice are shown as the same colors below. f FACS plot of Flk1 expression in the indicated population of E10.0 AGM region, with PK44 (CD41CD43CD45CD31+CD201+Kit+CD44+) cells (red) mapped onto it. Box indicates the gate of Flk1+ cells. g Number of hematopoietic progenitors per embryo equivalent (ee) in the indicated populations derived from E10.0 caudal half measured by the methylcellulose colony forming unit-culture (CFU-C) assay. Data are means ± SD. Data are from 4 independent experiments. h t-SNE plot of the cells included in the filtered initial dataset and PK44 dataset, with clusters mapped on it. PK44, CD41CD43CD45CD31+CD201+Kit+CD44+ population from E10.0 AGM region. i Heatmap showing the relative expressions of HEC feature genes, which are defined as those significantly highly expressed as compared to others including HC, vEC, earlyAEC and lateAEC, in the indicated cell populations. Selected HEC feature genes are shown on the right with pre-HSC signature genes marked as aquamarine. j Representative CD31 and CD45 immunostaining on the cultures of single PK44 cells from E10.0 AGM region, showing typical morphologies regarding distinct differentiation potentials. Cell frequencies of each kind of potential are also shown. Data are from 5 independent experiments with totally 15 embryos used. Scale bars, 400 μm. k Expression of Kit and CD201 in the index-sorted single PK44 cells with differentiation potential based on in vitro functional evaluation. Cells with different kinds of potentials are mapped onto the reference FACS plots (gray dots). Box in the middle plot indicates the gate for FACS sorting of PK44 cells in E10.0 AGM region and its enlarged view is shown on the right.
Fig. 3
Fig. 3. Relationship between HSC-primed HECs and T1 pre-HSCs.
a Representative FACS plots for sorting of the T1 pre-HSCs (CD31+CD45CD41lowKit+CD201high) from E11.0 AGM region of mouse embryos for the subsequent scRNA-seq. b Violin plots showing the expression levels of indicated genes in tif-HEC (including clusters HEC and PK44), T1 pre-HSC and lateAEC. c t-SNE plot of the cells included in the filtered initial dataset, PK44 dataset and T1 pre-HSC dataset, with clusters mapped on it. Clusters HEC and PK44 are combined as tif-HEC. d PCA plot of tif-HEC and T1 pre-HSC populations. e. Enriched terms of PC2-positive and -negative genes are shown, corresponding to the properties distinguishing tif-HEC and T1 pre-HSC, respectively. f Heatmap showing top 20 positive and negative genes of PC2. Genes are ordered by their contributions to PC2. g Trajectory of AEC clusters, tif-HEC and T1 pre-HSC inferred by Mpath. Arrows indicate the development directions predicted by sampling stages. h Representative FACS plots for sorting of the PK44 cells from E10.0 AGM region (left) and analysis of the immunophenotypic T1 pre-HSCs (right) after cultured in vitro for 4 days. i Representative CD31 immunostaining on the cultures of single T1 pre-HSCs from E11.0 AGM region, showing typical morphologies regarding distinct differentiation capacities. Cell frequencies of each type are also shown. Data are from 7 independent experiments with totally 89 embryos used. Scale bars, 400 μm.
Fig. 4
Fig. 4. Identifying Neurl3 as a signature gene of HSC-primed HECs validated by functional and transcriptomic evaluation.
a Dot plot showing the average and percentage expression of HEC signature genes in the indicated clusters. Genes are ordered by their median expression level in tif-HEC. Pre-HSC signature genes are marked as aquamarine. b Schematic model of the gene-targeting strategy for generating Neurl3EGFP/+ reporter mouse line via CRISPR/Cas9 system. c Representative FACS analysis of the E10.0 AGM region in Neurl3EGFP/+ embryos. FACS plot on the right shows PK44 cells (red dots) mapped on it. d Representative FACS plot for sorting of the indicated cell populations from E10.0 caudal half of Neurl3EGFP/+ embryos for the subsequent co-culture and transplantation assay. e Graph showing the donor chimerism at 16 weeks after transplantation of the derivatives of the indicated populations from the caudal half of E10.0 Neurl3EGFP/+ embryos. f Graph showing the donor chimerism at 4–16 weeks post-transplantation. The recipients were transplanted with the derivatives of CD41CD43CD45CD31+CD44+Neurl3-EGFP+ population from the caudal half of E10.0 Neurl3EGFP/+ embryos. Number of repopulated/total recipients is shown in the brackets. g t-SNE plot of the cells included in the filtered initial dataset and additional PK44 and NE+ datasets, with clusters mapped on it. The HEC and PK44 clusters are combined as tif-HEC. NE+, CD41CD43CD45CD31+CD44+Neurl3-EGFP+ population from E10.0 AGM region. h Dot plot showing the average and percentage expression of selected HEC feature genes in the indicated clusters. Pre-HSC signature genes are marked as aquamarine. i Heatmap showing the correlation coefficient between each two clusters with hierarchical clustering using average method. Pearson correlation coefficient is calculated using average expression of highly variable genes in each cluster.
Fig. 5
Fig. 5. In situ localization and in vitro function of the dynamic HECs marked by Neurl3-EGFP reporter.
a Representative immunostaining on cross sections at the AGM region of E9.5 (upper), E10.0 (middle) and E10.5 (lower) Neurl3EGFP/+ embryos. Arrows indicate Neurl3-EGFP+ aortic ECs. Yellow arrowheads indicate Neurl3-EGFP+ bulging and bulged cells and also IAHCs. White pink arrowheads indicate CD44+Runx1+Neurl3 hematopoietic cells distributed outside the aorta. The high magnification views of yellow boxes are shown in Supplemental information, Fig. S3g. nt, neural tube; DA, dorsal aorta. Scale bars, 100 μm. b Representative FACS analysis of the E10.0 AGM region of Neurl3EGFP/+ embryos. FACS plots on the right showing PK44 cells (red dots, upper) and IAHC (CD31+Kithigh) cells (green dots, lower) mapped on, respectively, with their contributions to the population in each gated quadrant indicated. c Representative CD31 and CD45 immunostaining on the cultures of single NE+ (CD41CD43CD45CD31+CD44+Neurl3-EGFP+) cells from E10.0 AGM region of Neurl3EGFP/+ embryos, showing typical morphologies regarding distinct differentiation potentials. Cell frequencies of each kind of potential are also shown. Data are from 5 independent experiments with totally 37 embryos used. Scale bars, 400 μm. d Column charts showing the frequencies of positive cells in the indicated populations (lower) for each kind of potential. The experiments were performed with NE+ (CD41CD43CD45CD31+CD44+Neurl3-EGFP+) single cells from E9.5 caudal half or E10.0-E10.5 AGM region of Neurl3EGFP/+ embryos with PK44 indexed. Progenies from PK44 and non-PK44 fractions within NE+ cells are represented by distinct fill patterns. e Graph showing the average frequencies of the NE+ (CD41CD43CD45CD31+CD44+Neurl3-EGFP+) cells with hematopoietic potential in ECs (CD41CD43CD45CD31+) in E9.5 caudal half (CH) or E10.0–E10.5 AGM region of Neurl3EGFP/+ embryos. f Expression of CD44 and Neurl3-EGFP and values of FSC-A and SSC-A in the index-sorted single NE+ (CD41CD43CD45CD31+CD44+Neurl3-EGFP+) cells with differentiation potential based on in vitro functional evaluation. Cells with different kinds of potentials are mapped onto the reference FACS plots (gray dots). Pink boxes indicate the gates of the populations for FACS sorting. The enlarged views of solid boxes are shown below.
Fig. 6
Fig. 6. Molecular evolution underlying the specification of HSC-primed HECs from primitive vascular ECs.
a Trajectories of pEC, vEC, pAEC, earlyAEC, lateAEC and HEC inferred by Mpath. Arrows indicate the development directions predicted by sampling stages. b t-SNE plot showing the distribution of the four clusters involved in hemogenic specification. Other cells are in gray. c Pseudotemporal ordering of the cells included in the indicated five clusters inferred by monocle 2 (left), with clusters (upper left) and sampling stages (lower left) mapped to it. HEC specification directions are indicated as red arrows. Smooth distributions of clusters (upper right) and sampling stages (lower right) along pseudotime by using Gaussian kernel density estimate are shown. d Dynamic changes of five gene expression patterns along the trajectory ordered by pseudotime inferred by monocle 2. For each pattern, principal curves are fitted on expression levels of the genes in that pattern along pseudotemporal order, using local polynomial regression fitting method. Randomly down-sampling is performed in pEC and pAEC clusters for better visualization. e Heatmap showing the relative expression of the core TFs belonging to the regulons, genes in which exhibit significant overlap with the pattern genes. Cells are ordered by pseudotime and TFs are ordered by Patterns. f Heatmap showing smoothed (along adjacent 25 cells) and scaled enrichment scores of top 50 KEGG pathways along the order by pseudotime. Pathways are ordered by hierarchical clustering using ward.D method. g Scatter plots showing the relative activity levels of pathways or GO terms with loess smoothed fit curves and 95% confidence interval indicated. Relative activity levels are represented by the PC1 scores of expression levels of the genes in a given set. The sign or direction of PC1 is corrected according to positive correlation with averaged expression levels.

Comment in

References

    1. Dzierzak E, Bigas A. Blood development: hematopoietic stem cell dependence and independence. Cell Stem Cell. 2018;22:639–651. - PubMed
    1. Potente M, Makinen T. Vascular heterogeneity and specialization in development and disease. Nat. Rev. Mol. Cell Biol. 2017;18:477–494. - PubMed
    1. Swiers G, et al. Early dynamic fate changes in haemogenic endothelium characterized at the single-cell level. Nat. Commun. 2013;4:2924. - PMC - PubMed
    1. Chen MJ, et al. Erythroid/myeloid progenitors and hematopoietic stem cells originate from distinct populations of endothelial cells. Cell Stem Cell. 2011;9:541–552. - PMC - PubMed
    1. Taoudi S, et al. Progressive divergence of definitive haematopoietic stem cells from the endothelial compartment does not depend on contact with the foetal liver. Development. 2005;132:4179–4191. - PubMed

Publication types