. 2021 Jan;35(1):156-168.
doi: 10.1038/s41375-020-0794-0. Epub 2020 Mar 16.

Immunomodulatory effects of pevonedistat, a NEDD8-activating enzyme inhibitor, in chronic lymphocytic leukemia-derived T cells

Affiliations

Immunomodulatory effects of pevonedistat, a NEDD8-activating enzyme inhibitor, in chronic lymphocytic leukemia-derived T cells

Scott Best et al. Leukemia. 2021 Jan.

Abstract

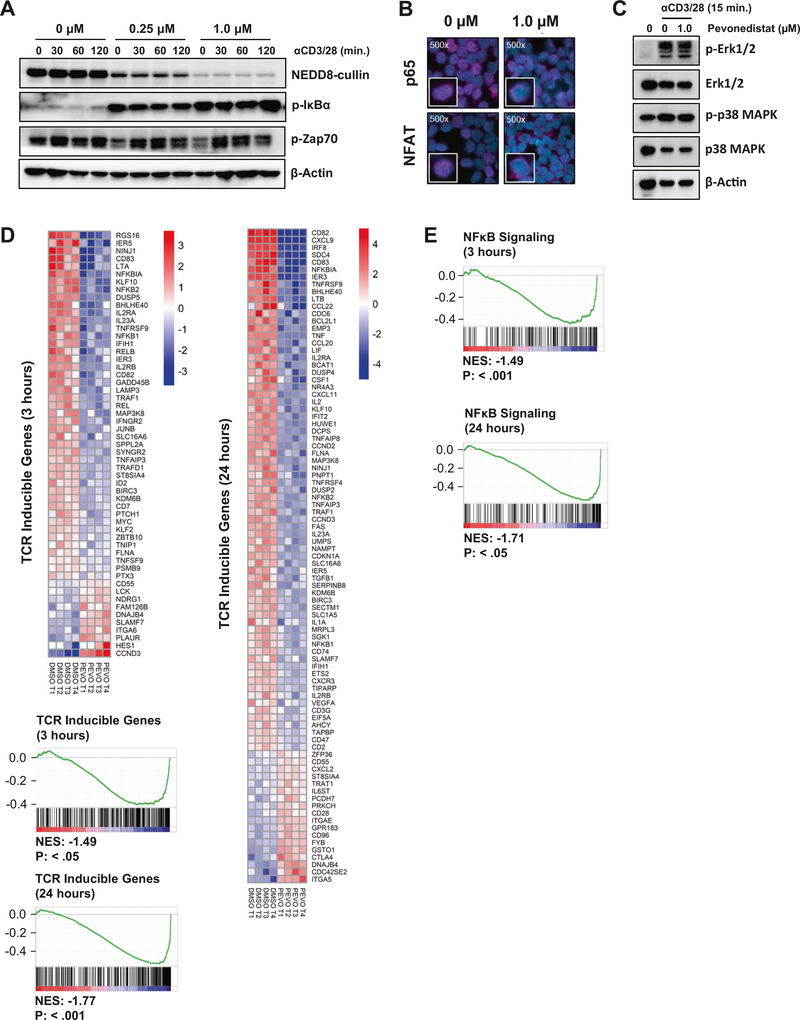
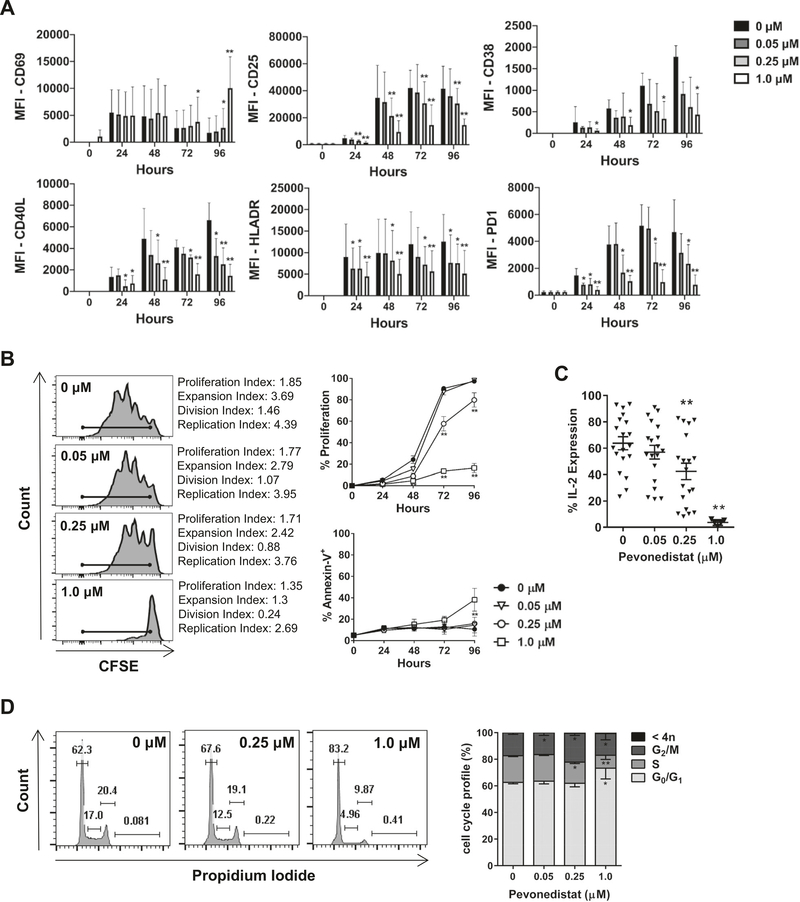
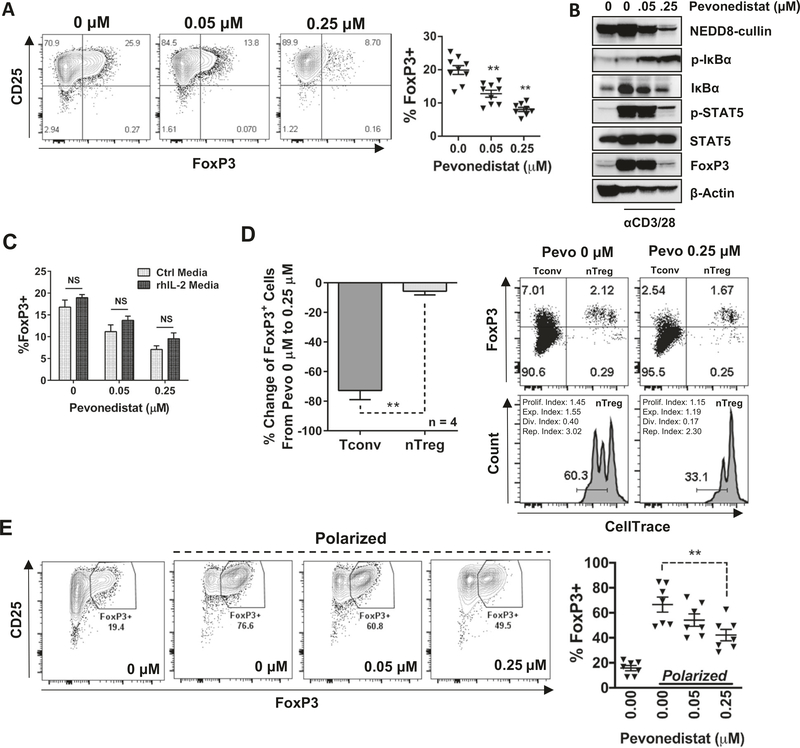
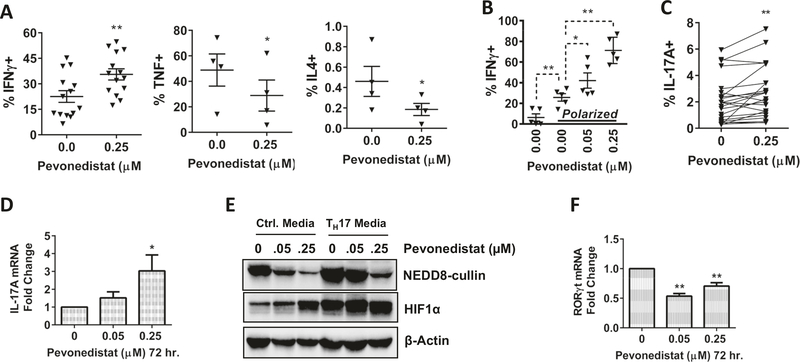
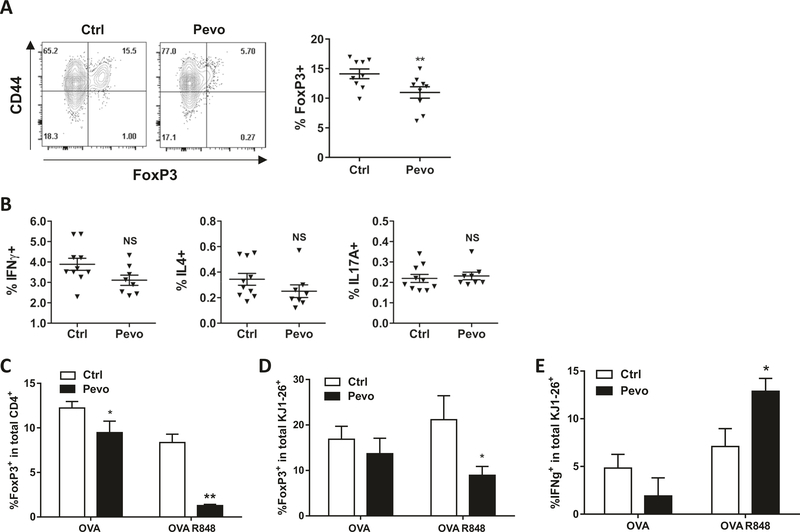
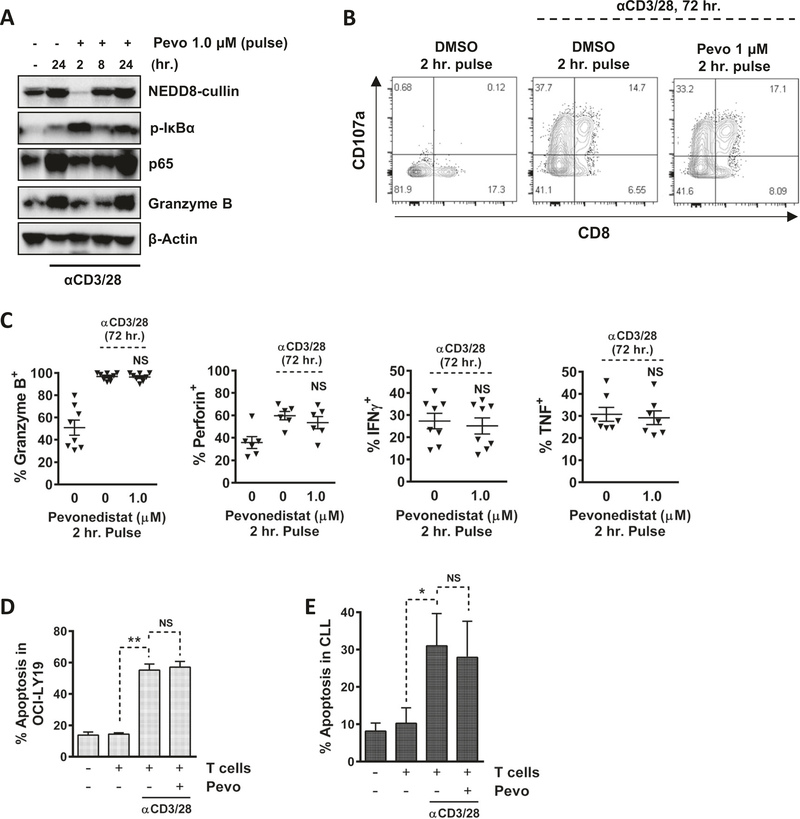
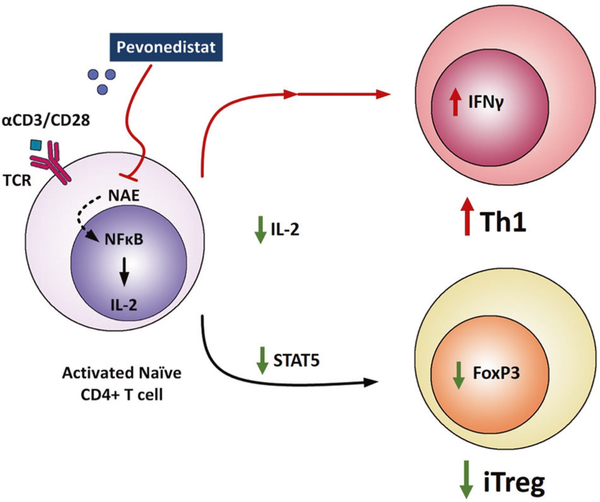
Novel targeted agents used in therapy of lymphoid malignancies, such as inhibitors of B-cell receptor-associated kinases, are recognized to have complex immune-mediated effects. NEDD8-activating enzyme (NAE) has been identified as a tractable target in chronic lymphocytic leukemia (CLL) and non-Hodgkin lymphoma. We and others have shown that pevonedistat (TAK-924), a small-molecule inhibitor of NAE, abrogates NF-κB signaling in malignant B cells. However, NF-κB pathway activity is indispensable in immune response, and T-cell function is altered in patients with CLL. Using T cells derived from patients with CLL, we demonstrate that although targeting NAE results in markedly differential expression of NF-κB-regulated genes and downregulation of interleukin (IL)-2 signaling during T-cell activation, T cells evade apoptosis. Meanwhile, NAE inhibition favorably modulates polarization of T cells in vitro, with decreased Treg differentiation and a shift toward TH1 phenotype, accompanied by increased interferon-γ production. These findings were recapitulated in vivo in immunocompetent mouse models. T cells exposed to pevonedistat in washout experiments, informed by its human pharmacokinetic profile, recover NAE activity, and maintain their response to T-cell receptor stimulation and cytotoxic potential. Our data shed light on the potential immune implications of targeting neddylation in CLL and lymphoid malignancies.


Figures

Fig. 1
Fig. 1. Targeting NAE attenuates TCR signaling.
a T cells from patients with CLL were treated with pevonedistat at the indicated doses for 1 h, followed by TCR stimulation with 0.5 μg/mL aCD3/28. Cells were subjected to immunoblotting at the indicated timepoints. b CD3+ T cells were treated with 1 μM pevonedistat for 1 h, followed by TCR stimulation for 24 h. Protein expression was analyzed by immunocytochemistry. c–e Naive CD4+CD45RA+CD45RO T cells from patients with CLL (four biological replicates) were preincubated with pevonedistat (1 μM) for 1 h and then subjected to TCR crosslinking. Cell lysate was harvested and subjected to immunoblotting (c). RNA was isolated after 3 (d) or 24h (e) and microarray analysis was performed as described in “Methods.” The heat maps represent a change in expression of the putative TCR target genes. Blue represents gene downregulation and red represents gene upregulation across the individual samples. GSEA demonstrate results for the hallmark TCR-inducible genes and NF-κB targets. NES normalized enrichment score.
Fig. 2
Fig. 2. Pevonedistat influences T-cell activation and proliferation.
Magnetically enriched CD3+ T cells were activated with 0.5 μg/mL αCD3/28 in the presence of pevonedistat or vehicle control. Cells were analyzed in the CD4+ gate. Data are mean ± standard error (SE). a, b Surface expression of activation markers, cell proliferation (following CFSE staining), and apoptosis (annexin V) were analyzed by flow cytometry at the indicated timepoints as noted in “Methods” (N = 6). A representative image of CFSE distribution after 72 h of TCR engagement is shown. Proliferation was defined as the proportion of cells that have undergone at least one mitotic division as shown by CFSE peak dilutions. Two-way ANOVA and Tukey’s multiple comparison test were performed for statistical analysis. *p < 0.05, **p < 0.01 vs. control within each timepoint. c Following 72 h TCR engagement (in the presence or not of pevonedistat), T cells were restimulated for 5 h with PMA/ionomycin with monensin and cytokine expression was analyzed by flow cytometry. d Following 72 h TCR engagement (in the presence or not of pevonedistat), T cells were subjected to cell cycle analysis as described in “Methods.” *p < 0.05, **p < 0.01 vs. control.
Fig. 3
Fig. 3. Pevonedistat prevents differentiation of iTregs.
Magnetically enriched CD3+ cells were activated with 0.5 μg/mL αCD3/28 for 24 h. Thereafter, stimulation continued in the presence of the indicated doses of pevonedistat or vehicle control for an additional 72 h. Data are mean ± standard error (SE). Student’s t test was performed for statistical analysis, *p < 0.05, **p < 0.01 vs. control. a FoxP3 expression was quantified in CD4+ T cells by flow cytometry. b Cells were collected after 72 h of drug exposure and whole-protein lysates were subjected to immunoblotting. c nTregs and Tconvs were separated by FACS. nTregs were then stained with CellTrace dye and remixed with Tconvs. After 72 h of TCR engagement, FoxP3 expression was quantified within both nTregs and Tconvs by flow cytometry. d Enriched CD3+ T cells were incubated with or without exogenous rh-IL-2 (20 ng/mL) for the entirety of activation and drug treatment. FoxP3 expression within CD4+ T cells was quantified by flow cytometry. e Sorted naive CD4+ T cells were subjected to Treg-polarizing conditions for 96 h, in the presence of the indicated concentrations of pevonedistat. FoxP3 expression was analyzed as previously.
Fig. 4
Fig. 4. Pevonedistat alters the polarization of CD4+ T cells.
Magnetically enriched CD3+ cells were activated with 0.5 μg/mL αCD3/28 for 24 h prior to exposure of pevonedistat. Cells resumed stimulation for 72 h in the presence of the drug. Data are mean ± standard error (SE). Student’s t test was performed for statistical analysis, *p < 0.05, **p < 0.01 vs. control. a CD3+ T cells were activated for 96 h. Thereafter, cells were restimulated with PMA/ionomycin in the presence of monensin for 5 h. Cytokine expression within CD4+ T cells was quantified by flow cytometry. b Sorted naive CD4+ T cells were incubated in TH1-polarizing conditions for 96 h, IFNγ cytokine expression was measured following the procedures described above. c–f CD3+ T cells were TCR-stimulated in the presence of pevonedistat for 10 days. IL-17A cytokine expression within CD4+ T cells was quantified as previously described above (c). Cells were harvested and mRNA expression was quantified by q-RT-PCR (d, f) or total lysate and subjected to immunoblotting (e).
Fig. 5
Fig. 5. Pevonedistat modulates T-cell polarization in vivo.
a, b BALB/cJ mice were treated with pevonedistat (60 mg/kg) or vehicle control for 24 days (ten animals per condition). c, d Mice were immunized with ovalbumin and subjected to treatment with pevonedistat for 10 days as described in “Methods” At the end of each experiment, splenocytes were analyzed for FoxP3 expression (a, c, d) or re-activated with PMA/ionomycin with monensin to analyze cytokine expression (b, e). Cells were gated in the total CD4+ lymphocytesor CD4+KJ1–26+ (transplanted) lymphocytes as indicated. Two independent experiments were conducted, total of nine animals per condition. *p < 0.05, **p < 0.01 vs. control.
Fig. 6
Fig. 6. Pulse-exposure mimicking pevonedistat pharmacokinetics.
Magnetically enriched CD3+ T cells were pretreated with 1.0 μM pevonedistat for 2 h (pulse treatment). Drug was washed out and cells were crosslinked with 0.5 μg/mL αCD3/28. Data are mean ± standard error (SE). Student’s t test was performed for statistical analysis, *p < 0.05, **p < 0.01 vs. control. a Cells were harvested at the indicated timepoints and whole-protein lysates were subjected to immunoblotting. b Following pevonedistat pulse treatment (1.0 μM, 2 h) and then TCR stimulation (72 h), cells were stained with CD107a antibody for 1 h, followed by the addition of brefeldin A for 4 h. CD107A expression was analyzed by flow cytometry within the CD8+ T-cell population. c Following pevonedistat pulse treatment (1.0 μM, 2 h) and then TCR stimulation (72 h), cells were incubated with brefeldin A for 4 h. Cells were then harvested and analyzed by flow cytometry. Cytokine expression was measured within CD8+ population. d CD3+ T cells were pretreated with pevonedistat for 2 h and subjected to TCR stimulation for additional 24 h. T cells were incubated with allogeneic CFSE-stained OCI-LY19 cells at a 20:1 ratio for additional 48 h. OCI-LY19 cells were analyzed for apoptosis (annexin V). e Following isolation from blood, CD3+ T cells were subjected to drug treatment and CD3/28 crosslinking as above, while CLL cells were stimulated with CD40L-conditioned media for 24 h. Cells were then mixed at a 20:1 T-cell:CLL ratio for additional 48 h (without drug). Apoptosis was determined within the CD19+ population by flow cytometry (annexin V).
Fig. 7
Fig. 7. Targeting NAE modulates T-cell subpopulations.
Pevonedistat inhibits NEDD8-activating enzyme (NAE) in T cells derived from patients with CLL, resulting in altered NF-κB-regulated gene expression and downregulation of interleukin (IL)-2 signaling during T-cell activation. Furthermore, NAE inhibition in CD4+ T cells resulted in reduced differentiation of inducible regulatory T-cells (iTregs) and polarization towards the Th1 phenotype.

References

    1. Kittai AS, Lunning M, Danilov AV. Relevance of prognostic factors in the era of targeted therapies in CLL. Curr Hematol Malig Rep. 2019;14:302–9. - PubMed
    1. Shindiapina P, Brown JR, Danilov AV. A new hope: novel therapeutic approaches to treatment of chronic lymphocytic leukaemia with defects in TP53. Br J Haematol. 2014;167:149–61. - PubMed
    1. Long M, Beckwith K, Do P, Mundy BL, Gordon A, Lehman AM, et al. Ibrutinib treatment improves T cell number and function in CLL patients. J Clin Investig. 2017;127:3052–64. - PMC - PubMed
    1. Dubovsky JA, Beckwith KA, Natarajan G, Woyach JA, Jaglowski S, Zhong Y, et al. Ibrutinib is an irreversible molecular inhibitor of ITK driving a Th1-selective pressure in T lymphocytes. Blood. 2013;122:2539–49. - PMC - PubMed
    1. Lampson BL, Kasar SN, Matos TR, Morgan EA, Rassenti L, Davids MS, et al. Idelalisib given front-line for treatment of chronic lymphocytic leukemia causes frequent immune-mediated hepatotoxicity. Blood. 2016;128:195–203. - PMC - PubMed

Publication types

MeSH terms