. 2021 Jun;26(6):2316-2333.
doi: 10.1038/s41380-020-0692-x. Epub 2020 Mar 16.

Programmed cell death 4 as an endogenous suppressor of BDNF translation is involved in stress-induced depression

Affiliations

Programmed cell death 4 as an endogenous suppressor of BDNF translation is involved in stress-induced depression

Yuan Li et al. Mol Psychiatry. 2021 Jun.

Abstract

Brain-derived neurotrophic factor (BDNF) is a growth factor that plays vital roles in the neuron survival, growth, and neuroplasticity. Alteration to BDNF expression is associated with major depressive disorder. However, the BDNF translational machinery in depression remains unknown. Herein, we pointed that Pdcd4, a suppressor oncogene, acted as an endogenous inhibitor for the translation of BDNF, and selectively repressed the translation of BDNF splice variant IIc mRNA in an eIF4A-dependent manner. Chronic restraint stress (CRS) up-regulated Pdcd4 expression in hippocampus via decreasing mTORC1-mediated proteasomes degradation pathway, which resulted in the reduction of BDNF protein expression. Moreover, over-expression of Pdcd4 in the hippocampus triggered spontaneous depression-like behaviors under the non-stressed conditions in mice, while systemic or neuron-specific knockout of Pdcd4 reverses CRS-induced depression-like behaviors. Importantly, administration of Pdcd4 siRNA or an interfering peptide that interrupts the Pdcd4-eIF4A complex substantially promoted BDNF expression and rescued the behavioral disorders which were caused by CRS. Overall, we have discovered a previously unrecognized role of Pdcd4 in controlling BDNF mRNA translation, and provided a new method that boosting BDNF expression through blocking the function of Pdcd4 in depression, indicating that Pdcd4 might be a new potential target for depressive disorder therapy.


Conflict of interest statement

The authors declare that they have no conflict of interest.

Figures
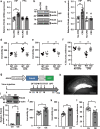
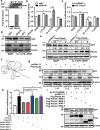
Fig. 1
Fig. 1. Deletion of Pdcd4 prevents CRS-induced depression-like behaviors in mice.
a The change of mRNA levels of Pdcd4 in the hippocampal (HIP) and prefrontal cortex (PFC) after CRS. No-CRS n = 7–8, CRS n = 7–8; unpaired two-tailed Student’s t test, **P < 0.01. b, c The change of protein levels of Pdcd4 in the HIP and PFC after CRS. For HIP No-CRS n = 6, CRS n = 8, for PFC No-CRS n = 4, CRS n = 4; unpaired two-tailed Student’s t test, **P < 0.01. d Immobility time in TST, e immobility time in FST, and f sucrose consumption in SPT under basal or stress condition. n = 8 per group; mean ± SEM, two-way ANOVA and Sidak’s multiple comparison test, **P < 0.01. g Top, schematic of construct displaying mouse Pdcd4 subcloned into an AAV9 plasmid under transcriptional regulation of the CMV promoter (AAV9-CMV-mPdcd4-P2A-GFP); AAV9-CMV-P2A-GFP served as the control. Bottom, the schematic of the experiment. h Representative photomicrographs of injection sites in the hippocampus. n = 4 per group, Scale bars, 100 µm. i Fold change of Pdcd4 protein from hippocampus microdissections from control (n = 4) or AAV-Pdcd4–injected (n = 3) mice, unpaired two-tailed Student’s t test. j Mean immobility time (±SEM) for control (n = 8) and OE-Pdcd4 (n = 9) animals in the tail suspension test, unpaired two-tailed Student’s t test. k Mean immobility time (±SEM) for control (n = 8) and OE-Pdcd4 (n = 9) animals in the force swimming test, unpaired two-tailed Student’s t test. l Mean sucrose preference (±SEM) for control (n = 8) and OE-Pdcd4 (n = 9) animals, unpaired two-tailed Student’s t test. *P < 0.05 and **P < 0.01.
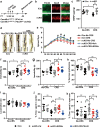
Fig. 2
Fig. 2. Pdcd4 mediates CRS-induced synaptic plasticity impairment in hippocampus through blocking mTORC1-regulated BDNF signaling.
a Representative photomicrographs of dendritic spines from DG granular cells, scale bar, 10 μm. b Spine density in dendrites of DG granular cells in Pdcd4 KO and WT mice. n = 4 per group; mean ± SEM, two-way ANOVA and Sidak’s multiple comparison test, *P < 0.05, **P < 0.01 vs. the No-CRS group; #P < 0.05, ##P < 0.01 vs. the CRS-WT group. c Representative images of high-magnification z-stack projections of segments of the DG dendrites (scale bar, 5 µm). Mean ± SEM of spine density from control (n = 36 from four mice), OE-Pdcd4 (n = 46 from four mice). *P < 0.05 relative to control mice (unpaired two-tailed Student’s t test). d Mice hippocampus BDNF was detected by ELISA. n = 6–7 per group, Rapamycin (Rapa), mean ± SEM, unpaired two-tailed Student’s t test, *P < 0.05. e Representative photomicrographs of dendritic spines from DG granular cells, scale bar, 10 μm. f Spine density in dendrites of DG granular cells. n = 4 per group; mean ± SEM, unpaired two-tailed Student’s t test, *P < 0.05. g Quantitative RT-PCR analysis of BDNF mRNA expression in the hippocampus in Pdcd4 KO and WT mice. n = 6–7 per group; mean ± SEM, two-way ANOVA (WT vs. KO, F1,22 = 10.97, P < 0.01; No-CRS vs. CRS, F1,22 = 11.67, P < 0.01; interaction, F1,22 = 0.846, P = 0.3676) and Sidak’s multiple comparison test, *P < 0.05. h Quantitative ELISA analysis of pan-BDNF protein expression in the hippocampus in Pdcd4 KO and WT mice. n = 6 per group; mean ± SEM, two-way ANOVA (WT vs. KO F1,20 = 6.141, P < 0.05; No-CRS vs. CRS, F1,20 = 6.906, P < 0.05; interaction, F1,20 = 2.816, P = 0.1089) and Sidak’s multiple comparison test, *P < 0.05. i Quantitative ELISA analysis of pan-BDNF protein expression in the hippocampus in OE-Pdcd4 and Control mice. n = 6 per group; mean ± SEM, unpaired two-tailed Student’s t test, *P < 0.05 vs. the control group.
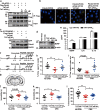
Fig. 3
Fig. 3. Pdcd4 selectively represses the translation of BDNF splice variant IIc mRNA in an eIF4A-dependent manner.
a Mice hippocampal lysates were subjected to RNA-IP with Pdcd4 antibodies or IgG. Purified RNA was analyzed by RT- PCR using specific primer for BDNF. b Luciferase assays were performed after transfecting each pGL3 construct into HEK 293 cells transfected with either siNC or siPdcd4. Renilla luciferase vector was co-transfected for normalization. Three independent experiments are shown, mean ± SEM, unpaired two-tailed Student’s t test, *P < 0.05. c Luciferase assays were performed after transfecting each pGL3 construct into HEK 293 cells transfected with either pcDNA3.1 or Flag-Pdcd4. Renilla luciferase vector was co-transfected for normalization. Three independent experiments are shown, mean ± SEM, unpaired two-tailed Student’s t test, *P < 0.05. d GFP antibody detected BDNF expression after transfecting each BDNF-GFP construct into HEK 293 cells with either siNC or siPdcd4. e GFP antibody detected BDNF expression after transfecting different dose Pdcd4 plasmid with each BDNF-GFP construction. f Human IIc-isoform BDNF 5’ UTR secondary structure was predicted in the website: http://rna.tbi.univie.ac.at/, and based on principle of the minimum free energy and base pair probabilities from single RNA sequences. g Western blot was performed after transfecting each IIc-5’UTR mutation of BDNF-GFP construct into HEK 293 cells transfected with either pcDNA3.1 or Flag-Pdcd4. h Luciferase assays were performed after transfecting both pGL3-BDNF variant IIc-5’UTR and siPdcd4 constructions into HEK 293 cells transfected with Pdcd4 mutations. Renilla luciferase vector was co-transfected for normalization. Three independent experiments are shown, mean ± SEM, unpaired two-tailed Student’s t test. *P < 0.05. i IIc-5’UTR-BDNF-GFP construction with Pdcd4 mutations were transfected into HEK 293 cells, and GFP antibody detected BDNF expression.
Fig. 4
Fig. 4. Pharmacological inhibition of the BDNF-TrkB signaling pathway induces depression and anxiety-like behaviors in neuron-specific Pdcd4 knockout mice.
a Time course of tamoxifen/CRS administration and behavior tests. b Coronal sections of dentate gyrus (DG) from control or neuron-depleted mice stained for Pdcd4 after tamoxifen administration in iCre mice or ncKO mice scale bars, 50 µm. c Quantitative ELISA analysis of pan-BDNF protein expression in the hippocampus in No-CRS and CRS at iCre mice or ncKO mice. n = 5–6 per group; mean ± SEM, two-way ANOVA (iCre vs. ncKO, F1,18 = 10.09, P < 0.01; No-CRS vs. CRS, F1,18 = 2.048, P = 0.1696; interaction, F1,18 = 5.433, P < 0.05) and Sidak’s multiple comparison test, *P < 0.05, **P < 0.01. d Representative photomicrographs of dendritic spines from DG neurons, Scale bar, 10 μm. e Spine density in dendrites of DG neurons in Pdcd4 cKO and Cre mice. n = 4 per group; mean ± SEM, two-way ANOVA, *P < 0.05, **P < 0.01 vs. the No-CRS group; #P < 0.05, ##P < 0.01 vs. the CRS-cKO group. f Immobility time in TST, mean ± SEM, two-way ANOVA (iCre vs. ncKO, F1,45 = 0.2672, P = 0.6078; No-CRS vs. CRS, F1,45 = 0.1892, P = 0.6656; interaction, F1,45 = 8.49, P < 0.01) and Sidak’s multiple comparison test, *P < 0.05, **P < 0.01. Under stress condition, one-way ANOVA (F3,40 = 3.931, P < 0.01) and Tukey’s multiple comparison test, *P < 0.05, **P < 0.01. g Immobility time in FST, mean ± SEM, two-way ANOVA (iCre vs. ncKO, F1,45 = 2.533, P = 0.1185; No-CRS vs. CRS, F1,45 = 5.604, P < 0.05; interaction, F1,45 = 16.13, P < 0.01) and Sidak’s multiple comparison test, *P < 0.05, **P < 0.01. Under stress condition, one-way ANOVA (F3,40 = 6.553, P < 0.01) and Tukey’s multiple comparison test, *P < 0.05, **P < 0.01. h Sucrose consumption in SPT. Mean ± SEM, two-way ANOVA (iCre vs. ncKO, F1,45 = 5.085, P < 0.05; No-CRS vs. CRS, F1,45 = 17.32, P < 0.01; interaction, F1,45 = 20.25, P < 0.01) and Sidak’s multiple comparison test, *P < 0.05, **P < 0.01. Under stress condition, one-way ANOVA (F3,40 = 9.42, P < 0.01) and Tukey’s multiple comparison test, *P < 0.05, **P < 0.01. i, j Locomotion and time spent in center in the open field test. Mean ± SEM, two-way ANOVA (iCre vs. ncKO, F1,45 = 0.6502, P = 0.4244; No-CRS vs. CRS, F1,45 = 17.32, P < 0.01; interaction, F1,45 = 14.23, P < 0.01) and Sidak’s multiple comparison test, *P < 0.05, **P < 0.01. Under stress condition, one-way ANOVA (F3,40 = 17.29, P < 0.01) and Tukey’s multiple comparison test, *P < 0.05, **P < 0.01. k Time spent in open arm in the elevated plus maze. Mean ± SEM, two-way ANOVA (iCre vs. ncKO, F1,45 = 1.914, P = 0.1734; No-CRS vs. CRS, F1,45 = 2.057, P = 0.1584; interaction, F1,45 = 11.3, P < 0.01) and Sidak’s multiple comparison test, *P < 0.05, **P < 0.01. Under stress condition, one-way ANOVA (F3,40 = 9.218, P < 0.01) and Tukey’s multiple comparison test, *P < 0.05, **P < 0.01.
Fig. 5
Fig. 5. Pdcd4-targeting peptide treatment promotes BDNF expression and has antidepressant response.
a HEK293 cells were co-transfected with Flag-Pdcd4, HA-eIF4A and peptide. Immunoprecipitation was performed with the anti-Flag antibody. Immunoblotting was performed with anti-Flag or anti-HA antibodies. The figure represents three independent experiments that yield similar result. b HEK293 cells were transfected with BiFC plasmids. Pictures showed DAPI staining (Blue) and Venus (Yellow). Scale bar, 10 μm. c GFP antibody detected BDNF expression after transfecting each IIc-5’UTR-BDNF-GFP construct into HEK 293 cells with either TAT-NC or TAT-eIF4AVI. d The level of BDNF expression in neurons after TAT-NC or TAT-eIF4AVI administration 24 h. e ELISA detected the expression of BDNF, IL-10 and IL-6 in neurons’ medium (n = 3; **P < 0.01 compared with the TAT-eIF4AVI group). f Time course of peptide injection/CRS administration and behavior tests. g Representative photomicrographs of injection sites in the hippocampus. h Time spent in center in the open field test. n = 8–10 per group; mean ± SEM, unpaired two-tailed Student’s t test. i Time spent in open arm in the elevated plus maze. n = 8–10 per group; mean ± SEM, unpaired two-tailed Student’s t test. j Immobility time in TST, k Immobility time in FST. n = 9–11 per group; mean ± SEM, unpaired two-tailed Student’s t test, *P < 0.05 and **P < 0.01. l Sucrose consumption in SPT. n = 18 per group; mean ± SEM, unpaired two-tailed Student’s t test, *P < 0.05 and **P < 0.01.

Similar articles

Cited by

References

    1. Whiteford HA, Degenhardt L, Rehm J, Baxter AJ, Ferrari AJ, Erskine HE, et al. Global burden of disease attributable to mental and substance use disorders: findings from the Global Burden of Disease Study 2010. Lancet. 2013;382:1575–86. doi: 10.1016/S0140-6736(13)61611-6. - DOI - PubMed
    1. Cipriani A, Furukawa TA, Salanti G, Geddes JR, Higgins JP, Churchill R, et al. Comparative efficacy and acceptability of 12 new-generation antidepressants: a multiple-treatments meta-analysis. Lancet. 2009;373:746–58. doi: 10.1016/S0140-6736(09)60046-5. - DOI - PubMed
    1. Otte C, Gold SM, Penninx BW, Pariante CM, Etkin A, Fava M, et al. Major depressive disorder. Nat Rev Dis Prim. 2016;2:16065. doi: 10.1038/nrdp.2016.65. - DOI - PubMed
    1. Duman RS, Aghajanian GK, Sanacora G, Krystal JH. Synaptic plasticity and depression: new insights from stress and rapid-acting antidepressants. Nat Med. 2016;22:238–49. doi: 10.1038/nm.4050. - DOI - PMC - PubMed
    1. MacQueen GM, Yucel K, Taylor VH, Macdonald K, Joffe R. Posterior hippocampal volumes are associated with remission rates in patients with major depressive disorder. Biol Psychiatry. 2008;64:880–3. doi: 10.1016/j.biopsych.2008.06.027. - DOI - PubMed

Publication types

Substances