. 2020 May;5(5):679-687.
doi: 10.1038/s41564-020-0691-3. Epub 2020 Mar 23.

Bacterial alginate regulators and phage homologs repress CRISPR-Cas immunity

Affiliations

Bacterial alginate regulators and phage homologs repress CRISPR-Cas immunity

Adair L Borges et al. Nat Microbiol. 2020 May.

Abstract

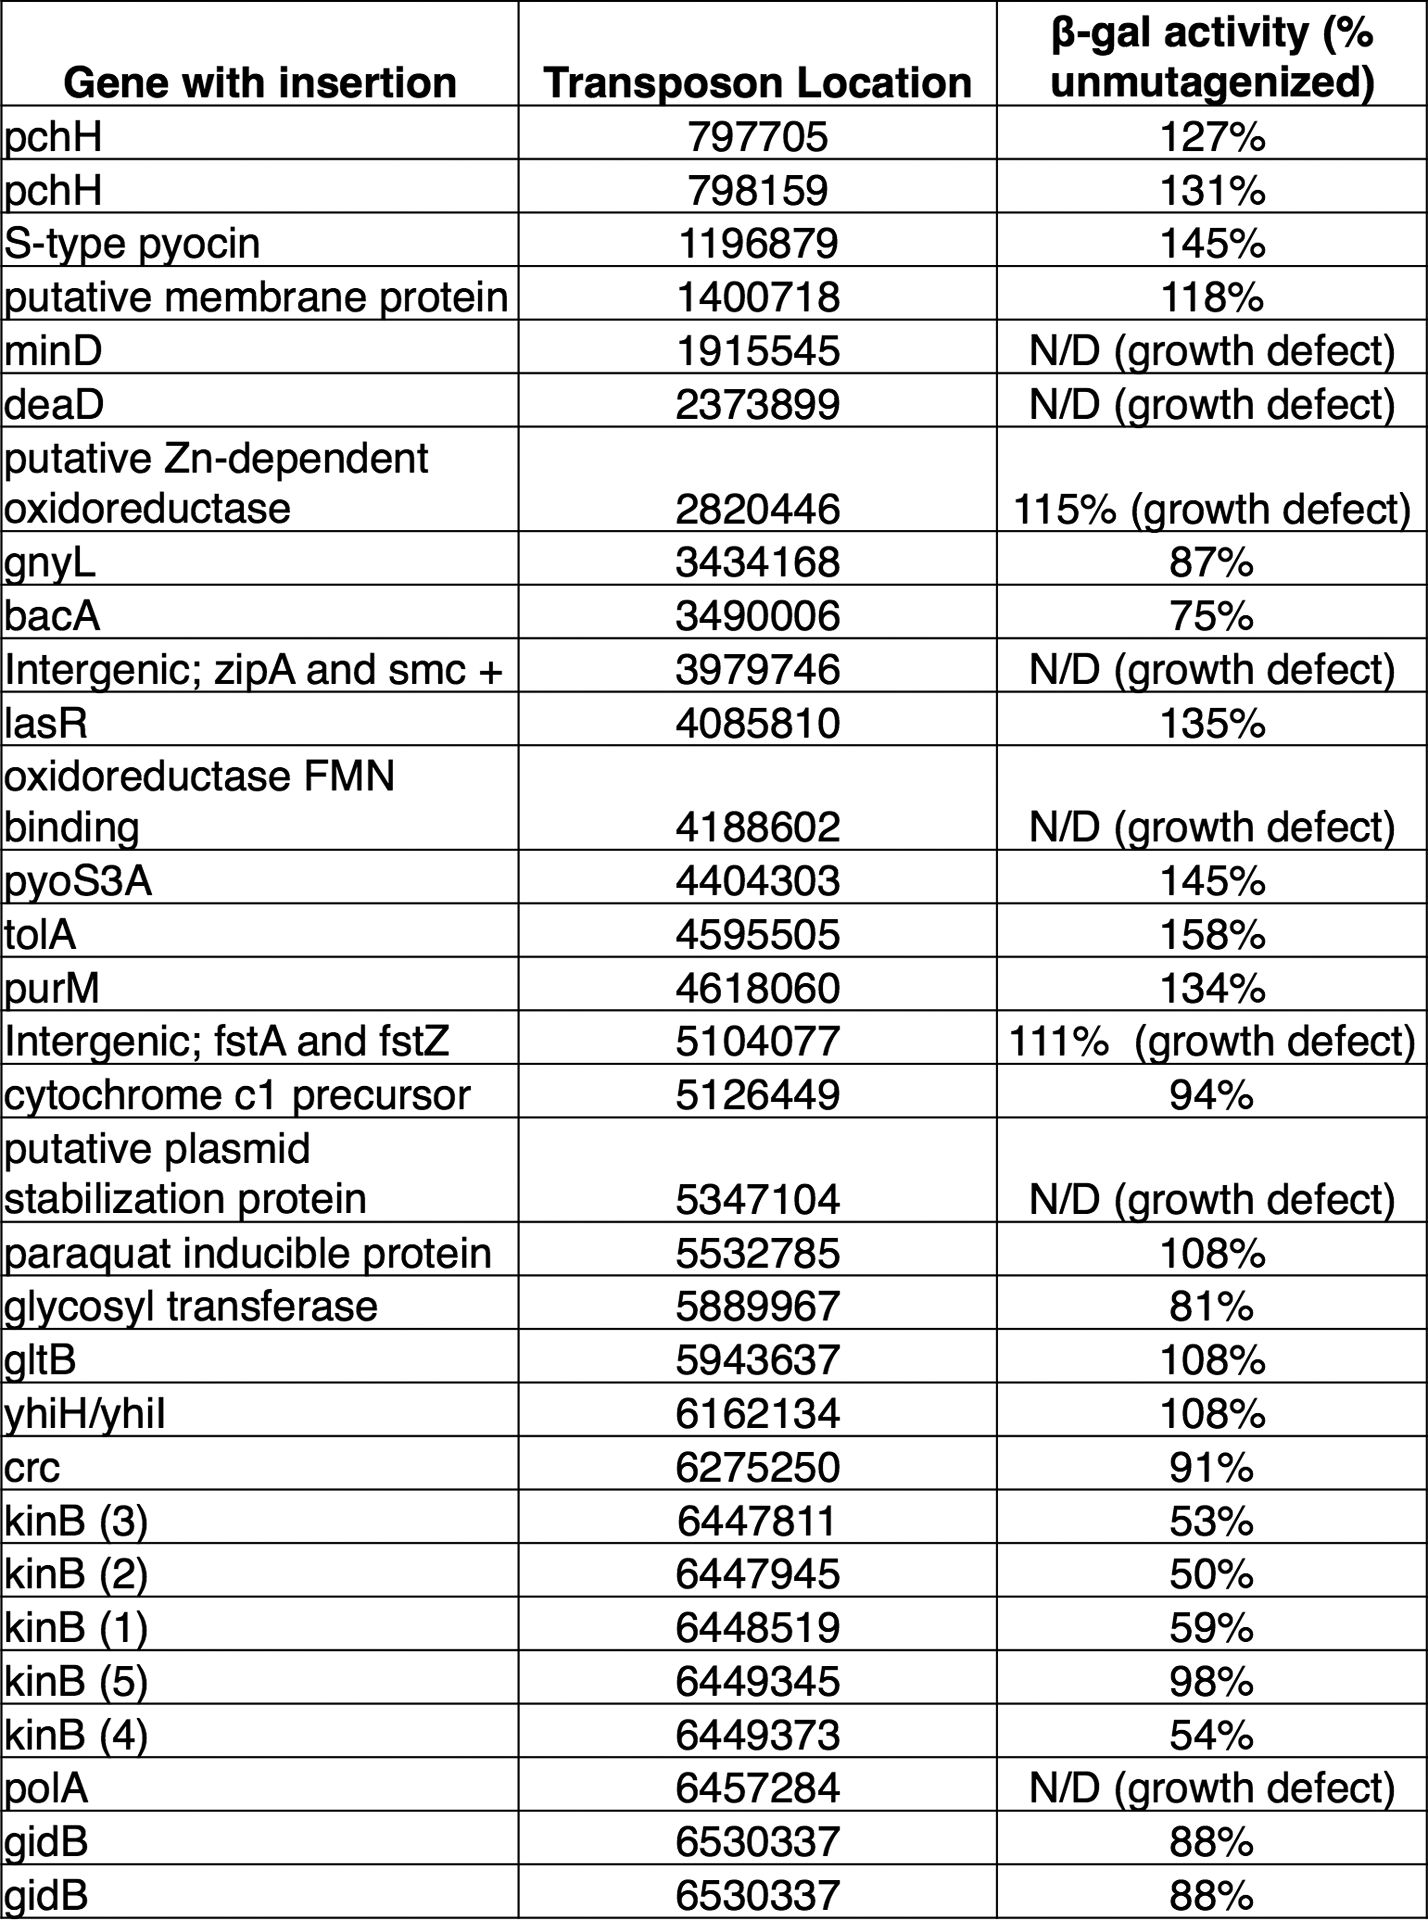
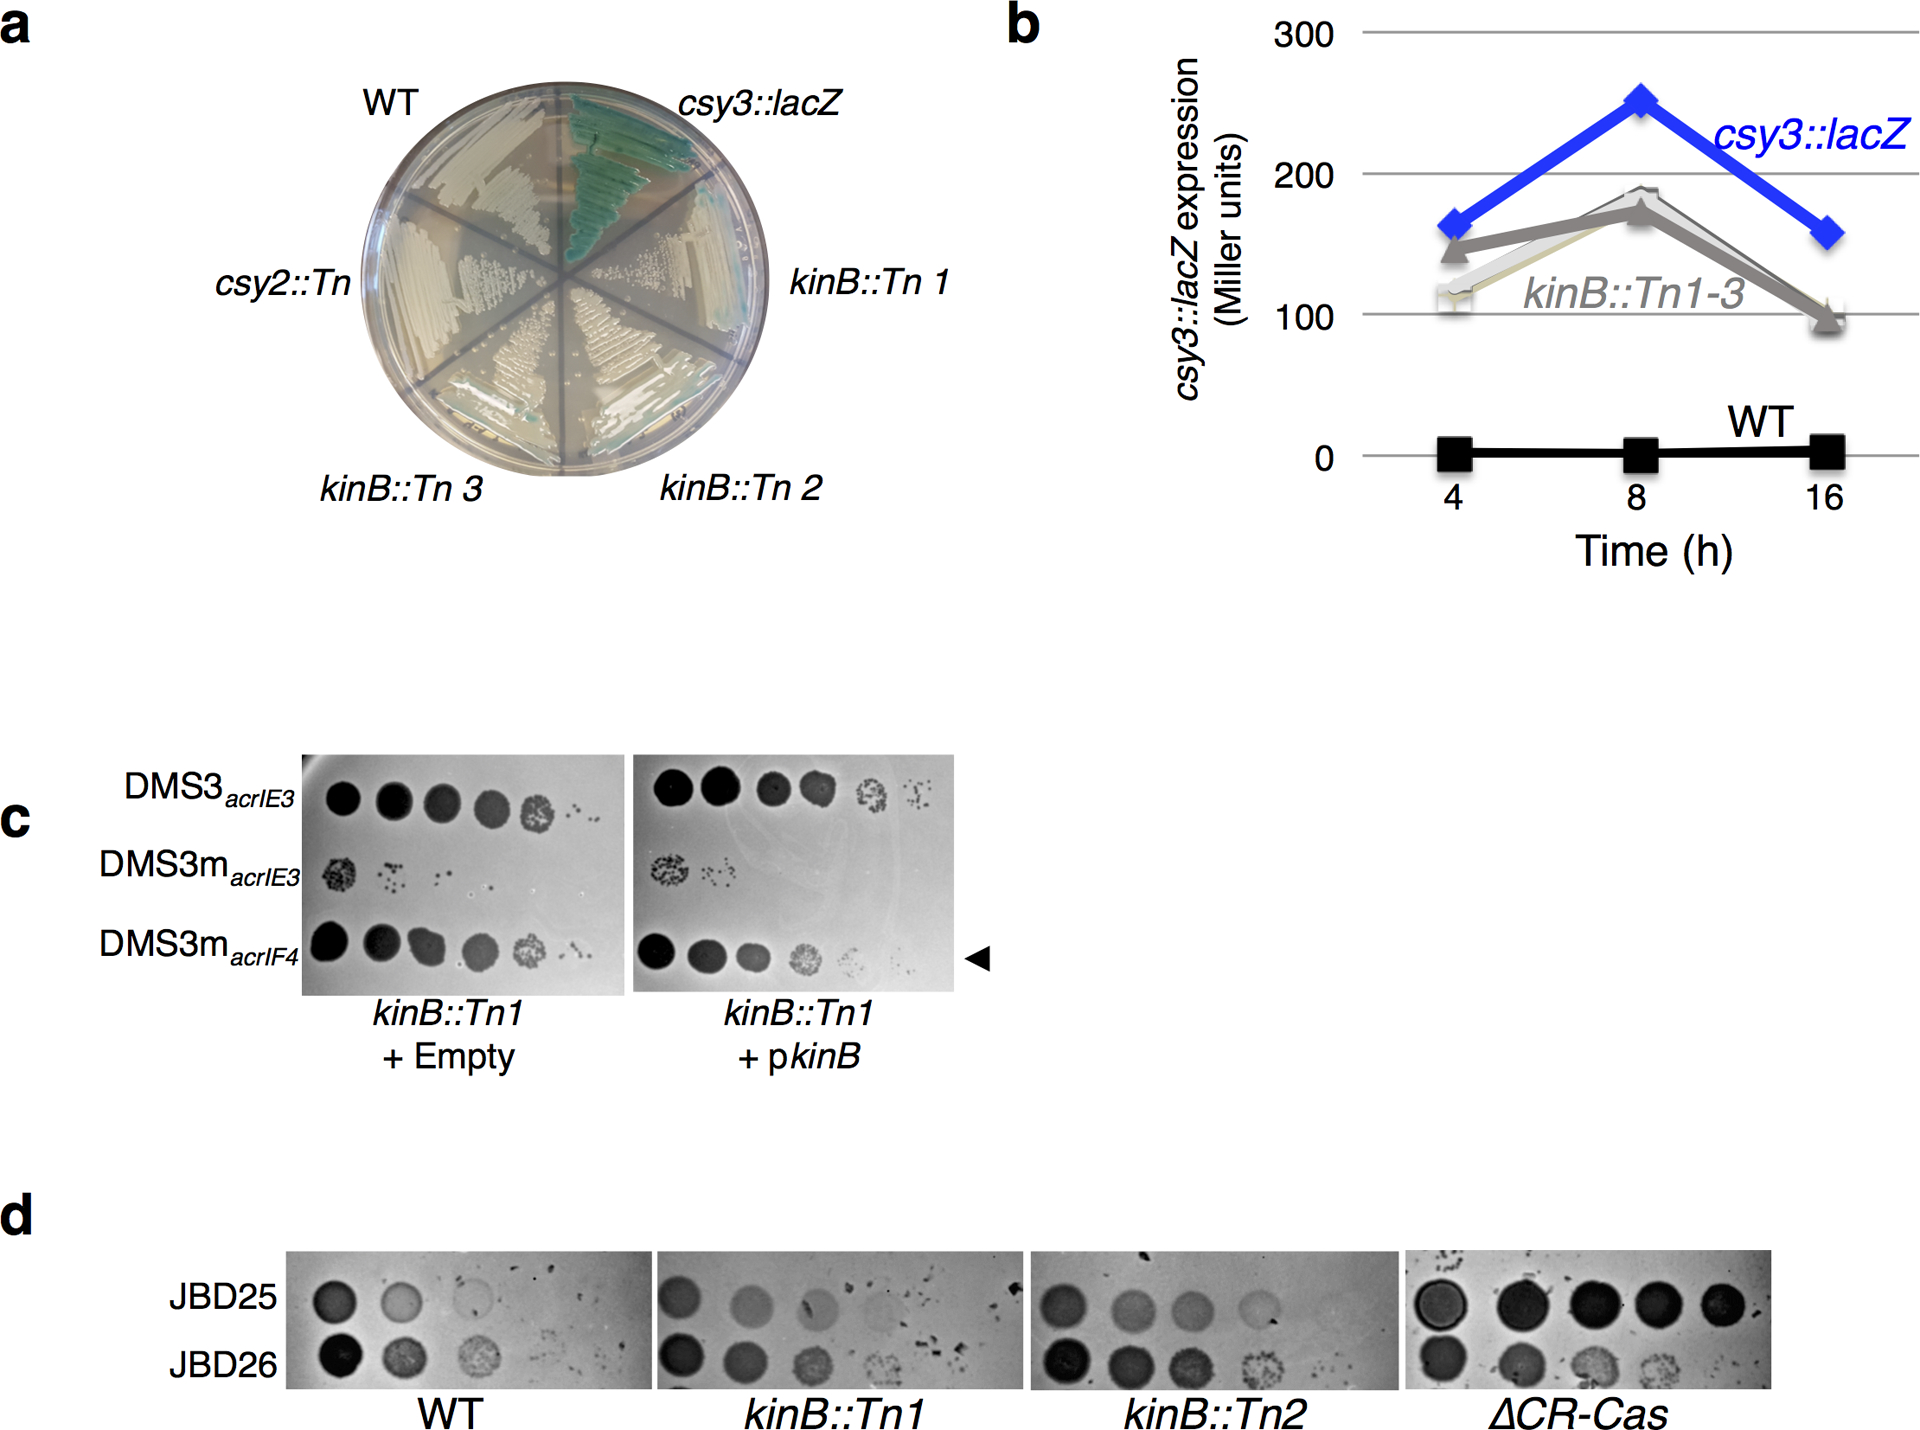
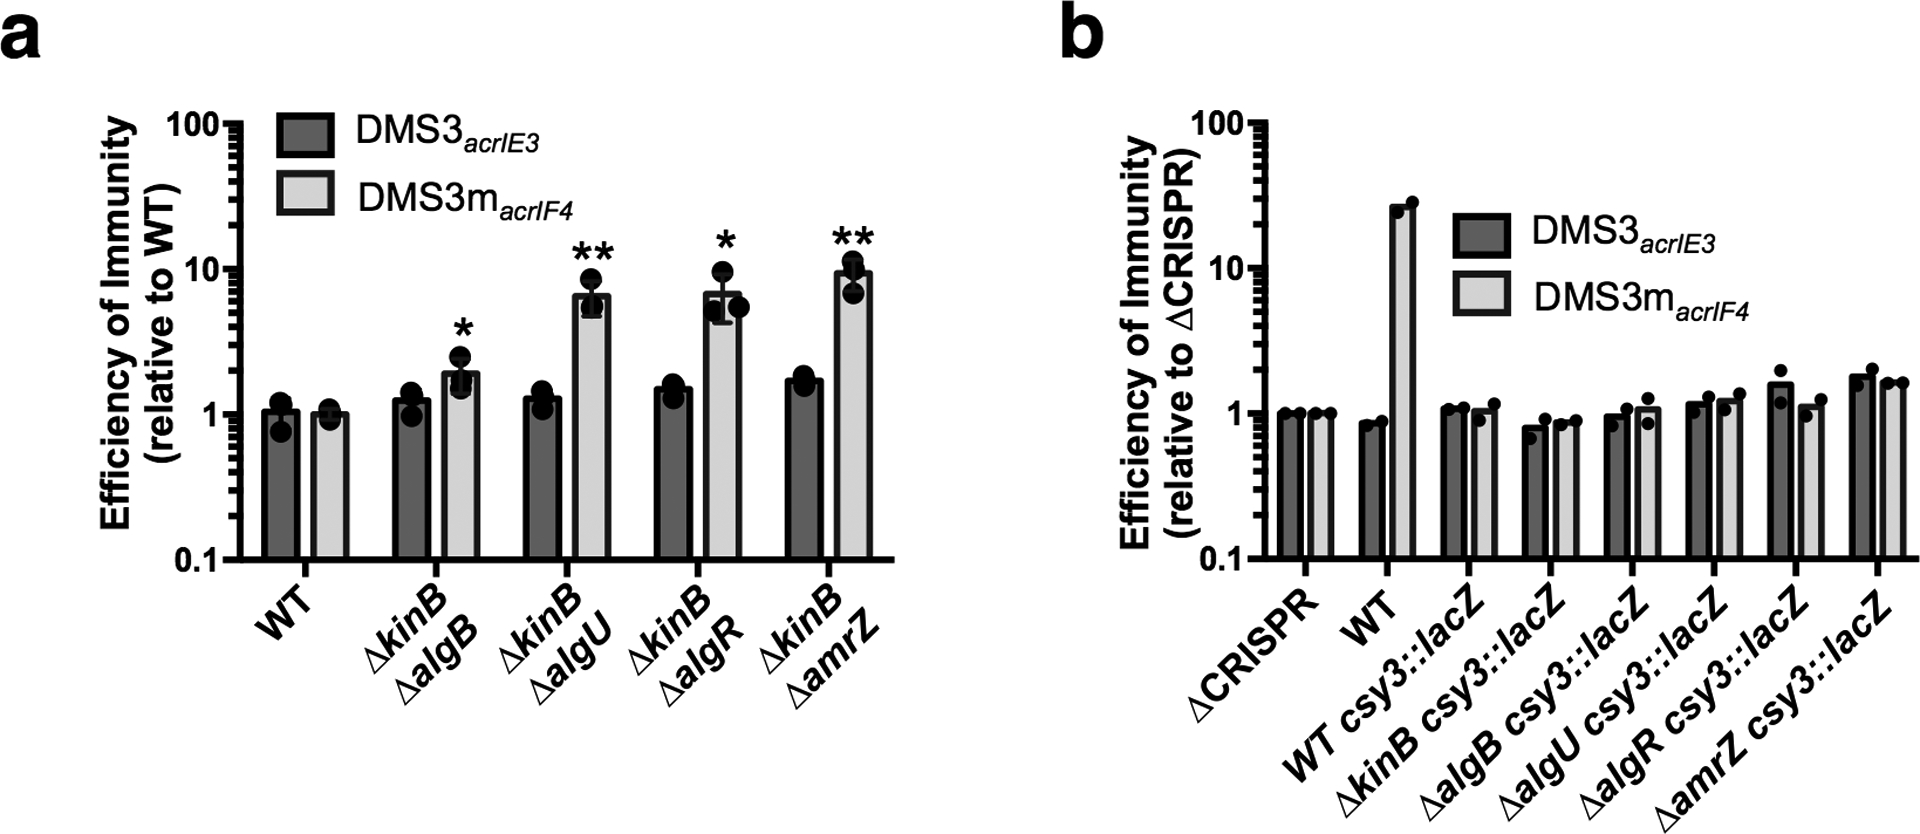
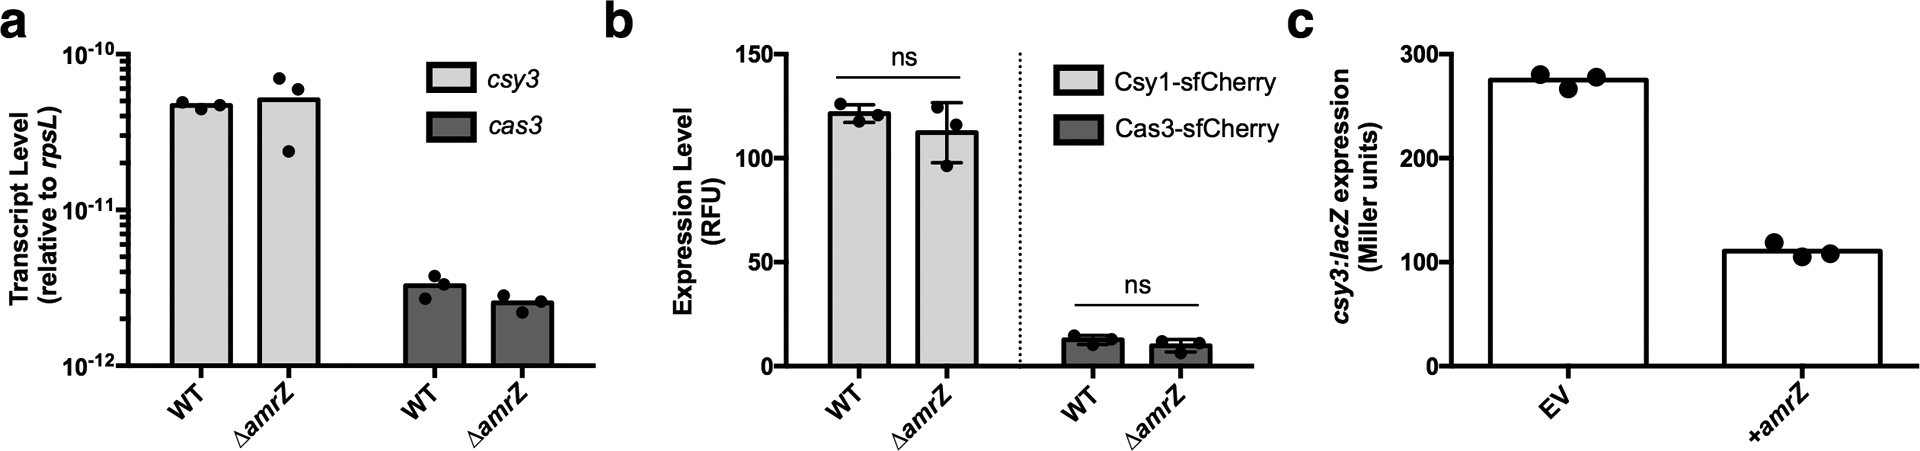
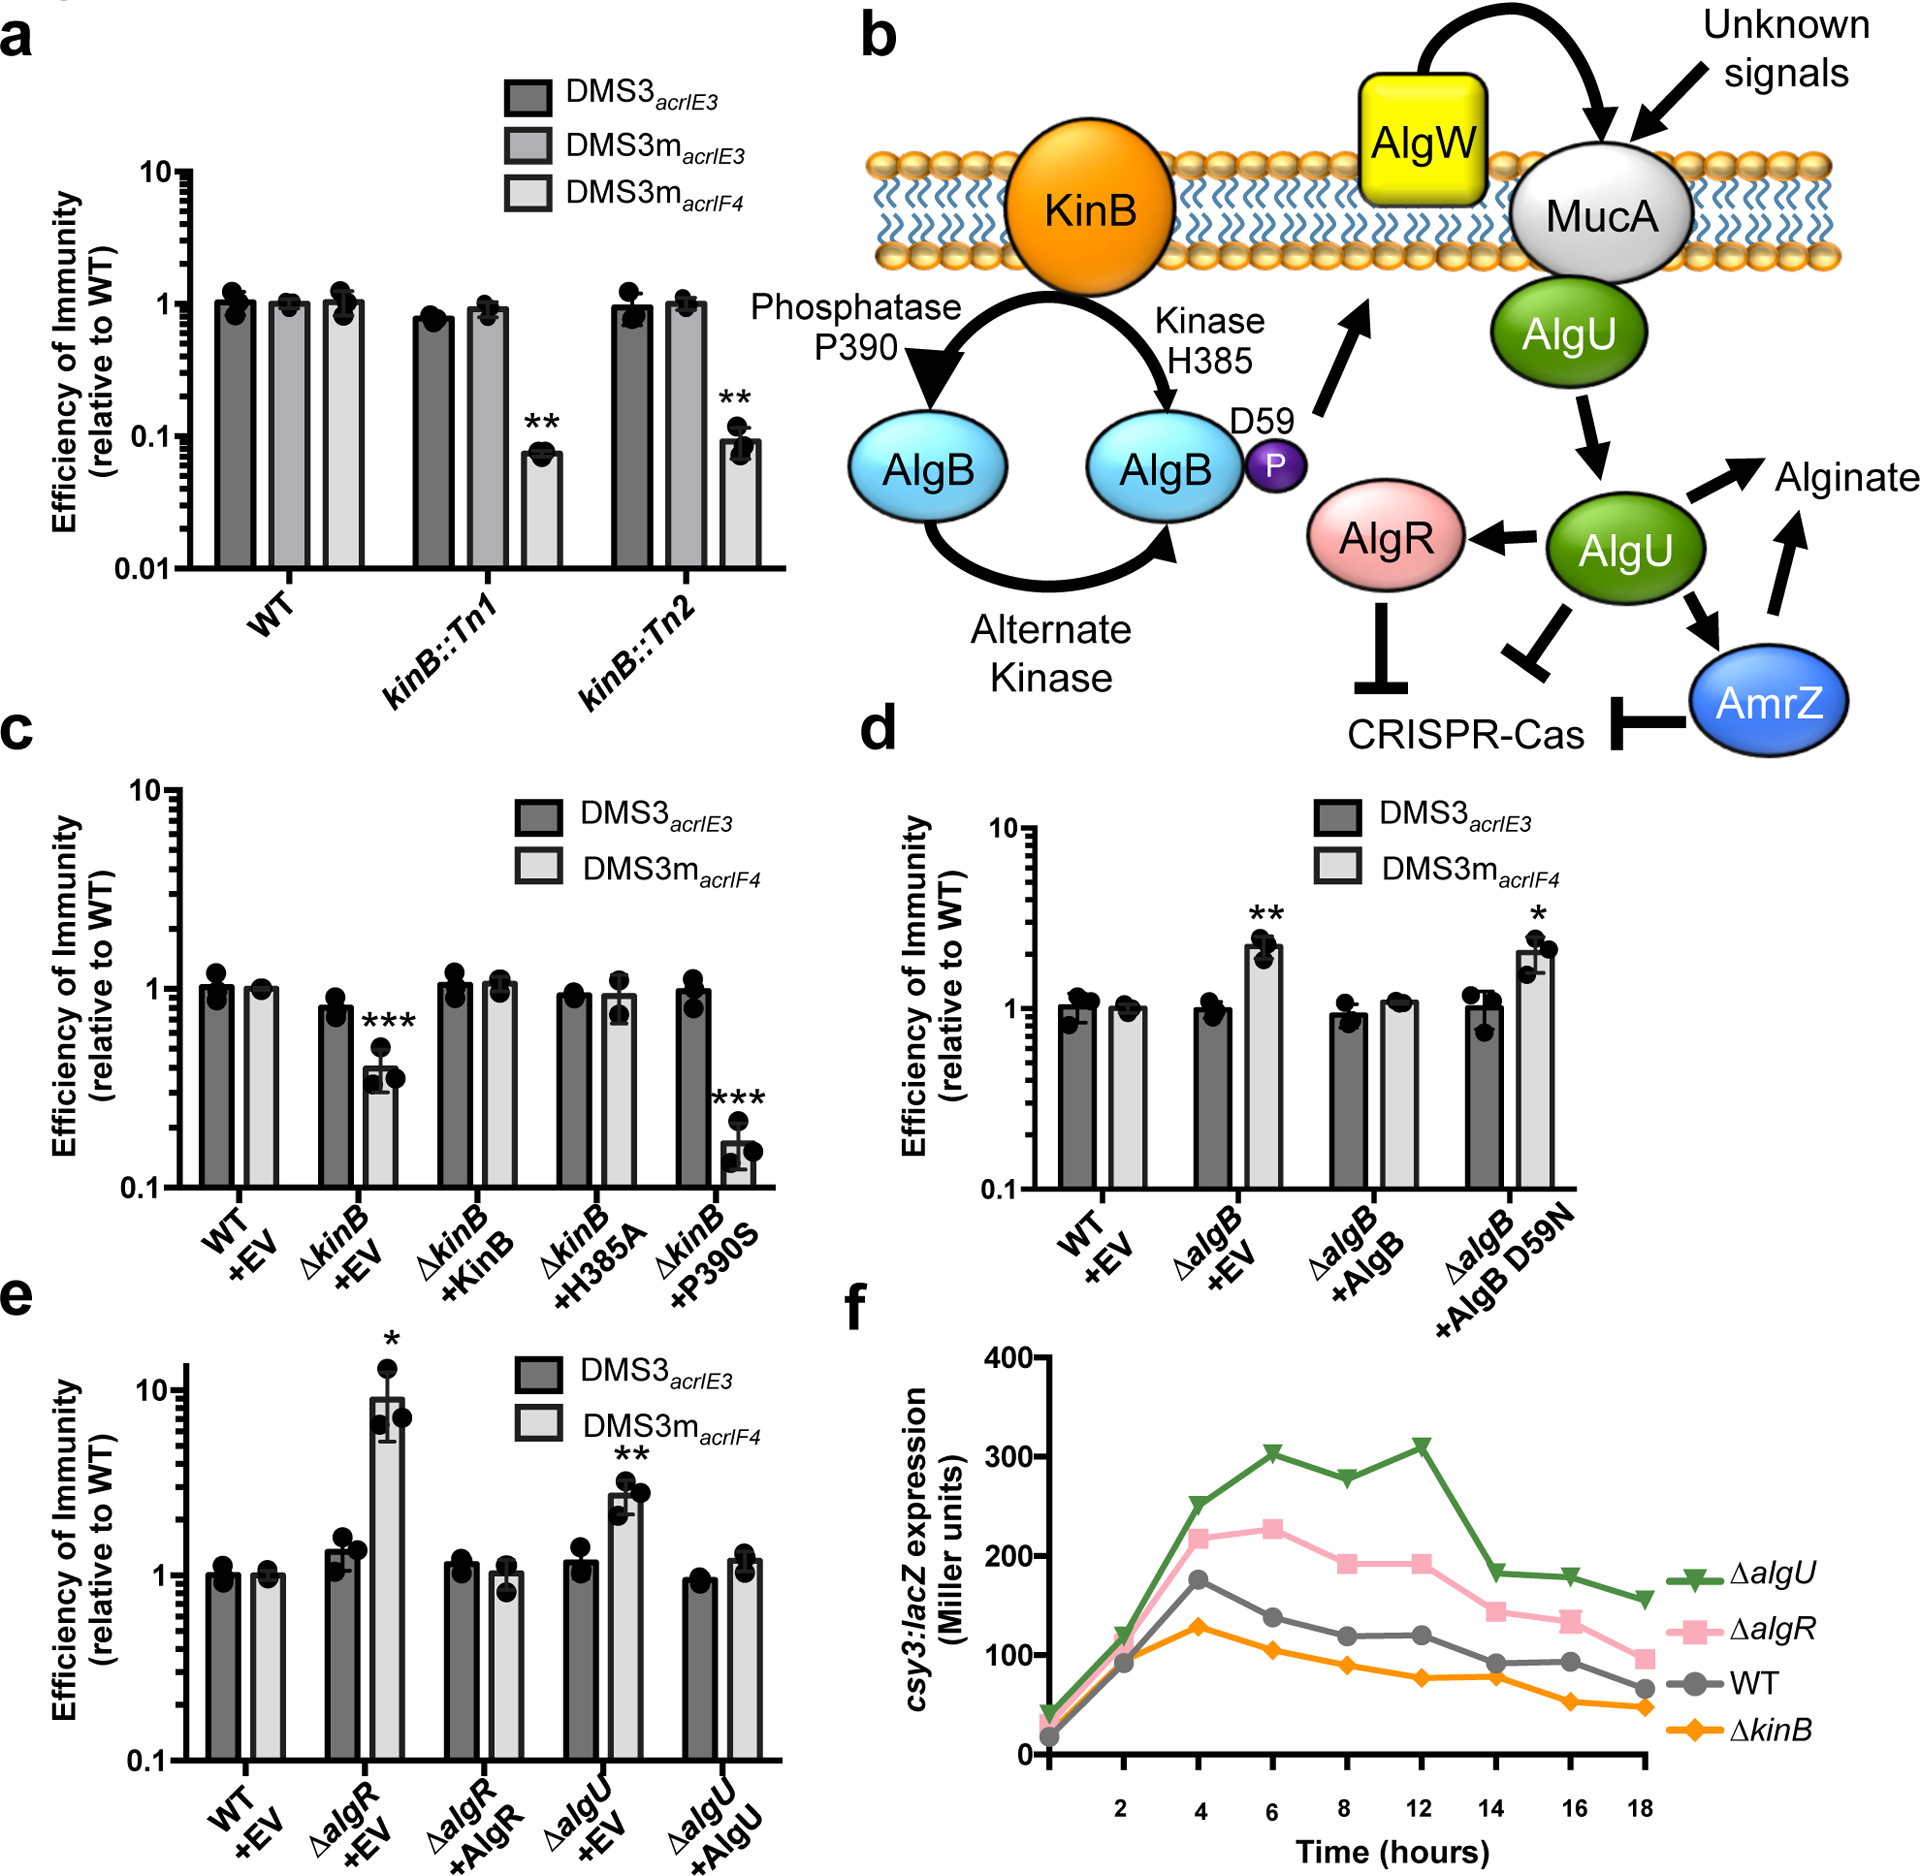
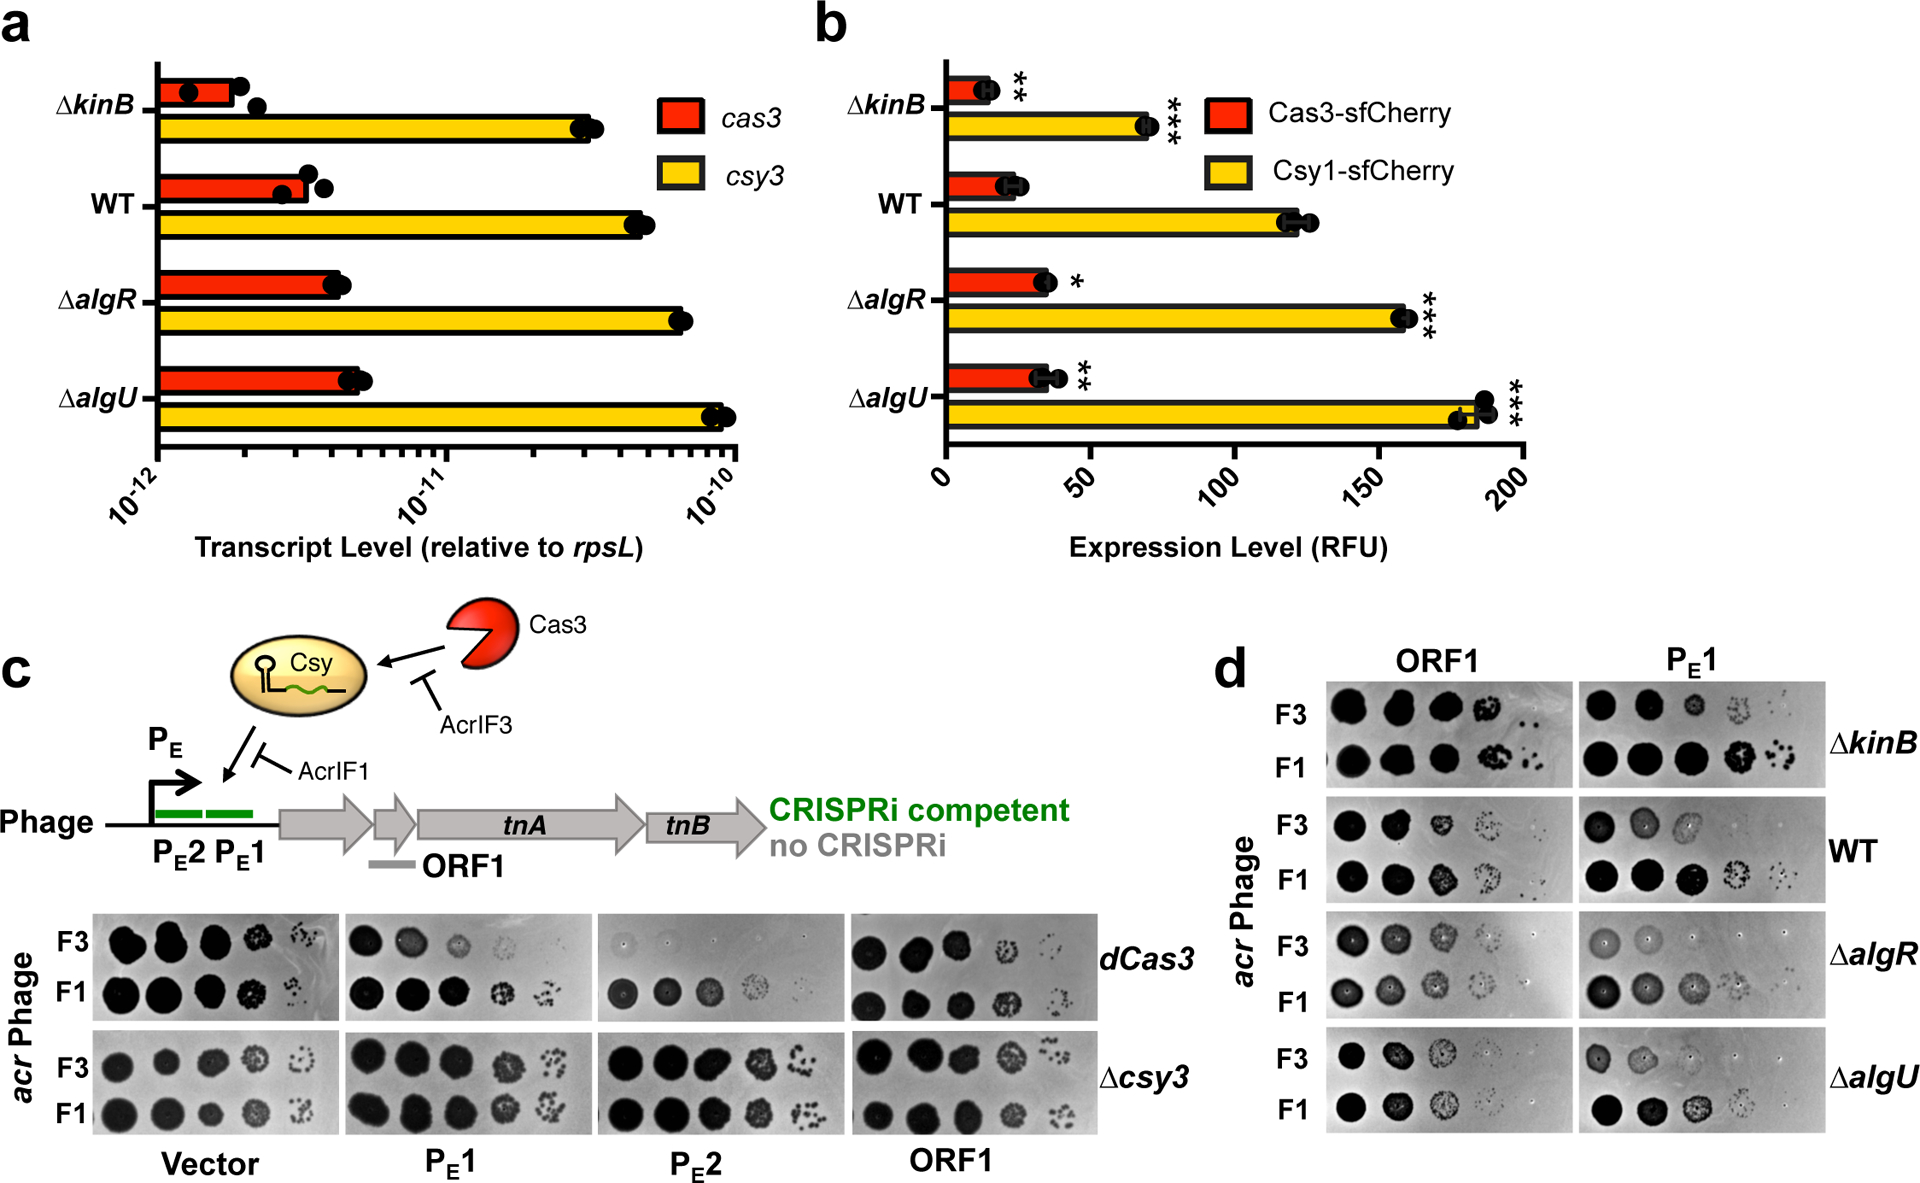
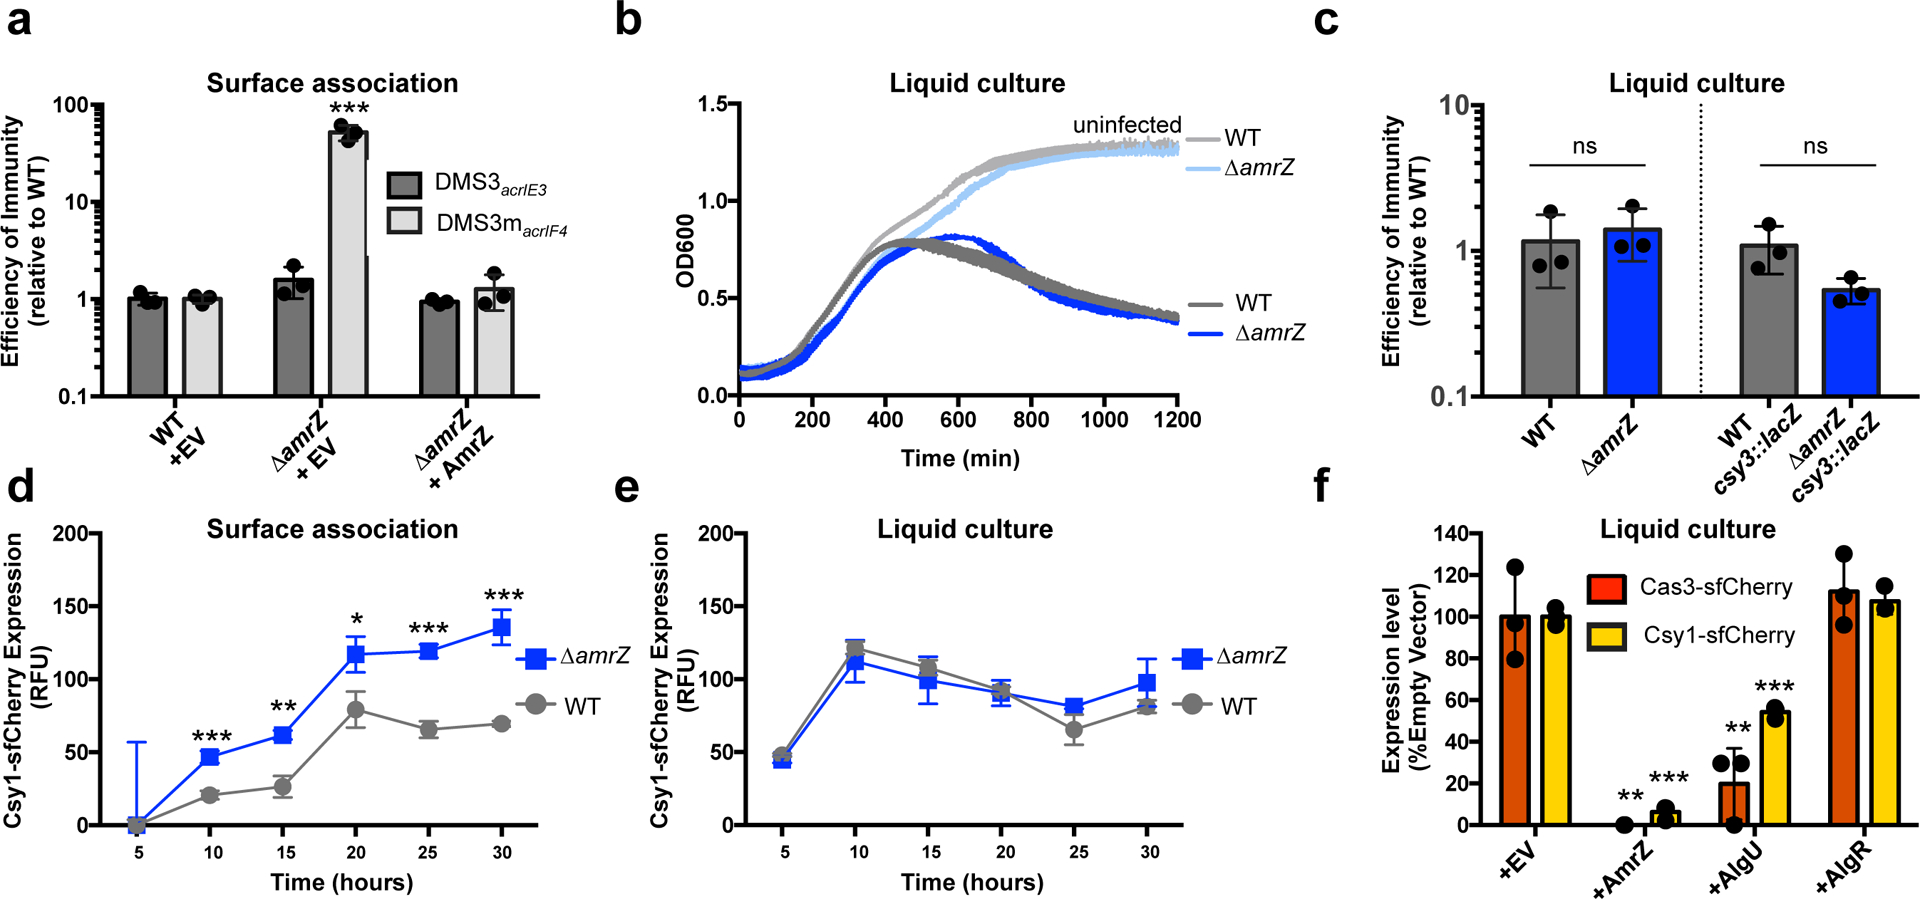
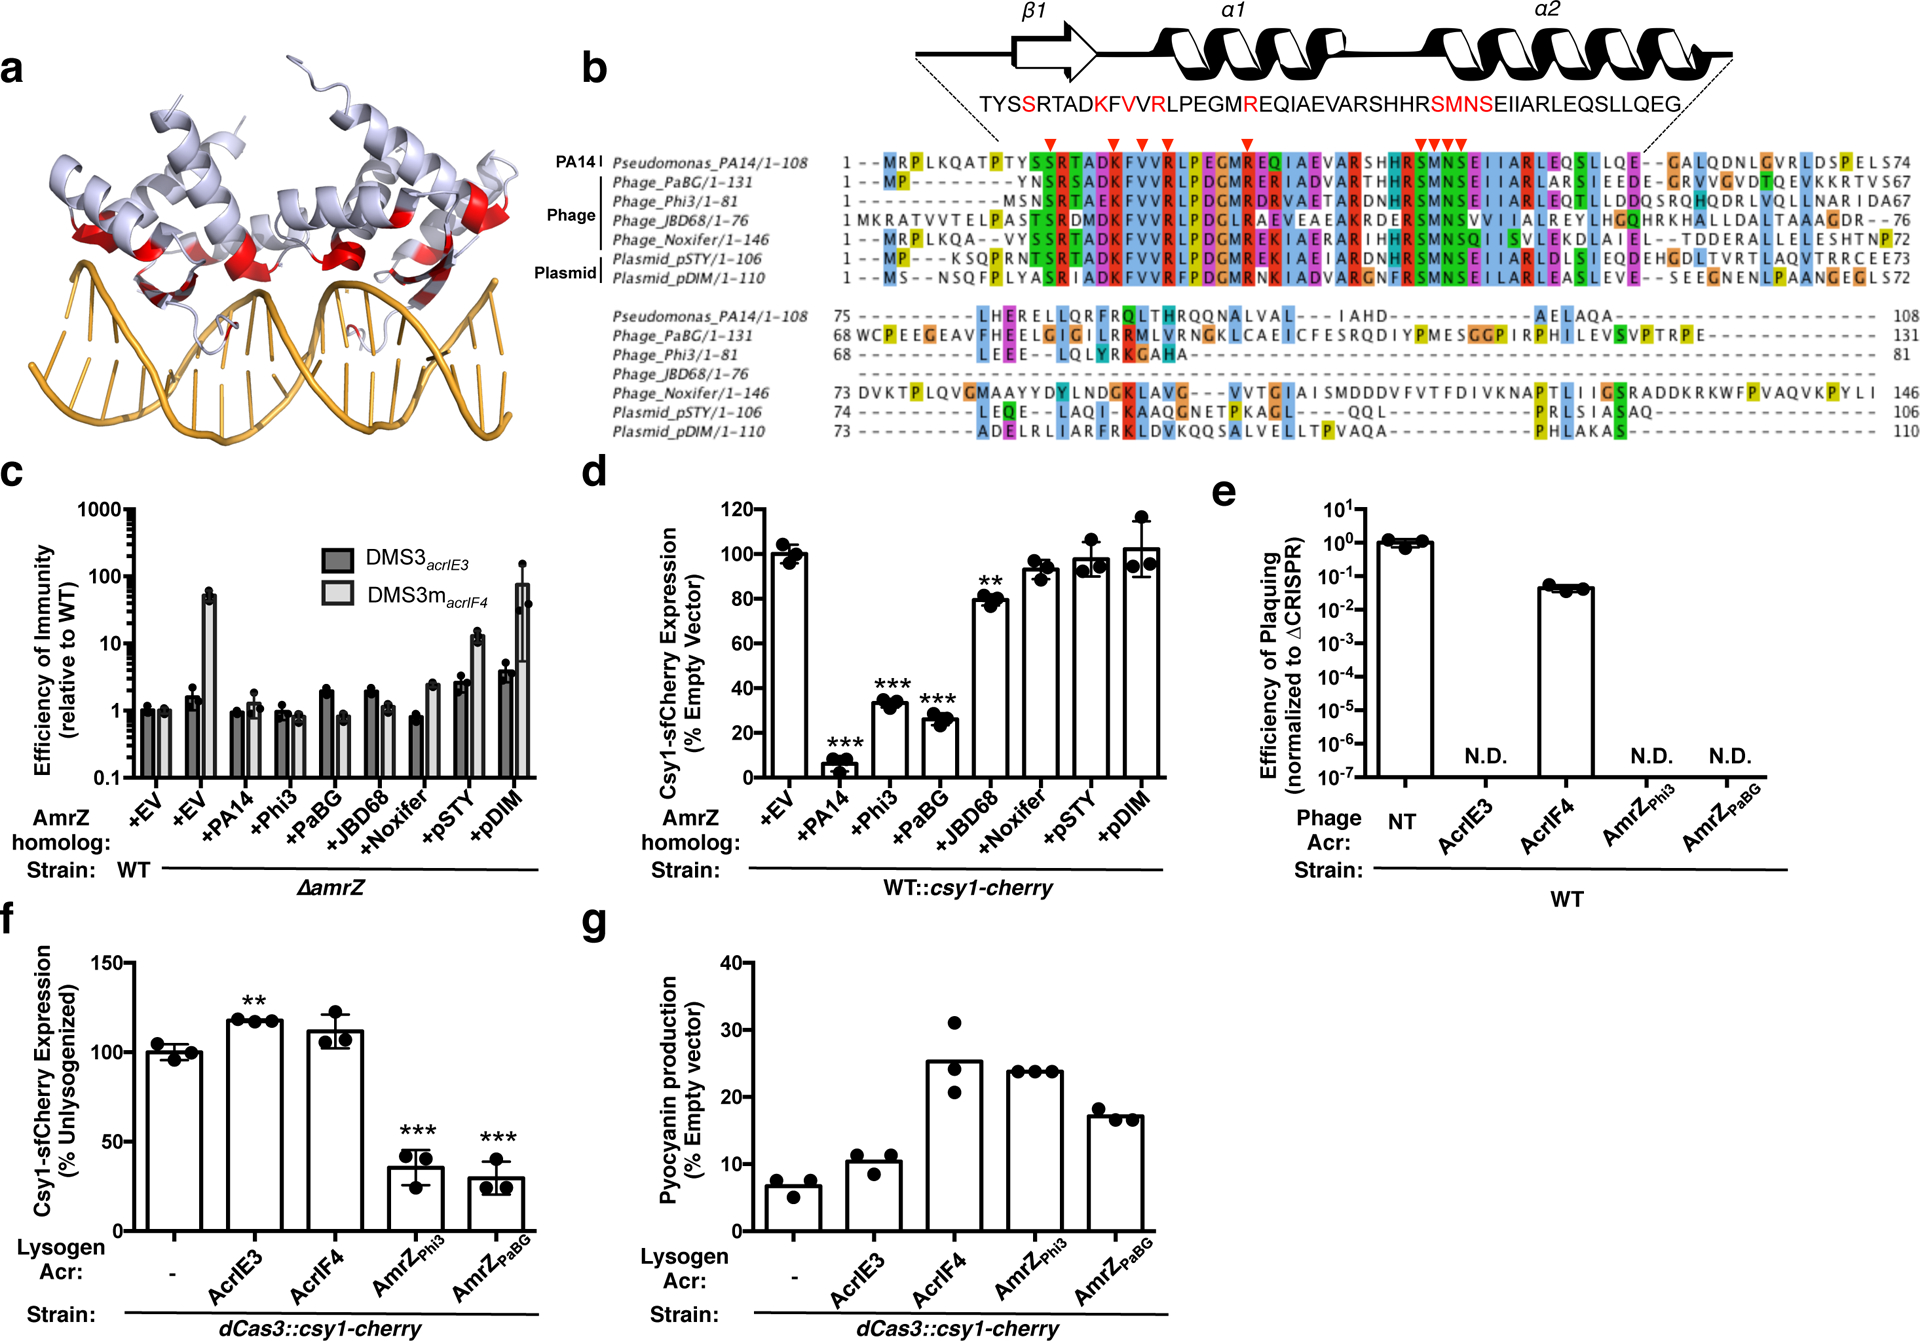
CRISPR-Cas systems are adaptive immune systems that protect bacteria from bacteriophage (phage) infection1. To provide immunity, RNA-guided protein surveillance complexes recognize foreign nucleic acids, triggering their destruction by Cas nucleases2. While the essential requirements for immune activity are well understood, the physiological cues that regulate CRISPR-Cas expression are not. Here, a forward genetic screen identifies a two-component system (KinB-AlgB), previously characterized in the regulation of Pseudomonas aeruginosa alginate biosynthesis3,4, as a regulator of the expression and activity of the P. aeruginosa Type I-F CRISPR-Cas system. Downstream of KinB-AlgB, activators of alginate production AlgU (a σE orthologue) and AlgR repress CRISPR-Cas activity during planktonic and surface-associated growth5. AmrZ, another alginate regulator6, is triggered to repress CRISPR-Cas immunity upon surface association. Pseudomonas phages and plasmids have taken advantage of this regulatory scheme and carry hijacked homologs of AmrZ that repress CRISPR-Cas expression and activity. This suggests that while CRISPR-Cas regulation may be important to limit self-toxicity, endogenous repressive pathways represent a vulnerability for parasite manipulation.


Conflict of interest statement

Competing Interests

J.B.-D. is a scientific advisory board member of SNIPR Biome and Excision Biotherapeutics and a scientific advisory board member and co-founder of Acrigen Biosciences.

Figures

Extended Data Figure 1.
Extended Data Figure 1.. Mapped insertions from transposon mutagenesis screen.
All independent transposon insertions identified and mapped by visual screening with increased or decreased csy3::lacZ β-galactosidase activity. β-galactosidase activity is expressed as a percentage of the unmutagenized parent strain, and measurements were taken at a single timepoint after 8 h of growth in liquid culture. The insertion location in the PA14 genome is shown, along with the measured level of β-galactosidase enzyme at the 8 hour timepoint. These measurements were not determined (N/D) for strains with a growth defect.
Extended Data Figure 2.
Extended Data Figure 2.. Characterization of kinB::Tn mutants.
a. A streak plate on X-gal plates, showing strains involved in this study and isolated transposon (Tn) insertions. csy3::lacZ is a derivative of WT PA14, and is the unmutagenized parent of kinB::Tn 1–3. b. β-galactosidase measurements of strains grown in liquid culture for the indicuated time. Measurements for the unmutagenized (csy3::lacZ) parent strain and three isolated kinB transposon mutants (kinB::Tn1–3) are shown, as well as a control PA14 culture with no lacZ insertion. c. Phage titration on lawns of the kinB::Tn1 mutant transformed with empty vector or kinB. d. Spot titration of phages JBD26 (CR2_sp17, sp20-targeted, possessing acrIF4), JBD25 (CR1_sp1 targeted) on kinB::Tn mutants and ΔCRISPR-Cas. These experiments have been replicated at least 2 times with consistent results.
Extended Data Figure 3.
Extended Data Figure 3.. Double knockouts of pathway members.
a-b. Efficiency of immunity measurements for indicated mutants relative to WT. a. Double knockouts show ΔkinB combined with algB, algU, algR, or amrZ. EOI measurements are shown as the mean of 3 biological replicates, +/− S.D. Mutants show increased EOI against DMS3macrIF4 relative to WT (ΔkinBΔalgB, P = 3.8 × 10⁻², ΔkinBΔalgU, P = 5.9 × 10⁻³, ΔkinBΔalgR , P = 1.5 × 10⁻² , ΔkinBΔamrZ, P = 3.2 × 10⁻³) Two-tailed unpaired Student’s T-test was used to calculate P value, *p < 0.05, **p <0.01. b. Indicated knockouts were combined with csy3::lacZ, EOI shown as the mean of two biological replicates.. These experiments have been replicated at least 2 times with consistent results.
Extended Data Figure 4.
Extended Data Figure 4.. AmrZ activity in liquid growth.
a. qRT-PCR measurements of transcript levels of csy3 (light grey) and cas3 (dark grey) normalized to the housekeeping gene rpsL after 8 h of growth in liquid culture. Measurements are represented as the mean of 3 technical replicates. b. Measurement of the fluorescence levels of Csy1-sfCherry (light grey) or Cas3-sfCherry (dark grey) reporter strains after 10 h of growth in liquid culture. Fluorescence measurements are represented as the mean of 3 biological replicates +/− SD. Cas3-sfCherry (P = 0.26) and Csy1-sfCherry levels (P = 0.35) in ΔamrZ did not differ significantly from WT. Two-tailed unpaired Student’s T-test was used to calculate P value, ns = not significant c. csy3::lacZ β-galactosidase activity from PA14 WT csy3::lacZ transformed with either empty vector (EV) or a plasmid overexpressing AmrZ (+AmrZ). β-galactosidase reporter activity was measured after 8 h in liquid growth and is represented as the mean of 3 technical replicates. Experiment was replicated two times with consistent results.
Extended Data Figure 5.
Extended Data Figure 5.. Mobile AmrZ homologs.
AmrZ homologs listed by the genome that encodes them, the accession number, and the mobile genetic element type.
Extended Data Figure 6.
Extended Data Figure 6.. AmrZ copy number analysis of two Pseudomonas aeruginosa strains.
AmrZ copy number analysis of two different strains of Pseudomonas aeruginosa. AmrZ homologs listed by accession number and their genomic coordinates. Phaster was used to identify the prophages encoding mobile AmrZ copies.
Extended Data Figure 7.
Extended Data Figure 7.. Cas and Csy RNA and protein levels across growth conditions.
a. Log2 of Fragments Per Kilobase of transcript per Million mapped reads (FPKM) shown for each I-F cas gene in PA14 in the indicated growth condition. b. Log2 of protein levels for each of the I-F Cas proteins in PA14 in the indicated growth condition.
Figure 1:
Figure 1:. A forward genetic screen identifies a role for an alginate-activating pathway in repressing CRISPR-Cas immunity.
a. Efficiency of immunity (EOI) against isogenic phages DMS3acrIE3 (non-targeted), DMS3macrIE3 (no I-F anti-CRISPR, CRISPR- targeted), and DMS3macrIF4 (weak I-F anti-CRISPR, CRISPR-targeted). Plaque forming units (PFUs) are presented as a ratio relative to the number of PFUs measured on WT PA14, quantified on two independent kinB transposon mutants (kinB::Tn1 and kinB::Tn2). Tn mutants show altered EOI against DMS3macrIF4 relative to WT (Tn1, P = 2.9 × 10⁻³, Tn2, P = 3.2 × 10⁻³) b. A cartoon summarizing the KinB/AlgB two component system and downstream effects, based on prior work (see text) with CRISPR-Cas regulation added. c,d,e. EOI measurements for indicated ΔalgB, ΔkinB, ΔalgR, and ΔalgU strains with complementation. Mutants show altered EOI against DMS3macrIF4 relative to WT (ΔkinB + EV, P = 4.30 × 10⁻⁴, ΔkinB + P390S, P = 5.6 × 10⁻⁶ ΔalgB + EV, P = 2.8 × 10⁻³, ΔalgB + D59N, P = 1.8 × 10⁻² ΔalgR + EV, P = 1.9 × 10⁻², ΔalgU + EV, P = 6.6 × 10⁻³). f. csy3::lacZ β-galactosidase activity over time in the indicated strain backgrounds. Experiment was replicated twice with fewer timepoints and consistent results seen. All EOI data are represented as the mean of 3 biological replicates +/− SD and β-galactosidase reporter activity is represented as the mean of 3 technical replicates. Two-tailed unpaired Student’s T-test was used to calculate P values, *p < 0.05, **p < 0.01, ***p < 0.001.
Figure 2.
Figure 2.. The KinB/AlgB pathway modulates Cas3 and Csy protein and RNA levels.
a. qRT-PCR measurements of transcript levels of cas3 (red) and csy3 (yellow) normalized to the housekeeping gene rpsL after 8 h of growth in liquid culture. Measurements are represented as the mean of 3 technical replicates. b. Measurement of the fluorescence levels of Cas3-sfCherry (red) or Csy1-sfCherry (yellow) reporter strains after 10 h of growth in liquid culture. Fluorescence measurements are represented as the mean of 3 biological replicates +/− SD. Mutants show altered Cas3-sfCherry levels (ΔkinB, P = 7.8 × 10⁻³ ΔalgR, P = 1.5 × 10⁻⁴ ΔalgU, P = 1.1 × 10⁻⁴) and Csy1-sfCherry levels relative to WT (ΔkinB, P = 3.3 × 10⁻⁵, ΔalgR, P = 1.5 × 10⁻⁴, ΔalgU, P = 1.1 × 10⁻⁴). Two-tailed unpaired Student’s T-test was used to calculate P values,*p < 0.05, **p < 0.01, ***p < 0.001. c. Spot titration of F3 (DMS3macrIF3) or F1 (DMS3macrIF1) on dCas3 (dead Cas3) or Δcsy3 (active Cas3, no Csy complex) strains. Phages are targeted by natural spacer CR2_sp1, as well as crRNAs designed to target DMS3m genome in positions designated on ORF map. d. Spot titration of DMS3macrIF3 and DMS3macrIF1 phages on WT PA14 or deletion mutants expressing the indicated crRNA. Plaquing experiments were replicated 3 times and consistent results seen.
Figure 3:
Figure 3:. AmrZ is a surface-activated repressor of CRISPR-Cas immunity.
a. Efficiency of immunity (EOI) against phages DMS3acrIE3 (non-targeted) and DMS3macrIF4 (CRISPR-targeted). Plaque forming units (PFUs) were quantified on ΔamrZ or the complemented strain, then represented as a ratio of the number of PFUs measured on WT PA14. ΔamrZ + EV shows increased EOI against DMS3macrIF4 relative to WT (P = 7.3 × 10⁻⁴). EOI measurements are represented as the mean of 3 biological replicates +/− SD. b. Growth curves of PA14 WT and ΔamrZ infected with 106 PFU of virulent DMS3macrIF4 alongside uninfected controls. c. EOI against virulent DMS3macrIF4 in liquid culture of WT and ΔamrZ strains (CRISPR active) or WT csy3::lacZ and ΔamrZ csy3::lacZ (CRISPR inactive). PFUs were quantified after 24 h from ΔamrZ or amrZ csy3::lacZ, then represented as a ratio of PFUs from WT or WT csy3::lacZ, respectively. OD600 and EOI measurements are represented as the mean of 3 biological replicates +/− SD. ΔamrZ and ΔamrZ csy3::lacZ show no significant difference of EOI relative to WT and WT csy3::lacZ, respectively (ΔamrZ, P = 0.6 ΔamrZ csy3::lacZ, P = 0.08). d, e. Timecourse of the fluorescence levels of Csy1-sfCherry reporter strains during surface-association (d) or planktonic growth (e). ΔamrZ has increased Csy1-sfCherry levels during surface association relative to WT (10 h, P = , 8.9 × 10⁻⁴, 15 h, P = 1.5 × 10⁻³, 20 h, P = 2.0 × 10⁻², 25 h, P = 2.2 × 10⁻⁴ , 30 h , P = 7.0 × 10⁻⁴) f. Normalized fluorescence measurements of WT Cas3-sfCherry (red) or Csy1-sfCherry (yellow) overexpressing the indicated transcription factor after 10 h growth in liquid culture. AmrZ and AlgU overexpression reduced Cas3-sfCherry (AmrZ, P = 1.5 × 10⁻³, AlgU, P = 7.8 × 10⁻³) and Csy1-sfCherry (AmrZ, P = 7.5 × 10⁻⁶, AlgU, P = 9.9 × 10⁻⁵) levels relative to WT. Fluorescence measurements are represented as the mean of 3 biological replicates +/− SD. Two-tailed unpaired Student’s T-test was used to calculate P values, ns = not significant, *p < 0.05, **p < 0.01, ***p < 0.001.
Figure 4.
Figure 4.. Phage-derived AmrZ homologs control CRISPR-Cas immunity.
a. Structure of an AmrZ tetramer bound to 18bp of operator DNA with DNA-contacting residues highlighted in red. b. Alignment of six mobile AmrZ homologs and the native PA14 AmrZ homolog, with the ribbon-helix-helix DNA binding domain schematized and DNA-contacting residues indicated with red arrows and text. c. Efficiency of immunity (EOI) against DMS3acrIE3 (non-targeted) and DMS3macrIF4 (CRISPR-targeted). Plaque forming units (PFUs) were quantified on ΔamrZ or the strains complemented with AmrZ homologs, and represented as a ratio to the number of PFUs measured on WT PA14. Measurements are represented as the mean of 3 biological replicates +/− SD. d. Normalized fluorescence levels of Csy1-sfCherry reporter strains expressing AmrZ homologs after 10 h of growth in liquid culture, shown as mean of 3 biological replicates, +/− SD. AmrZ homologs from PA14, Phi3, PaBG, and JBD68 repressed Csy1-sfCherry relative to WT (PA14, P = 7.5 × 10⁻⁶, Phi3, P = 1.5 × 10⁻⁵, PaBG, P = 1.3 × 10⁻⁵, JBD68, P = 1.9 × 10⁻³). e. Efficiency of plaquing (EOP) of non-targeted DMS3acrIE3 phage (NT) or targeted DMS3macr phages. EOP is the ratio of PFUs on PA14 WT over PFUs formed on PA14 ΔCRISPR, represented as the mean of 3 biological replicates, +/− S.D. N.D. = not detectable. f. Fluorescence levels of dCas3::csy1-sfCherry after 16 h liquid growth lysogenized with the indicated DMS3macr phage, normalized to the unlysogenized control (−), and represented as the mean of 3 biological replicates +/− SD. Expression of AmrZPhi3 (P = 4.9 × 10⁻⁴) and AmrZPaBG (P = 2.8 × 10⁻⁴) from a prophage repressed Csy1-sfCherry expression relative to an unlysogenized control. g. Pyocyanin production from dCas3::csy1-sfCherry reporter strains lysogenized with the indicated DMS3macr phage or the unlysogenized control (−) after 16 h of growth in liquid culture. Pyocyanin levels during phzM-targeting are shown as a percentage of pyocyanin levels in an empty vector control, and represented as the mean of 3 technical replicates. Experiment was replicated three times and consistent results seen. Two-tailed unpaired Student’s T-test was used to calculate P values, ns = not significant, *p < 0.05, **p < 0.01, ***p < 0.001.

Similar articles

Cited by

References

    1. Barrangou R et al. CRISPR provides acquired resistance against viruses in prokaryotes. Science 315, 1709–1712 (2007). - PubMed
    1. Brouns SJJ et al. Small CRISPR RNAs guide antiviral defense in prokaryotes. Science 321, 960–964 (2008). - PMC - PubMed
    1. Damron FH, Qiu D & Yu HD The Pseudomonas aeruginosa sensor kinase KinB negatively controls alginate production through AlgW-dependent MucA proteolysis. J. Bacteriol 191, 2285–2295 (2009). - PMC - PubMed
    1. Damron FH et al. Analysis of the Pseudomonas aeruginosa Regulon Controlled by the Sensor Kinase KinB and Sigma Factor RpoN. J. Bacteriol 194, 1317–1330 (2012). - PMC - PubMed
    1. Wozniak DJ & Ohman DE Transcriptional analysis of the Pseudomonas aeruginosa genes algR, algB, and algD reveals a hierarchy of alginate gene expression which is modulated by algT. J. Bacteriol 176, 6007–6014 (1994). - PMC - PubMed

Publication types

MeSH terms