. 2020 Apr;22(4):453-464.
doi: 10.1038/s41556-020-0485-0. Epub 2020 Mar 23.

Phase separation of TAZ compartmentalizes the transcription machinery to promote gene expression

Affiliations

Phase separation of TAZ compartmentalizes the transcription machinery to promote gene expression

Yi Lu et al. Nat Cell Biol. 2020 Apr.

Abstract

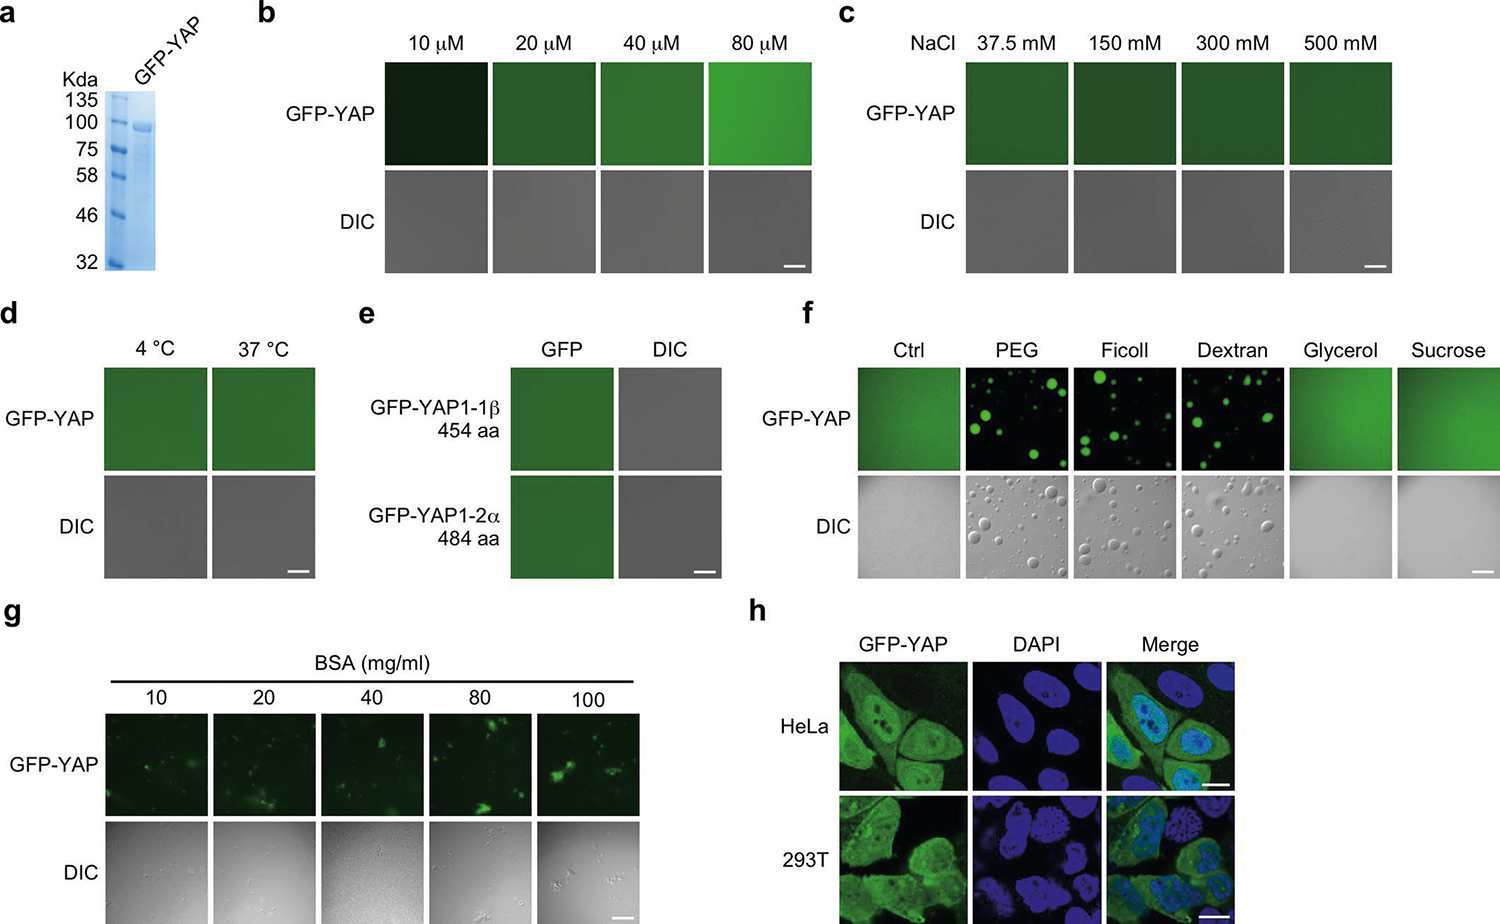
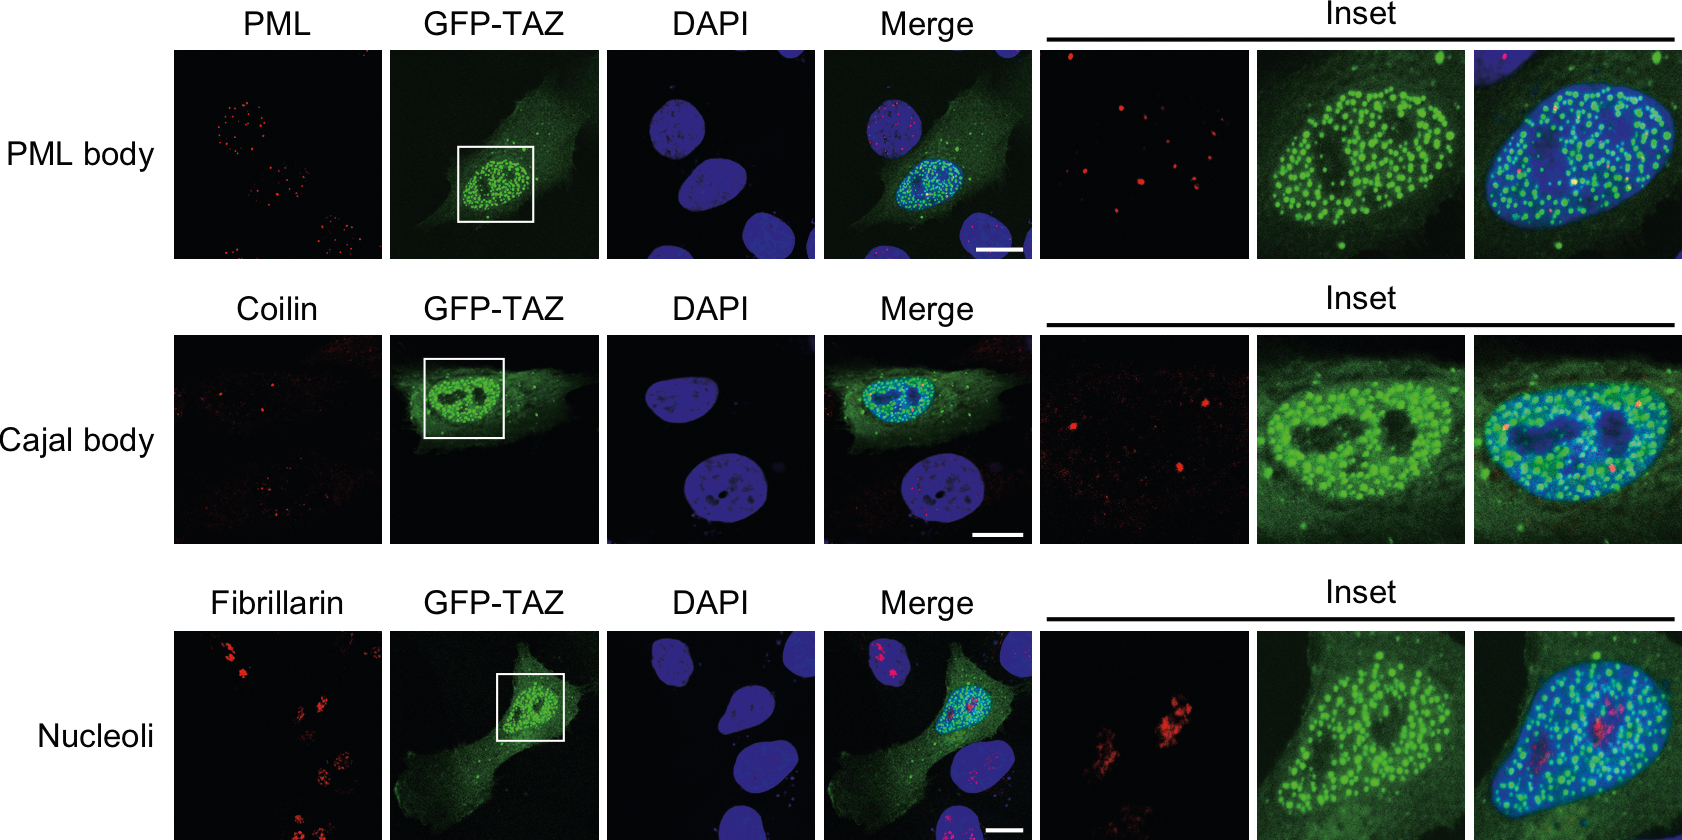
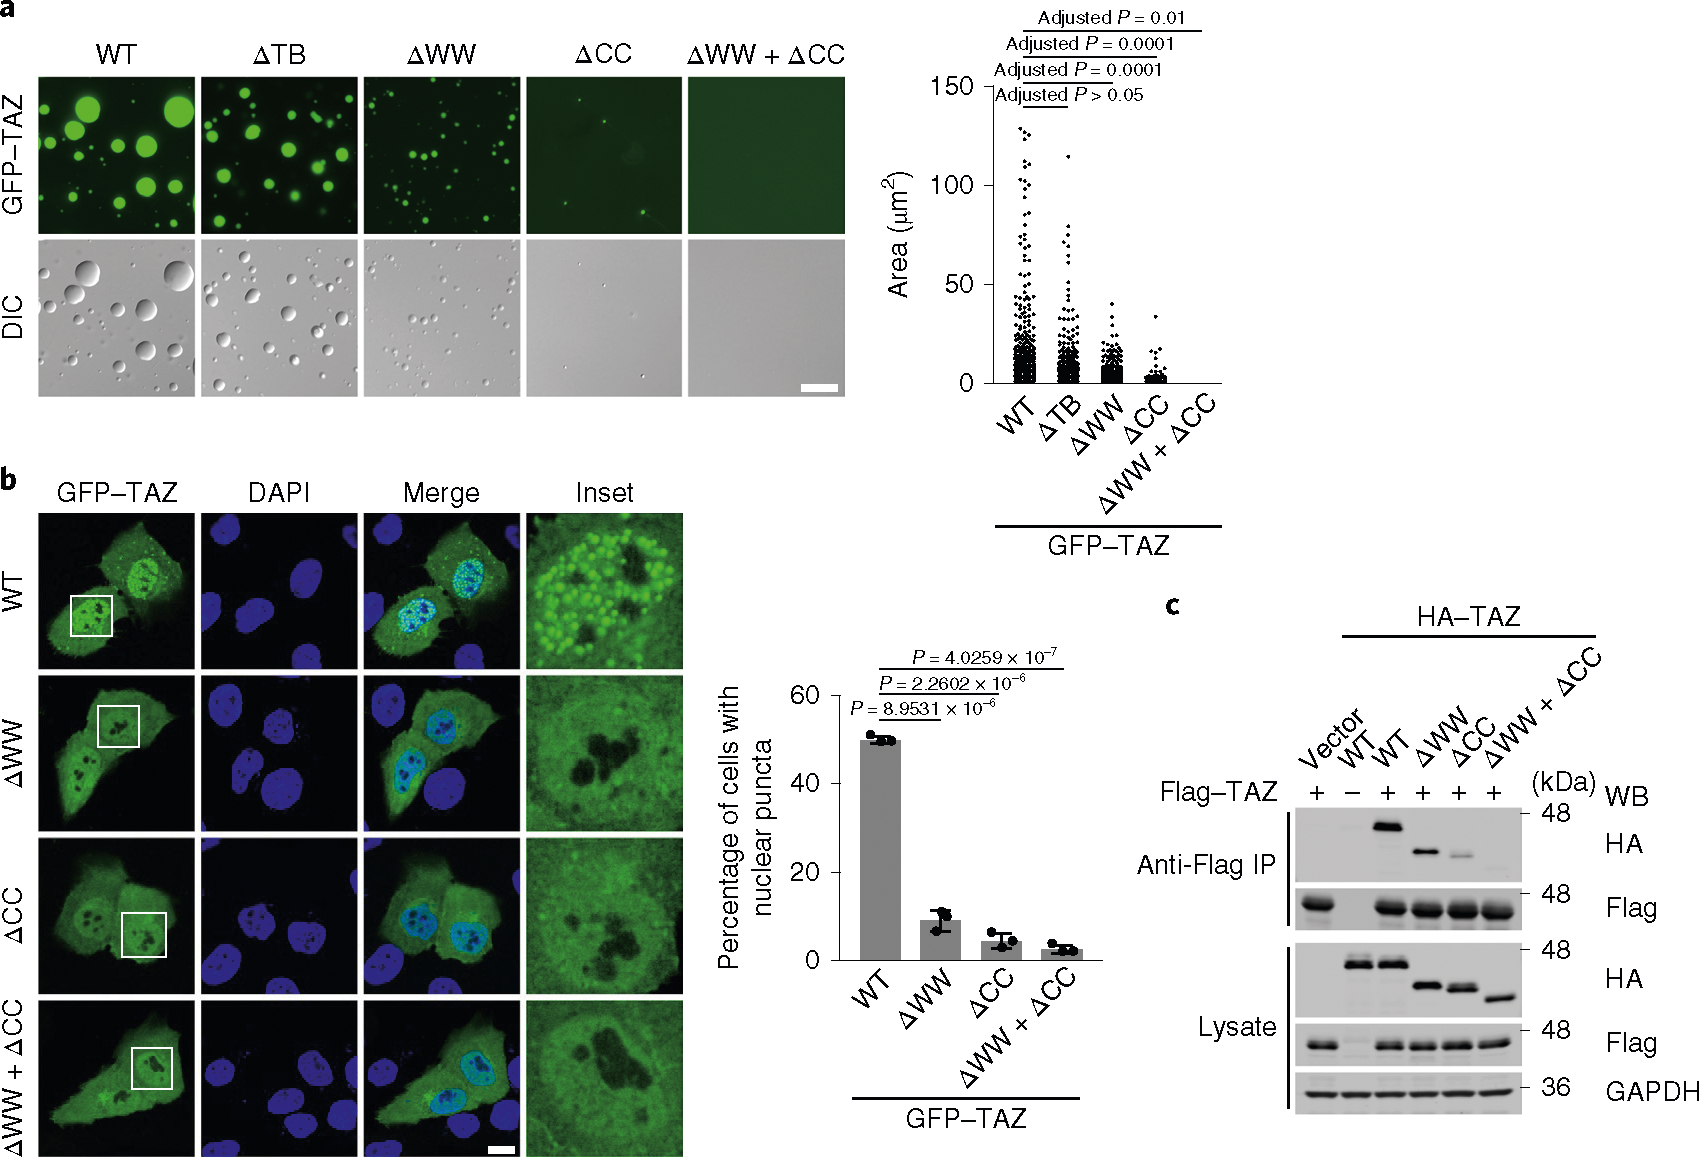
TAZ promotes growth, development and tumorigenesis by regulating the expression of target genes. However, the manner in which TAZ orchestrates the transcriptional responses is poorly defined. Here we demonstrate that TAZ forms nuclear condensates through liquid-liquid phase separation to compartmentalize its DNA-binding cofactor TEAD4, coactivators BRD4 and MED1, and the transcription elongation factor CDK9 for transcription. TAZ forms phase-separated droplets in vitro and liquid-like nuclear condensates in vivo, and this ability is negatively regulated by Hippo signalling through LATS-mediated phosphorylation and is mediated by the coiled-coil (CC) domain. Deletion of the TAZ CC domain or substitution with the YAP CC domain prevents the phase separation of TAZ and its ability to induce the expression of TAZ-specific target genes. Thus, we identify a mechanism of transcriptional activation by TAZ and demonstrate that pathway-specific transcription factors also engage the phase-separation mechanism for efficient and specific transcriptional activation.


Conflict of interest statement

Competing interests

The authors declare no competing interests.

Figures

Extended Data Fig. 1 |
Extended Data Fig. 1 |. Regulation of TAZ droplet formation in vitro and nuclear puncta formation in vivo.
a, GFp-TAZ purified from E. coil were analysed by SDS-pAGE and visualized by Coomassie blue staining. b. 50 μM GFp-TAZ were heated-inactivated (5 min at 95 °C and immediately put on ice for 5 min) or treated with 100 μg/ml proteinase K for 30 min at 40 °C, and then subjected to droplet formation assay in vitro in the presence of 500 mM NaCl at room temperature. c, Ectopically expressed GFp-TAZ was expressed at a lower level than endogenous TAZ in MCF-10A cells as shown by western blotting. GApDH was used as a loading control. d, Flag-TAZ formed nuclear puncta when transfected into the MCF-10A cells, as detected by immunofluorescence staining with anti-Flag. Scale bar, 10 μm. Experiments in ad were repeated independently three times with similar results. Unprocessed blots are provided in Unprocessed Blots Extended Data Fig. 1.
Extended Data Fig. 2 |
Extended Data Fig. 2 |. YAP does not form droplets in vitro and in vivo in the absence of crowding agents.
a, GFp-YAp purified from E. coil were analyzed by SDS-pAGE and visualized by Coomassie blue staining. b, GFp-YAp at varying concentrations was subjected to the droplet formation assay at room temperature and in the presence of 500 mM NaCl. c, 50 μM GFp-YAp was subjected to the droplet formation assay at room temperature in the presence of indicated salt concentrations. d, 50 μM GFp-YAp was subjected to droplet formation in the presence of 150 mM NaCl at 4 °C or 37 °C. e, Two YAp isoforms, GFp-YAp1–1β or GFp-YAp1–2α, did not form droplets (50 μM protein, 500 mM NaCl and room temperature). aa, amino acids. f, 50 μM GFp-YAp formed droplets in the presence of 10% pEG-8000, Ficoll or Dextran but not 10% glycerol or sucrose. Droplet formation assay was performed in the presence of 500 mM NaCl at room temperature. g, 50 μM GFp-YAp did not form droplets in the presence of BSA at varying concentrations. h, GFp-YAp did not form nuclear puncta in both HeLa cells and 293T cells. Scale bars, 10 μm. Experiments in ah were repeated independently three times with similar results.
Extended Data Fig. 3 |
Extended Data Fig. 3 |. The CC and WW domains are required for TAZ to form nuclear puncta.
a, Domain structure of TAZ and TAZ truncations. The numbers above indicate the position of amino acid residues. b, Bacterially purified GFp-TAZ, ΔTB, ΔWW, ΔCC, and ΔWW+ΔCC proteins were analyzed by SDS-pAGE and detected by Coomasssie blue staining. c, Localization of GFp-TAZ and various mutants in HeLa cells. d, Localization of GFp-TAZ and various TAZ/YAp chimera in HeLa cells. Scale bars, 10 μm. e, A GST pull-down assay was performed by incubating immobilized GST fusion proteins with lysates of cells expressing HA-tagged WT or mutant TAZ, and the associated TAZ proteins were detected by western blotting with anti-HA (upper). GST fusion proteins were assessed by western blotting with anti-GST, and HA-TAZ proteins in the cell lysates were measured by western blotting (lower). Experiments in be were repeated independently three times with similar results. Unprocessed blots are provided in Unprocessed Blots Extended Data Fig. 3.
Extended Data Fig. 4 |
Extended Data Fig. 4 |. TAZ CC domain enhances YAP phase separation in the presence of PeG.
a, Domain structure of YAp chimera. b, Substitution of the YAp CC and WW domains with that of TAZ is not sufficient to enable YAp to undergo LLpS in MCF10A cells in the absence of pEG. c, Coomasssie blue staining of various recombinant proteins purified from E. coil. d, 25 μM bacterially purified GFp-YAp chimera proteins were subjected to droplet formation assay in the presence of 10% pEG-8000. Quantification of the droplets is on the right. Scale bar, 10 μm. Data shown as the mean ± s.e.m. Statistical significance was evaluated using One-way ANOVA with Krusk-Wallis test. Droplets in n = 3 fields in each group were quantified. e, The TAZ CC and WW domains enhanced LLpS by GFp-YAp in transfected MCF10A cells in the presence of pEG as shown by confocal microscopy. Scale bar, 10 μm. Quantification of the percentage of cells that displayed nuclear puncta is shown on the right. Data shown as the mean ± s.e.m.. P value was determined by unpaired two-tailed Student’s t-test. 80 transfected cells in each group were quantified. n = 3 biologically independent samples. Experiments in b, c, e were repeated independently three times with similar results. Experiments in d were repeated twice with similar results. Statistical source data for d, e, are provided in Statistical Source Date Extended Data Fig. 4.
Extended Data Fig. 5 |
Extended Data Fig. 5 |. Hippo signaling negatively regulates TAZ phase separation in HeLa cells.
TAZ localization was examined by immunofluorescence staining with anti-TAZ (green) in HeLa cells that have been subjected to the following treatments: a, Serum-starved HeLa cells were treated with 1 μM LpA or 50 ng/ml EGF for 1 h. b, Serum-starved HeLa cells were seeded on fibronectin-coated coverslips for 10 min or 2 h in serum-free medium. c, HeLa cells were grown on fibronectin-coated polyacrylamide hydrogels of 1 kpa and 40 kpa stiffness. d, HeLa cells were treated with 1 μg/ml Latrunculin B for 1 h. Alexa Fluor 555-conjugated phalloidin (red) staining was performed to detect F-actin in b-d. Scale bar, 10 μm. Experiments in ad were repeated independently three times with similar results.
Extended Data Fig. 6 |
Extended Data Fig. 6 |. LATS2 regulates TAZ LLPS and recruitment of TeAD4 and BrD4.
a, MCF-10A cells transfected with GFp-TAZ-S89A and Flag-LATS2 were subjected to immunofluorescence staining with anti-Flag (red). Scale bar, 10 μm. b, MCF-10A cells stably expressing siLATS1/2 were transfected with GFp-TAZ and Flag-TEAD4. TEAD localization at high cell density was detected by immunofluorescence staining with anti-Flag (red). Scale bar, 10 μm. c, MCF-10A cells stably expressing siLATS1/2 were transfected with GFp-TAZ. Endogenous BrD4 localization was examined by immunofluorescence staining with anti-BrD4 (red). Scale bar, 10 μm. All experiments were repeated independently three times with similar results.
Extended Data Fig. 7 |
Extended Data Fig. 7 |. TAZ nuclear condensates do not co-localize with the PML bodies, Cajal bodies or nucleoli.
The pML nuclear bodies, Cajal Bodies and nucleoli in MCF-10A cells expressing GFp-TAZ (green) were detected by immunofluorescence staining with antibodies targeting pML, Coilin and Fibrillarin, respectively (red). Scale bar, 10 μm. Experiments were repeated independently three times with similar results.
Extended Data Fig. 8 |
Extended Data Fig. 8 |. TAZ mutants lacking the CC domain still bind to LAST2 and TeAD4.
a, HA-tagged WT and mutant TAZ were co-transfected into 293T cells with Flag-LATS2. TAZ proteins associated with LATS2 were isolated by immunoprecipitation with anti-Flag and detected by western blotting with anti-HA antibodies (upper panels). The abundance of these proteins in the cell lysates was assessed by western blotting (lower panels). GApDH was used as a loading control. b, Interaction of various TAZ mutants with Flag-TEAD4 was analyzed by co-Ip assay as described in a. c, Interaction of various TAZ/YAp chimera with LATS2 was analyzed by co-Ip as described in a. All experiments were repeated independently three times with similar results. Unprocessed blots are provided in Unprocessed Blots Extended Data Fig. 8.
Fig. 1 |
Fig. 1 |. TAZ undergoes LLPS in vitro and in vivo.
a, Domain structure and the intrinsically disordered tendency of TAZ (top) and YAp (bottom). IUpred assigned scores of disordered tendencies between 0 and 1 to the sequences (a score of more than 0.5 indicates disordered). b, GFp–TAZ and GFp–YAp were analysed for the formation of droplets at room temperature and 500 mM NaCl. c,d, GFp–TAZ or GFp–YAp (50 μM) was analysed using droplet-formation assays at room temperature with the indicated concentrations of NaCl (c) or at 4 °C or 37 °C with 150 mM NaCl (d). Temp, temperature. e, 1,6-hexanediol (Hex; 5%) disrupted droplet formation. GFp–TAZ (50 μM) was analysed at room temperature and with 500 mM NaCl with or without 5% Hex. For be, representative fluorescence and differential interference contrast (DIC) images of the droplets (left) and quantification of the size and number of droplets (right) are shown. Each dot represents a droplet. Data are mean ± s.e.m. Droplets in n = 3 fields (166 × 124 μm2) in each group were quantified. f, GFp–TAZ formed nuclear puncta in MCF-10A cells. Cells transfected with GFp–TAZ or GFp–YAp were treated with or without 5% Hex for 1 min and imaged. Nuclei were stained with 4,6-diamidino-2-phenylindole (DApI; blue). Inset: an enlarged view of the nuclear puncta magnified by 3.07, 3.47 and 2.96 times, respectively. Quantification of the percentage of cells that displayed nuclear puncta is shown on the right. Data are mean ± s.e.m.; 80 transfected cells in each group were quantified; n = 3 biologically independent samples. g, Endogenous TAZ showed nuclear puncta in the indicated cells. TAZ was stained with anti-TAZ antibodies (green). Insets, magnification by 2.56 and 3.04 times, respectively. h, TAZ formed nuclear puncta in tissues. The human breast cancer tissue array was stained with anti-TAZ antibodies (green), and representative images are shown. Insets, magnification by 13.34, 10.00 and 8.88 times, respectively. The experiments shown in bg were repeated independently three times with similar results. The experiments shown in h were repeated independently twice with similar results. Source data are available online. For bh, scale bars, 10 μm.
Fig. 2 |
Fig. 2 |. TAZ nuclear condensates display liquid-like properties.
a, Live-cell imaging of MCF-10A cells expressing GFp–TAZ. The arrows indicate representative TAZ puncta that fused over time. This assay was performed three times (three independent transfections) with similar results. b,c, Typical FrAp curves with ×40 (b) or ×63 (c) objectives in organelles larger than the laser beam. The solid lines are a nonlinear regression best fit to the diffusion equation. d,e, Average values for the FrAp data shown in b and c. Data are mean ± s.e.m. of GFp–TAZ in the cytoplasm (n = 45 independent measurements) or nuclear puncta (n = 40 independent measurements). f, FrAp beam-size bootstrap analysis. The studies used ×40 and ×63 objectives, the beam size measurements of which (n = 59 independent measurements) yielded a ω2(×40)/ω2(×63) ratio of 2.28 ± 0.05. A similar ratio for τ(×40)/τ(×63) is expected for FrAp by lateral diffusion, whereas a τ ratio of 1 indicates recovery by exchange. The s.e.m. values of the τ ratios were calculated from the τ values shown in d, nuclear organelle (n = 40 for each objective), using bootstrap analysis (1,000 bootstrap resampling values). The τ(×40)/τ(×63) ratio (2.26) of GFp–TAZ in the large organelles is similar to the 2.28 beam size ratio (P = 0.44, Student’s two-tailed t-test), in line with FrAp by diffusion. Calculating D from the τ values yields D = 0.11 ± 0.01 μm2 s−1, with Rf = 0.65–0.75. τ of GFp–TAZ in the cytoplasm (d), measured using a ×40 objective, is more than tenfold smaller (faster diffusion, D = 1.5 ± 0.07 μm2 s−1). g, A fluorescence image of GFp–TAZ organelles in the nuclei (arrow) processed for whole-organelle bleach (150 ms) using a ×40 objective. The assay was repeated 40 times with similar images obtained. Scale bar, 10 μm. h, A typical FrAp curve of bleaching a whole small organelle. i,j, Average values (τ in i, mobile fraction in j) of FrAp (×40 objective) of whole organelles with a diameter of ~1.2 μm. Data are mean ± s.e.m. of n = 52 independent experiments. The τ and Rf values were very similar to those obtained by bleaching a spot on a large organelle (compare with d and e). On the basis of the estimated organelle diameter, the D value from these experiments is 0.12 μm2 s−1. Source data are available online.
Fig. 3 |
Fig. 3 |. The WW domain and CC domain are required for TAZ LLPS.
a, GFp–TAZ (WT), ΔTB, ΔWW, ΔCC and ΔWW+ΔCC proteins (50 μM) were analysed using droplet-formation assays at room temperature in the presence of 500 mM NaCl. right, quantification of the droplets. Scale bar, 10 μm. Data are mean ± s.e.m. Statistical significance was evaluated using one-way ANOVA with Krusk–Wallis test. Droplets in n = 3 fields in each group were quantified. b, Confocal microscopy images of MCF-10A cells transfected with GFPTAZ and various mutants (left). Scale bar, 10 μm. right, quantification of the percentage of cells that showed nuclear puncta. Insets, magnification by 3.84, 3.84, 3.57 and 3.84 times, respectively. Data are mean ± s.e.m. P values were determined using unpaired two-tailed Student’s t-tests; 80 transfected cells in each group were quantified; n = 3 biologically independent samples. c, HA-tagged WT or mutant TAZ was cotransfected into HEK293T cells together with Flag–TAZ. Dimerization of TAZ was analysed by immunoprecipitation (Ip) with anti-Flag antibodies and detected using western blotting (WB) with anti-HA antibodies (top). The abundance of these proteins in the cell lysates was assessed using western blotting (bottom). GApDH was used as a loading control. The experiments in ac were repeated independently three times with similar results. Source data are available online.
Fig. 4 |
Fig. 4 |. The differential ability of TAZ and YAP to undergo phase separation lies in the CC domain.
a, Domain structure of TAZ chimaeras. b, Coomassie blue staining of various recombinant proteins purified from Escherichia coli. c, Droplet formation by TAZ chimaeras using the same conditions as described in Fig. 3a. Scale bar, 10 μm. Quantification of the droplets is shown on the right. Data are mean ± s.e.m. Statistical significance was evaluated using one-way ANOVA with Krusk–Wallis test. Droplets in n = 3 fields in each group were quantified. d, Confocal microscopy images of MCF-10A cells transfected with various chimaeras as indicated. Scale bar, 10 μm. Insets, magnified by 2.94, 2.94, 2.94 and 3.12 times, respectively. right, quantification of the percentage of cells that displayed nuclear puncta. Data are mean ± s.e.m. P values were determined using unpaired two-tailed Student’s t-tests; 80 transfected cells in each group were quantified; n = 3 biologically independent samples. e, Flag-tagged WT TAZ or YAP was cotransfected into HEK293T cells together with HA-tagged TAZ mutants or YAP as indicated. Dimerization of TAZ or YAp was evaluated using immunoprecipitation with anti-Flag antibodies and detected using western blotting with anti-HA antibodies (top). The abundance of these proteins in the cell lysates was assessed using western blotting (bottom). GApDH was used as a loading control. The experiments in be were repeated independently three times with similar results. Source data are available online.
Fig. 5 |
Fig. 5 |. Hippo signalling negatively regulates TAZ phase separation.
a,b, MCF-10A cells were serum-starved for 16 h, treated with 10% FBS (a) or 1 μM LpA or 50 ng ml−1 EGF (b) for 1 h and then analysed using immunostaining with anti-TAZ (green) antibodies. For a and b, scale bars, 10 μm. Insets, magnification by 4.70 (a) and 3.07 (b) times. c, MCF-10A cells cultured at low or high density were analysed using immunostaining with anti-TAZ antibodies (green). Scale bar, 10 μm. Insets magnification by 4.48 and 5.83 times, respectively. d, Serum-starved MCF-10A cells were seeded on fibronectin-coated coverslips for 10 min and 2 h in serum-free medium and were then analysed using immunostaining with anti-TAZ antibodies (green) and Alexa-Fluor-555-conjugated phalloidin (red) for F-actin. Scale bar, 10 μm. Insets, magnification by 4.00 and 3.07 times, respectively. e, MCF-10A cells grown on fibronectin-coated polyacrylamide hydrogels with a stiffness of 1 kpa and 40 kpa were analysed using immunostaining with anti-TAZ antibodies (green) and Alexa-Fluor-555-conjugated phalloidin (red) for F-actin. Scale bar, 10 μm. Insets, magnification by 3.33 times. f, MCF-10A cells treated with 1 μg ml−1 latrunculin B (LatB) for 1 h were analysed using immunostaining with anti-TAZ antibodies (green) and Alexa-Fluor-555-conjugated phalloidin (red) for F-actin. Scale bar, 10 μm. Insets, magnification by 4.00 times. The experiments shown in af were repeated independently three times with similar results.
Fig. 6 |
Fig. 6 |. Hippo signalling negatively regulates TAZ phase separation through LATS2.
a, GFp–TAZ (green) was cotransfected with Flag-tagged WT LATS2, either alone or together with HAMST2, or with the kinase inactive LATS2KD in the absence of presence of 40 μM MG132 for 6 h. LATS2 localization was detected by immunofluorescence using anti-Flag antibodies (red). Scale bars, 10 μm. b, MCF-10A cells transfected with sirNA control (siCtrl) or sirNA targeting LATS1/2 (siLATS1/2) were analysed using western blotting (top). Localization of GFp–TAZ in these cells at high cell density was examined using confocal microscopy (bottom). Scale bar, 10 μm. c, GFp–TAZ (green) was cotransfected with WT HANDR1 or HANDR2, either alone or together with HAMST2. NDr1/2 localization was detected using immunofluorescence with anti-HA antibodies (red). Scale bars, 10 μm. d, In vitro phosphorylation and droplet formation. GFp–TAZ was phosphorylated in an in vitro kinase assay by WT or kinase-inactive LATS2 prepared from transfected HEK293T cells and analysed using a droplet-formation assay. phosphorylation of TAZ was detected by western blotting using antibodies specific for phosphorylated TAZ (bottom). Top, representative fluorescence and differential interference contrast images of the droplets. Scale bar, 10 μm. e, Confocal images of MCF-10A cells transfected with GFPTAZ or GFPTAZS89A. Scale bar, 10 μm. right, quantification of the percentage of cells that displayed nuclear puncta. Data are mean ± s.e.m. P values were determined using unpaired two-tailed Student’s t-tests; 80 transfected cells in each group were quantified; n = 3 biologically independent samples. The experiments in ae were repeated independently three times with similar results. Source data are available online.
Fig. 7 |
Fig. 7 |. TAZ compartmentalizes TeAD and other transcriptional factors to the nuclear puncta.
a, MycTEAD4 was cotransfected into MCF-10A cells together with GFP vector or WT or mutant GFPTAZ as indicated. TAZ and TEAD4 localization was monitored by GFp fluorescence and using immunofluorescence staining with anti-Myc antibodies (red), respectively. Scale bar, 10 μm. Insets, magnification by 2.96, 2.75, 2.75 and 2.75 times, respectively. b, In vitro droplet-formation assay. mCherry–TEAD4 (50 μM) either alone or mixed together with 50 μM WT GFp–TAZ or ΔWW+ΔCC was analysed using a droplet-formation assay under the same conditions as described in Fig. 3c. Scale bar, 10 μm. c, The ability of HA-tagged WT or mutant TAZ to interact with Flag–TEAD4 was examined using a co-immunoprecipitation assay with anti-Flag antibodies in the immunoprecipitation (Ip), followed by western blotting with anti-HA antibodies (top). The abundance of these proteins in the cell lysates was assessed using western blotting (bottom). d, Serum-starved MCF-10A cells transfected with MycTEAD4 and GFPTAZ were treated with 10% FBS for 1 h and processed for immunofluorescence staining using anti-Myc antibodies (red). Scale bar, 10 μm. Inset, magnification by 3.02 times. e, Colocalization of BrD4, MED1 or CDK9 with GFp–TAZ in the nuclear puncta in MCF-10A cells. Localization of endogenous BrD4, MED1 and CDK9 was detected by indirect immunofluorescence (red). Scale bars, 10 μm. Insets, magnification by 2.85 times. f, Colocalization of active rNA pol II with Flag–TAZ in the nuclear puncta in MCF-10A cells was detected using immunofluorescence staining with antibodies targeting either the active rNA pol II, which is phosphorylated at Ser 5 (S5p) or Ser 2 (S2p) in its CTD (red), or Flag (green). The images were captured using super-resolution structured illumination microscopy. Colocalization (yellow) was analysed using Imaris. Scale bar, 2 μm. g, Localization of active or repressive histone marks in MCF-10A cells expressing GFp–TAZ was analysed using immunofluorescence staining with anti-H3K4me3 or anti-H3K9me3 antibodies (red). The images were captured using super-resolution structured illumination microscopy. Colocalization (yellow) was analysed using Imaris. Scale bar, 2 μm. The experiments in ag were repeated independently three times with similar results. Source data are available online.
Fig. 8 |
Fig. 8 |. Phase separation of TAZ promotes transcription.
a,c, TAZ-dependent luciferase activity was measured in HEK293T cells expressing 8×GT-IIC-δ51LucII and various TAZ mutants (a) or TAZ–YAp chimaeras (c). Data are mean ± s.e.m. P values were determined using unpaired two-tailed Student’s t-tests; n = 4 biologically independent samples. b,d, Quantitative pCr with reverse transcription (rT–qpCr) analysis of CTGF and CYR61 mrNA expression in HEK293T cells transfected with various TAZ mutants (b) or TAZYAP chimaeras (d). Data are mean ± s.e.m. P values were determined using unpaired two-tailed Student’s t-tests; n = 3 biologically independent samples. e, Analysis of TAZ and YAp expression using western blotting in MDA-MB-231 cells with altered TAZ or YAp expression. GApDH was used as a loading control. f, Heat map summarizing genes that are significantly downregulated in TAZ KO cells, but not in YAp KO cells, using rNA-seq. Genes with the most-reduced expression are indicated in blue, and genes with the most-induced expression are indicated in red. The expression levels of downregulated genes in TAZ KO cells were restored in cells re-expressing Flag–TAZ but not Flag–TAZΔCC. The experiments in a and c were repeated independently four times with similar results. The experiments in b, d and e were repeated independently three times with similar results. Statistical analyses were calculated on the basis of the average numbers from these independent experiments. Source data are available online.

Comment in

References

    1. Pan D The Hippo signaling pathway in development and cancer. Dev. Cell 19, 491–505 (2010). - PMC - PubMed
    1. Ma S, Meng Z, Chen R & Guan KL The Hippo pathway: biology and pathophysiology. Annu. Rev. Biochem. 88, 577–604 (2018). - PubMed
    1. Tapon N & Harvey KF The Hippo pathway—from top to bottom and everything in between. Semin. Cell Dev. Biol. 23, 768–769 (2012). - PubMed
    1. Badouel C & McNeill H SnapShot: the Hippo signaling pathway. Cell 145, 484 (2011). - PubMed
    1. Schroeder MC & Halder G Regulation of the Hippo pathway by cell architecture and mechanical signals. Semin. Cell Dev. Biol. 23, 803–811 (2012). - PubMed

Publication types

MeSH terms