. 2020 Apr;52(4):371-377.
doi: 10.1038/s41588-020-0592-7. Epub 2020 Mar 23.

Genomic characterization of human brain metastases identifies drivers of metastatic lung adenocarcinoma

Affiliations

Genomic characterization of human brain metastases identifies drivers of metastatic lung adenocarcinoma

David J H Shih et al. Nat Genet. 2020 Apr.

Abstract

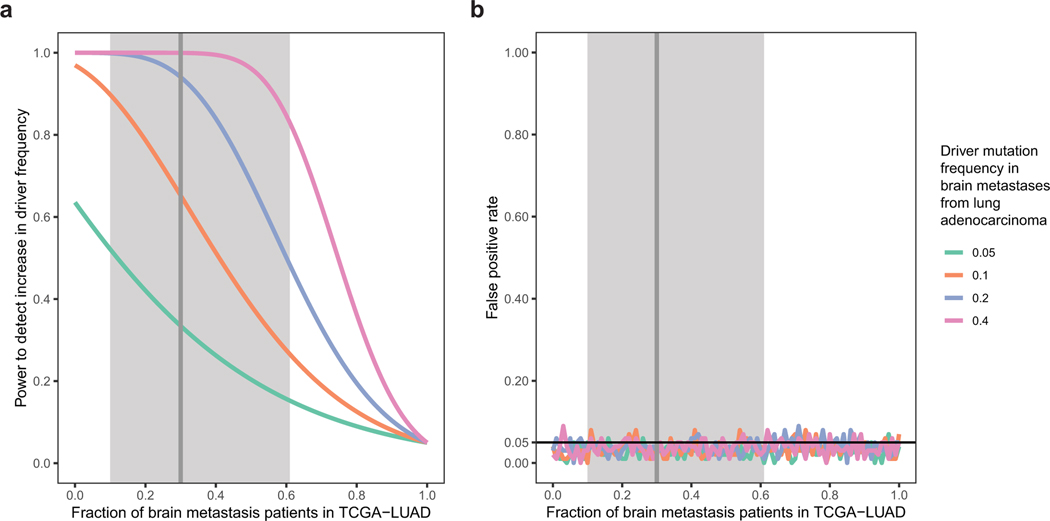
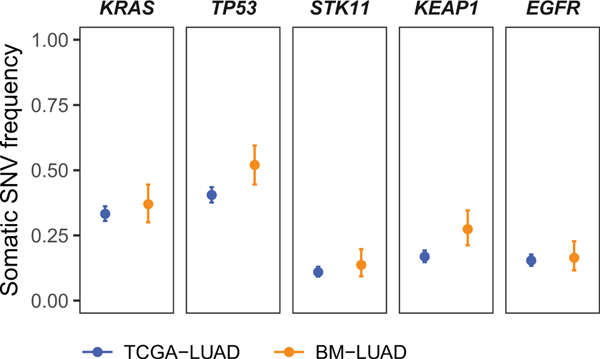
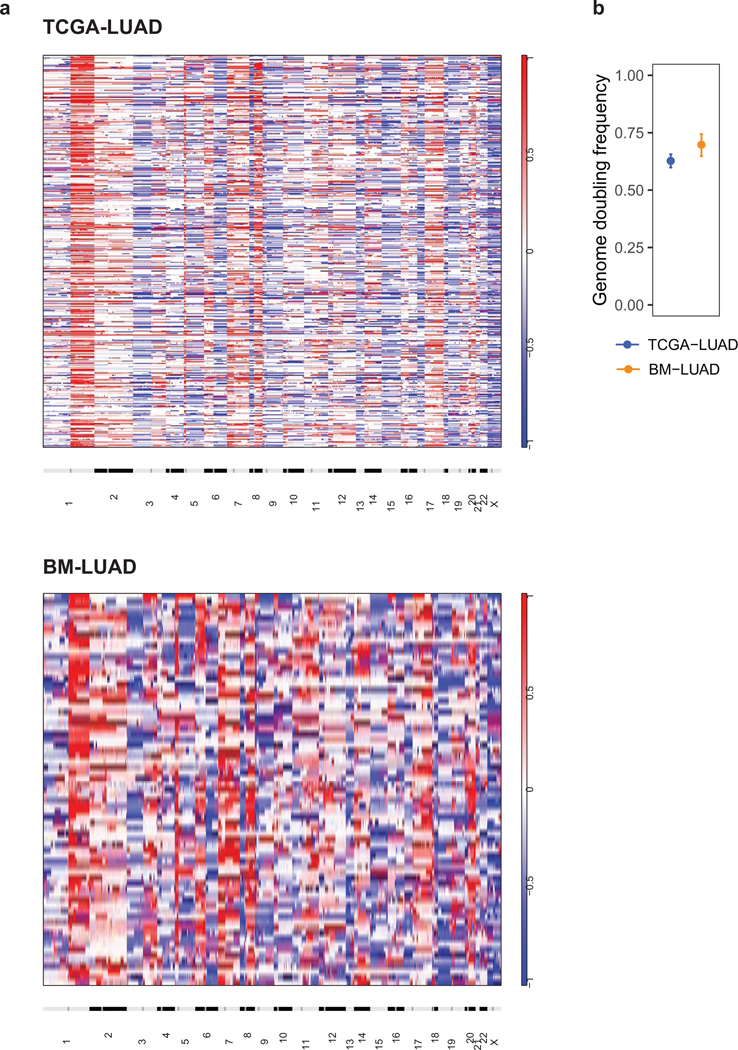
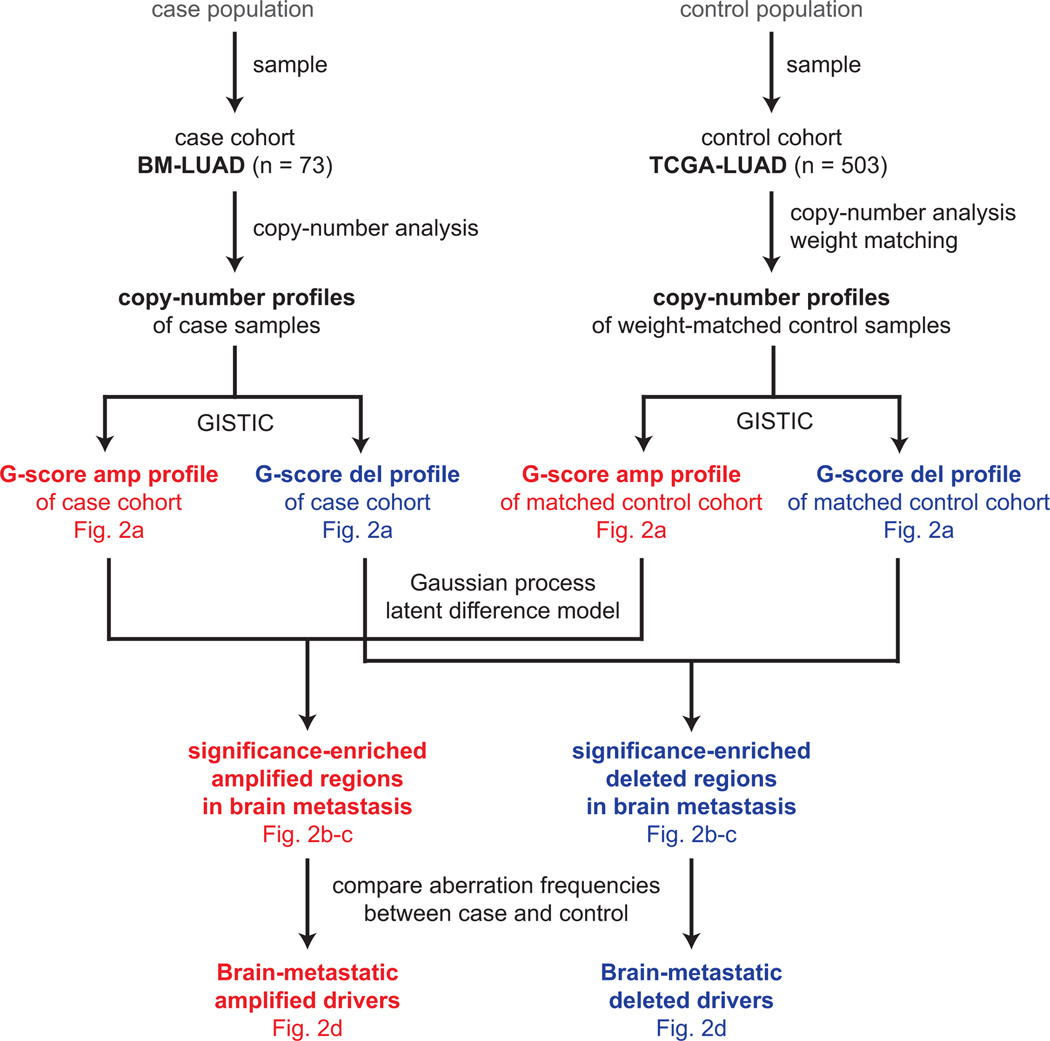
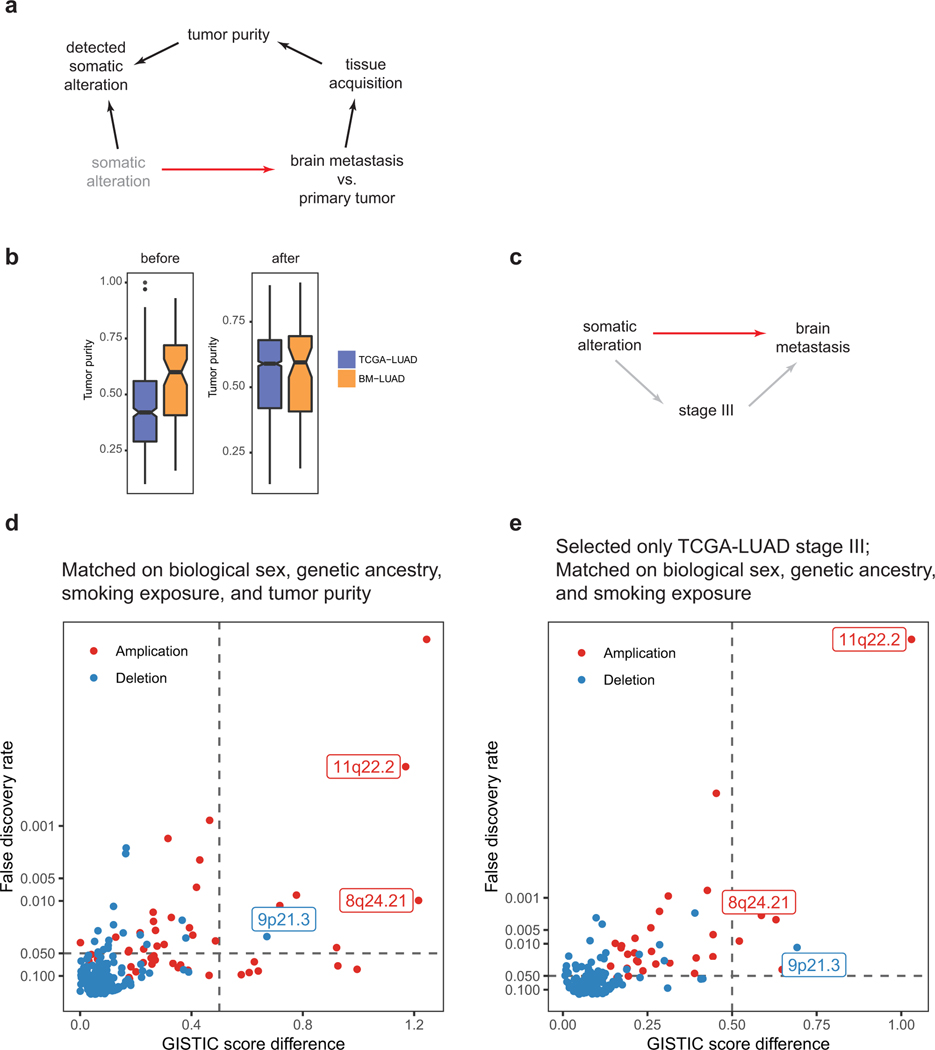
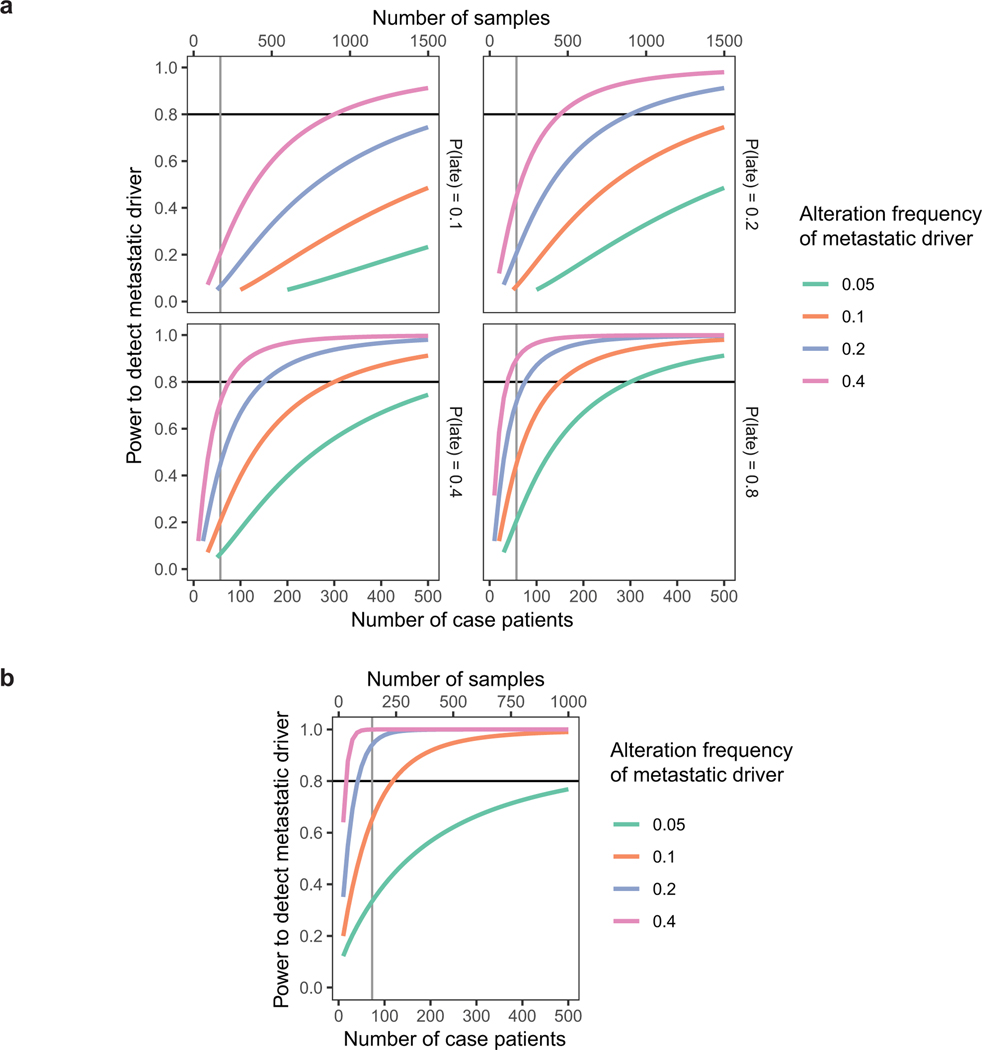
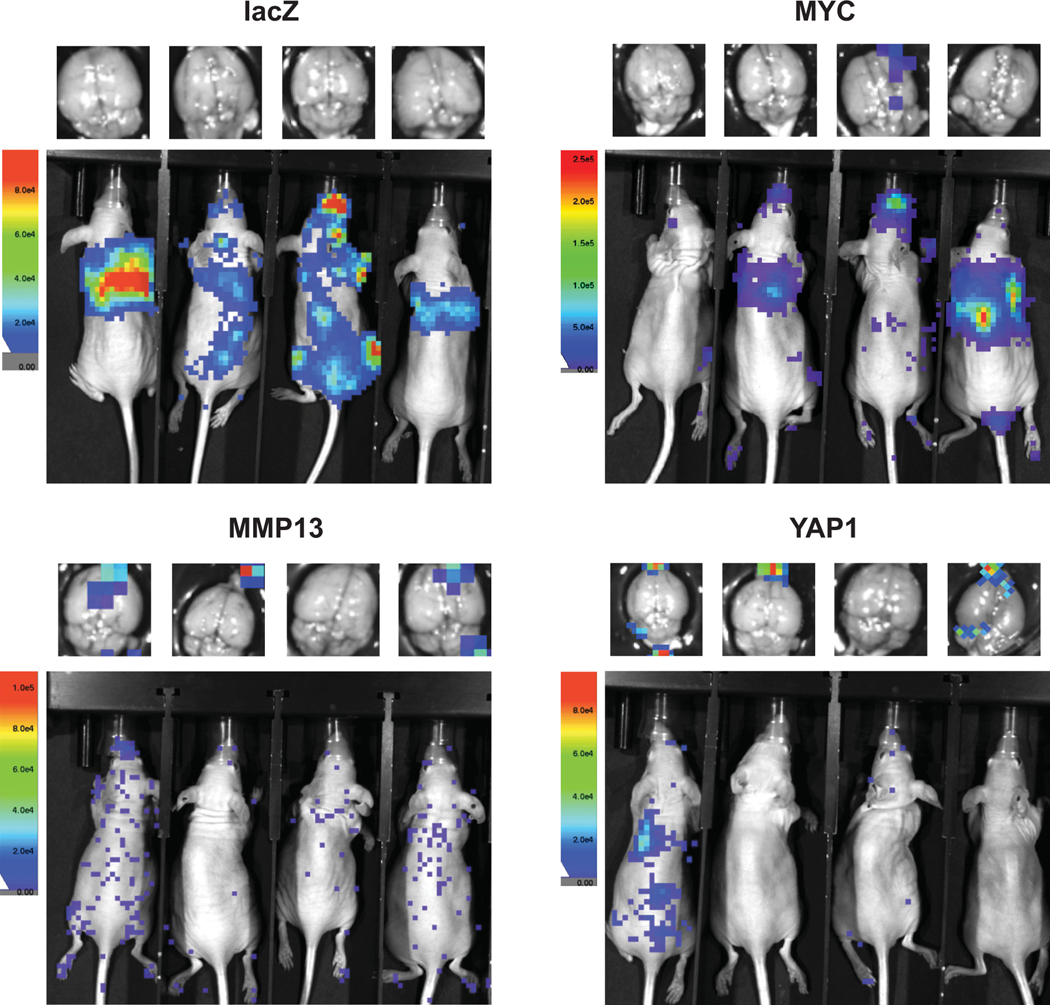
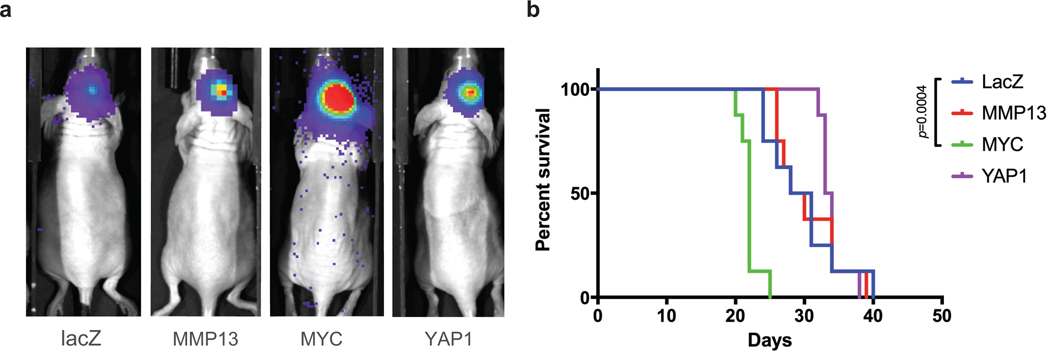
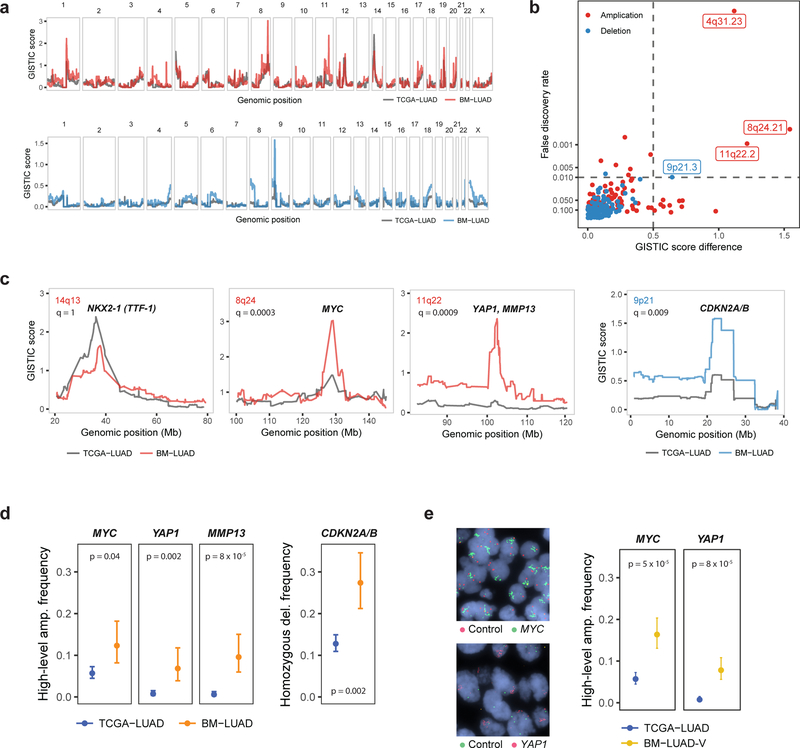
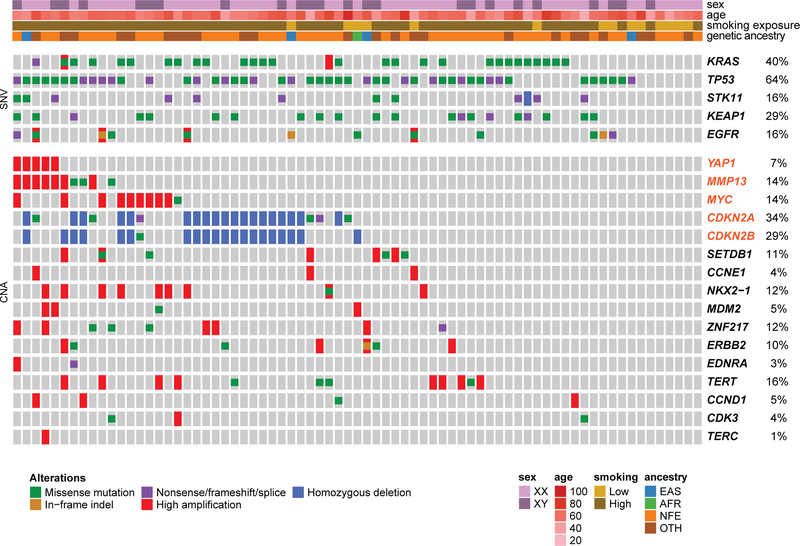
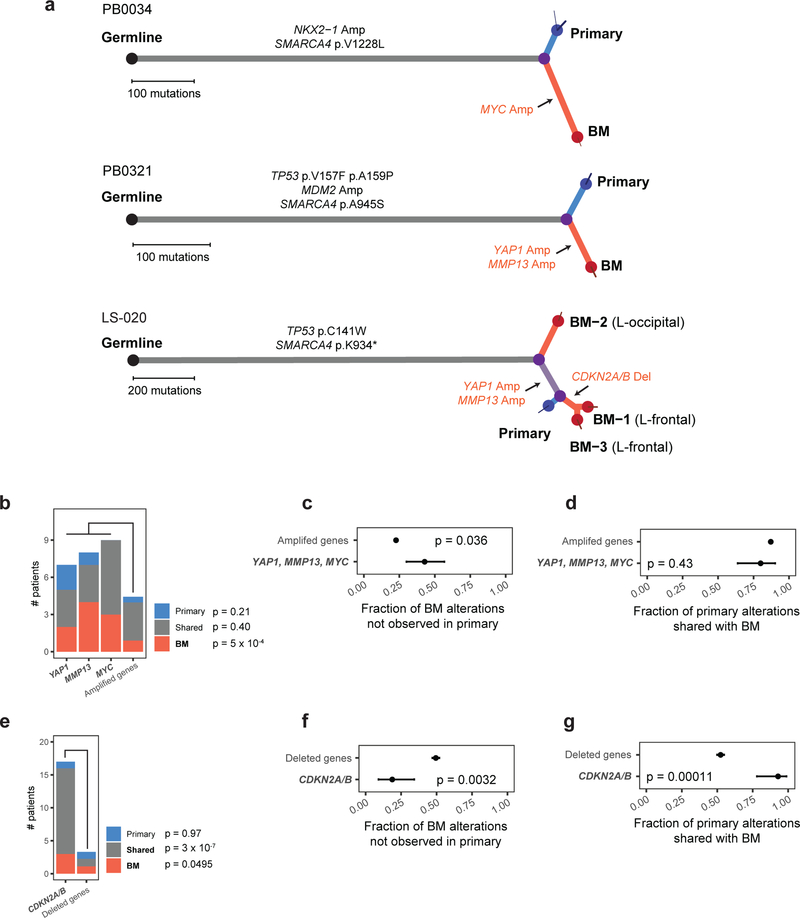
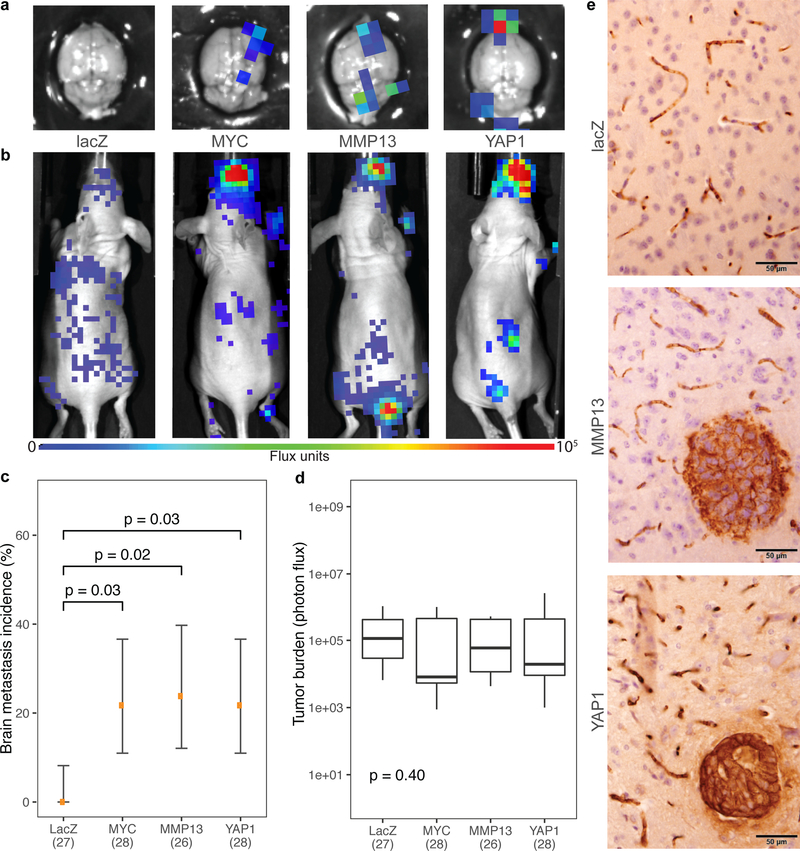
Brain metastases from lung adenocarcinoma (BM-LUAD) frequently cause patient mortality. To identify genomic alterations that promote brain metastases, we performed whole-exome sequencing of 73 BM-LUAD cases. Using case-control analyses, we discovered candidate drivers of brain metastasis by identifying genes with more frequent copy-number aberrations in BM-LUAD compared to 503 primary LUADs. We identified three regions with significantly higher amplification frequencies in BM-LUAD, including MYC (12 versus 6%), YAP1 (7 versus 0.8%) and MMP13 (10 versus 0.6%), and significantly more frequent deletions in CDKN2A/B (27 versus 13%). We confirmed that the amplification frequencies of MYC, YAP1 and MMP13 were elevated in an independent cohort of 105 patients with BM-LUAD. Functional assessment in patient-derived xenograft mouse models validated the notion that MYC, YAP1 or MMP13 overexpression increased the incidence of brain metastasis. These results demonstrate that somatic alterations contribute to brain metastases and that genomic sequencing of a sufficient number of metastatic tumors can reveal previously unknown metastatic drivers.


Figures

Extended Data Fig. 1
Power analysis and statistical simulation of case-control study. a, Estimated effect of increasing fraction of brain metastasis patients in TCGA-LUAD on statistical power to detect metastatic drivers at different mutation frequency levels in BM-LUAD. The driver mutation frequency is assumed to be 1% among TCGA-LUAD patients who do not develop brain metastasis (true controls). Power is calculated for testing an increase in driver mutation frequency among cases compared to controls at a significance level of 0.05. Observations are assumed to be independent and identically distributed. b, Simulated effect of increasing fraction of brain metastasis patients in TCGA-LUAD on false positive rate for detecting metastatic drivers at different mutation frequency levels. Each data point represents a simulation of 100 experiments under the null hypothesis (i.e. the mutation frequency among patients who never develop brain metastasis is equal to the mutation frequency among brain metastasis patients). Significance level is set to 0.05. Vertical line represents the estimated fraction of brain metastasis patients in TCGA-LUAD, and shaded region represents the 95% confidence interval, as determined using a mixed effect meta-analysis binomial regression accounting for immunohistological subtype, TNM stage, EGFR mutation status, race, smoking status, gender, and age under an errors-in-variables model to allow for missing or uncertain data.
Extended Data Fig. 2
Power analysis and statistical simulation of case-control study. a, Proposed causal model for brain metastasis. Red arrow denotes main causal relationship of interest; black arrows, well-supported relationships; gray arrows, uncertain relationships. Relationship between TNM stage and brain metastasis is bidirectional: brain metastasis at diagnosis is defined as stage IV, and node involvement contributes to metastasis. b, Coarsened exacting matching weights, determined based on biological sex, genetic ancestry, and smoking exposure. c, Distributions of confounding covariates before exact matching. d, Distributions of confounding covariates after exact matching. e, Distributions of TNM stage and age at primary diagnosis before exact matching and f, after. TNM stage and age were not included in exact matching, and their distributions remain similar after exact matching. AFR, African or African American. EAS, East Asian. NFE, Non-Finnish European. SAS, South Asian. AMR, Latino. FIN, Finnish. OTH, Other.
Extended Data Fig. 3
Power analysis and statistical simulation of case-control study. Single nucleotide variants (SNVs) and short insertions/deletions (indels) in BM-LUAD were analyzed by MutSig2CV and dNdScv to identify driver genes under positive selection. Identified drivers are statistically significant by both MutSig2CV and dNdScv at 1% false discovery rate, except for EGFR, which harbors recurrent indels that are considered only by MutSig2CV. The mutation frequencies of the identified drivers are shown for BM-LUAD and TCGA-LUAD after matching adjustment by coarsened exact matching, and statistical significances of differences in mutation frequency were assessed by weighted logistic regression using the matching weights. None of the identified drivers were statistically significantly different between BM-LUAD and TCGA-LUAD at 0.05 significance level with Benjamini-Hochberg multiple hypothesis correction.
Extended Data Fig. 4
Power analysis and statistical simulation of case-control study. a, Heatmap of copy-number profiles for samples from TCGA-LUAD (top) and BM-LUAD (bottom). Each row represents the copy-number profile of a tumor sample across chromosomes 1 to 22 and X. Red indicates copy-number gain; blue, loss. b, Frequencies of genome doubling events in TCGA-LUAD and BM-LUAD.
Extended Data Fig. 5
Power analysis and statistical simulation of case-control study. CNAs Somatic copy-number profiles in case cohort (BM-LUAD) and weight-matched control cohort (TCGA-LUAD) were analyzed by GISTIC. Copy-number profiles of control samples were multiplied by matching weights, which were defined to balance covariate distributions between case and control cohorts using the coarsened exact matching method. G-score profiles for amplifications and deletions were independently analyzed by a Gaussian process latent difference model to identify significantly enriched regions. Candidate drivers were identified by logistic regression comparing aberration frequencies between case and weighted controls; the candidates were further validated in an independent cohort by fluorescence in situ hybridization.
Extended Data Fig. 6
Power analysis and statistical simulation of case-control study. Dot plot of frequencies of copy-number events and tumor purity in BM-LUAD (a) and TCGA-LUAD (b). Correlations are measured by Kendall rank correlation coefficient. Blue curves represent LOESS regressions. High-level amplification, > 8 total copy-number; Deep deletion, < 0.5 total copy-number; Gain, > 3/2 normalized copy-ratio; Loss, < ½ normalized copy-ratio. Normalized copy-ratio is total copy-number scaled to tumor ploidy.
Extended Data Fig. 7
Power analysis and statistical simulation of case-control study. a, Proposed causal model for sample-level covariates involving tumor purity. Red arrow denotes main causal relationship of interest; black arrows, well-supported relationships; gray arrows, uncertain relationships. “Somatic alteration” (shown in gray) is not directly observable. In contrast, “detected somatic alterations” is directly observable. Observing “detected somatic alterations” (which is a collider) introduces a backdoor path from “somatic alteration” to “brain metastasis”, and this path may be closed by controlling for tumor purity. b, Distributions of tumor purity in TCGA-LUAD and BM-LUAD before and after exact matching on biological sex, genetic ancestry, smoking exposure, and tumor purity. c, Proposed causal model for patient-level covariates including stage. Stage III is a likely mediator variable that may be controlled in order to assess the direct effects of somatic alterations on incidence of brain metastasis. d, Differentially amplified or deleted regions in BM-LUAD compared to TCGA-LUAD after additionally matching on tumor purity. Differential regions of interest are labeled. e, Differentially amplified or deleted regions in BM-LUAD compared to stage III samples in TCGA-LUAD.
Extended Data Fig. 8
Power analysis and statistical simulation of case-control study. a, Estimated powers to detect metastatic driver under a matched-pairs primary-metastasis comparison study. Levels of driver alteration frequency among cases are shown in different line colors. Various probabilities of driver alteration occurring late during metastatic progression (see Fig. 3) are considered in separate subplots. Power is calculated for Poisson regression comparing absolute frequencies of late driver alterations against frequencies of late background alterations (which was estimated to be 1.0 from recurrently altered genes). Observations are assumed to be independent and identically distributed. Each case patient requires the processing of 3 samples (brain metastasis, matched primary tumor, and matched germline). b, Estimated powers to detect metastatic driver under a case-control study. Levels of driver alteration frequency among cases are shown in different line colors. The driver alteration frequency is assumed to be 1% among TCGA-LUAD patients who do not develop brain metastasis (true controls). Power analysis corrects for the estimated 30% incidence of brain metastasis among TCGA-LUAD patients (cases-in-controls contamination). Each case patient requires the analysis of 2 samples (brain metastasis and germline). Significance level is set to 0.05. Vertical line represents the realized sample size.
Extended Data Fig. 9
Power analysis and statistical simulation of case-control study. Representative in vivo and ex vivo brain bioluminescence images taken 12 days after intracardiac injections with tumor cells overexpressing lacZ, MYC, MMP13, or YAP1
Extended Data Fig. 10
Power analysis and statistical simulation of case-control study. a, Representative in vivo bioluminescence images of xenograft mouse model 14 days post intracranial injections of 1 x 10⁴ tumor cells overexpressing lacZ, MYC, MMP13, or YAP1. b, Overall mouse survival following intracranial injections of tumor cells. Median survival of the lacZ control group (29.5 days; n = 8) was compared against those of the other groups by the log-rank test: MYC (22 days; n = 8, p = 0.0004), MMP13 (29 days; n = 8, not significant), or YAP1 (33.5 days; n = 8, not significant).
Fig. 1:
Fig. 1:. Novel candidate brain-metastatic drivers targeted by amplifications or deletions.
a, GISTIC amplification (top) and deletion (bottom) plots of BM-LUAD (n = 73) and matched samples in TCGA-LUAD (n = 464) cohorts. b, Differentially amplified or deleted regions in BM-LUAD compared to TCGA-LUAD. Significant differential regions are labeled (FDR < 0.01, and G-score difference > 0.5). c, GISTIC plots of control region (NKX2–1) and candidate metastatic driver regions. d, Frequencies of amplifications or deletions of candidate metastatic drivers, adjusted by matching weights to control for confounding. Error bars denote 80% confidence intervals. Significance was assessed by weighted logistic regression. e, Frequencies of amplifications of MYC and YAP1 in validation cohort BM-LUAD-V (n = 105) as determined by fluorescence in situ hybridization. TCGA-LUAD was re-used as the control cohort.
Fig. 2:
Fig. 2:. Co-mutation plot from whole exome sequencing of brain metastasis patients.
Significantly recurrently mutated drivers identified by both MutSig2CV and dNdScv in BM-LUAD are shown, followed by significantly amplified or deleted drivers identified using GISTIC in BM-LUAD, along with additional known cancer drivers in lung adenocarcinoma. Genes highlighted in orange are candidate metastatic drivers identified by matched case-control comparison between BM-LUAD and TCGA-LUAD. Each column represents one brain metastasis. False discovery rates are controlled at 1%.
Fig. 3:
Fig. 3:. Phylogenetic analysis of copy-number drivers in brain metastasis and matched primary tumors.
a, Somatic mutations in BM-LUAD cases bearing candidate drivers, depicted as phylogenetic trees. Branch lengths are proportional to the number of somatic point-mutations incurred along each lineage. Thin terminal branches indicate subclones with estimated cancer cell fraction less than 1.0 in the indicated sample. Somatic alterations in genes considered significantly recurrently mutated in TCGA-LUAD by CNA or mutation are annotated in black on the indicted phylogenetic branch. Somatic amplification and deletion of proposed candidate driver genes are indicated in red. b, Frequency of high-level amplifications that were private to the primary tumor, private to brain metastasis, or shared. The ‘other amplified gene’ column represents the average number of samples the other recurrently amplified genes were amplified in. Significance was determined using Poisson regression and Wald test. c, Fraction of high-level amplifications in brain metastases that were not detected in paired primary tumors. Significance was determined using Fisher’s exact test. Error bars represent 80% confidence intervals. d, Fraction of high-level amplifications in primary-tumor samples that were also detected in paired brain metastases. Significance was determined using Fisher’s exact test. Error bars represent 80% confidence intervals. e, Frequencies of deletions that were private to the primary tumor, private to brain metastasis, or shared. The ‘other deleted gene’ column represents the average number of samples the other recurrently deleted genes were deleted in. Significance was determined using Poisson regression and Wald test. f, Fraction of deletions in brain metastases that were not detected in their paired primary tumors. Significance was determined using Fisher’s exact test. Error bars represent 80% confidence intervals. g, Fraction of deletions in primary-tumor samples that were also detected in paired brain metastases. Significance was determined using Fisher’s exact test. Error bars represent 80% confidence intervals.
Fig. 4:
Fig. 4:. Functional validation of brain-metastatic drivers in a patient-derived xenograft model.
a, Representative ex vivo and b, in vivo bioluminescence images 12 days after intracardiac injections with LN-001 tumor cells. c, Incidence of brain metastasis 12 days after intracardiac injections of LN-001 tumor cells overexpressing lacZ (n = 27), MYC (n = 28), MMP13 (n = 26), or YAP1 (n = 28). Error bars denote 80% confidence intervals. Data were aggregated over 3 independent experiments. Significances were assessed by Fisher’s exact tests. d, Overall tumor burden following intracardiac injection. Box represents interquartile range; middle line represents median; limits mark the extremes. Significance was assessed by the Kruskal-Wallis rank sum test. e, Representative images of mouse brain sections stained for human keratin, showing presence of brain metastases 12 days after intracardiac injections of LN-001 tumor cells.

Comment in

References

    1. Cagney DN et al. Incidence and prognosis of patients with brain metastases at diagnosis of systemic malignancy: a population-based study. Neuro-oncology 19, 15111521, doi:10.1093/neuonc/nox077 (2017). - DOI - PMC - PubMed
    1. Massague J. & Obenauf AC Metastatic colonization by circulating tumour cells. Nature 529, 298–306, doi:10.1038/nature17038 (2016). - DOI - PMC - PubMed
    1. Steeg PS Tumor metastasis: mechanistic insights and clinical challenges. Nature medicine 12, 895–904, doi:10.1038/nm1469 (2006). - DOI - PubMed
    1. Martin JD, Fukumura D, Duda DG, Boucher Y. & Jain RK Reengineering the Tumor Microenvironment to Alleviate Hypoxia and Overcome Cancer Heterogeneity. Cold Spring Harbor perspectives in medicine 6, doi:10.1101/cshperspect.a027094 (2016). - DOI - PMC - PubMed
    1. Brastianos PK et al. Genomic Characterization of Brain Metastases Reveals Branched Evolution and Potential Therapeutic Targets. Cancer discovery 5, 1164–1177, doi:10.1158/2159-8290.CD-15-0369 (2015). - DOI - PMC - PubMed

Publication types

MeSH terms

Substances