. 2020 Apr;52(4):378-387.
doi: 10.1038/s41588-020-0595-4. Epub 2020 Mar 23.

DNA methylation disruption reshapes the hematopoietic differentiation landscape

Affiliations

DNA methylation disruption reshapes the hematopoietic differentiation landscape

Franco Izzo et al. Nat Genet. 2020 Apr.

Abstract

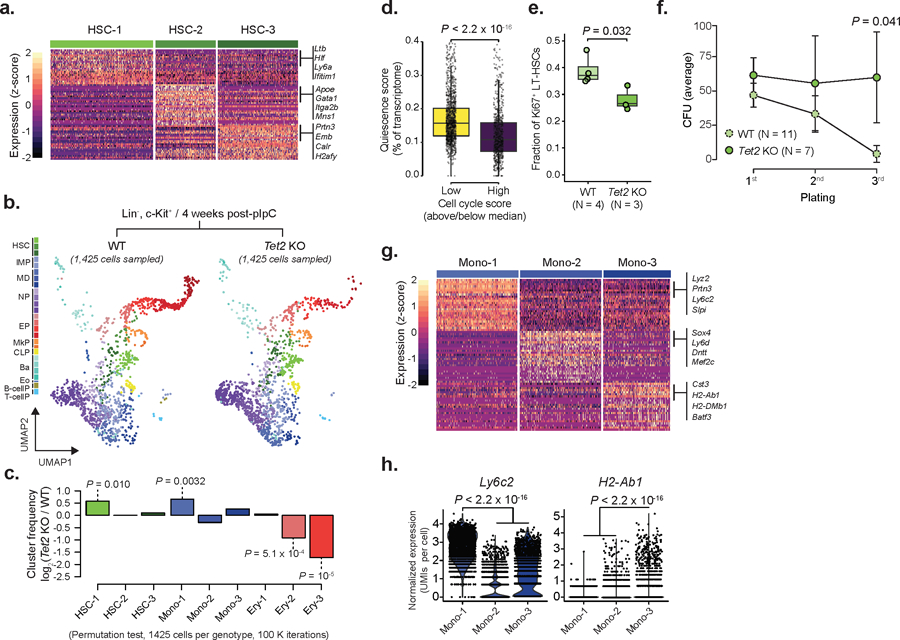
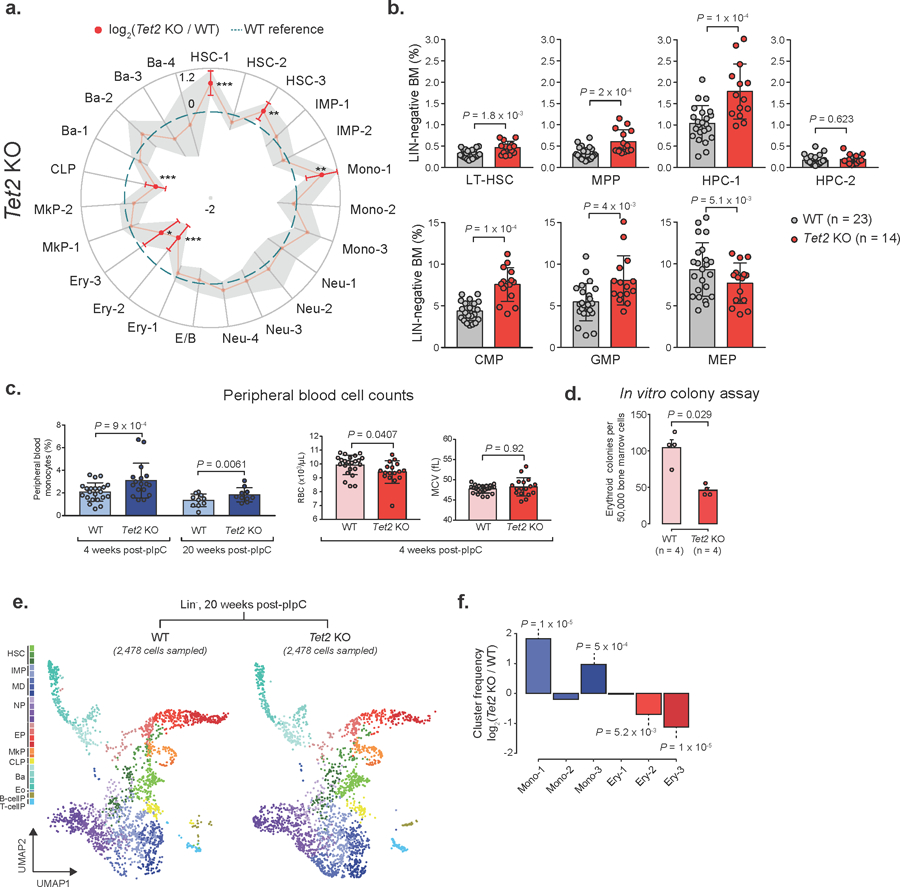
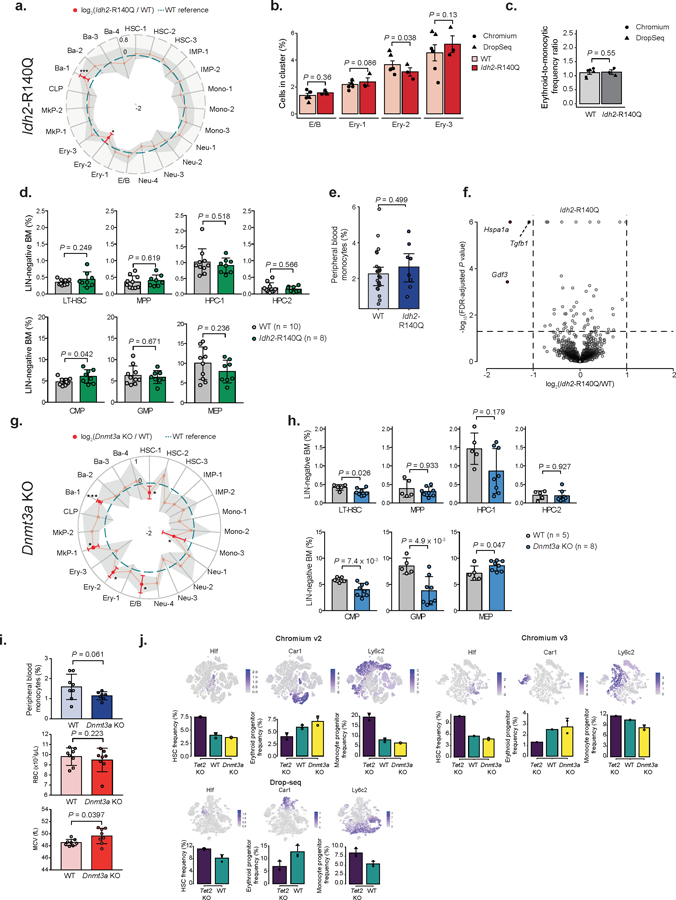
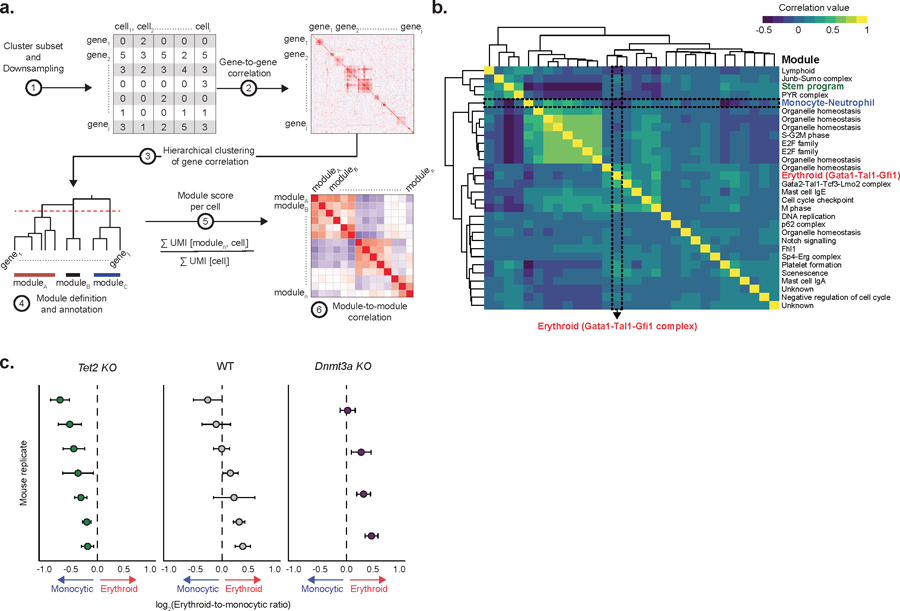
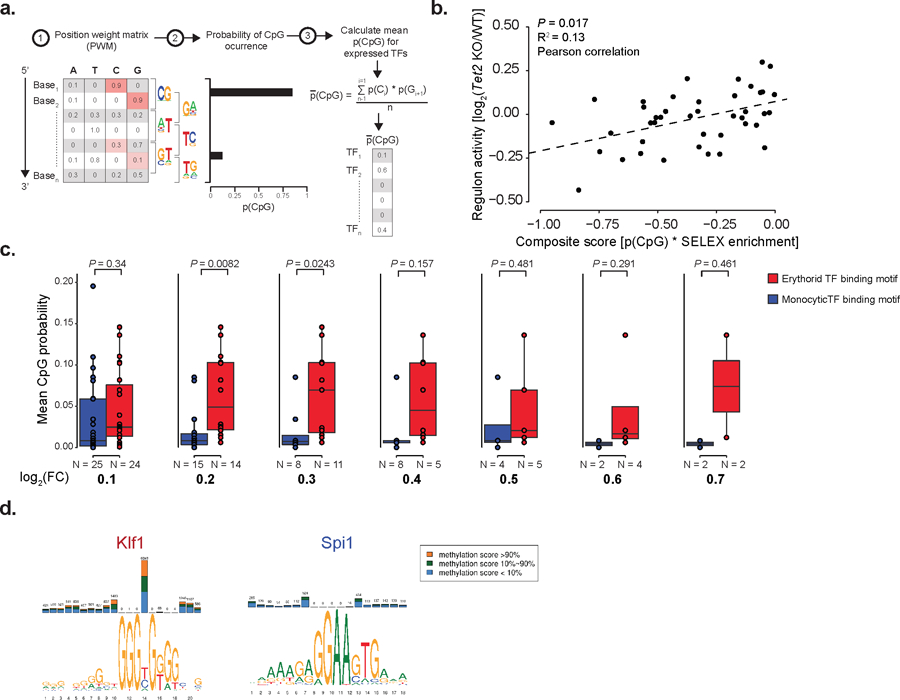
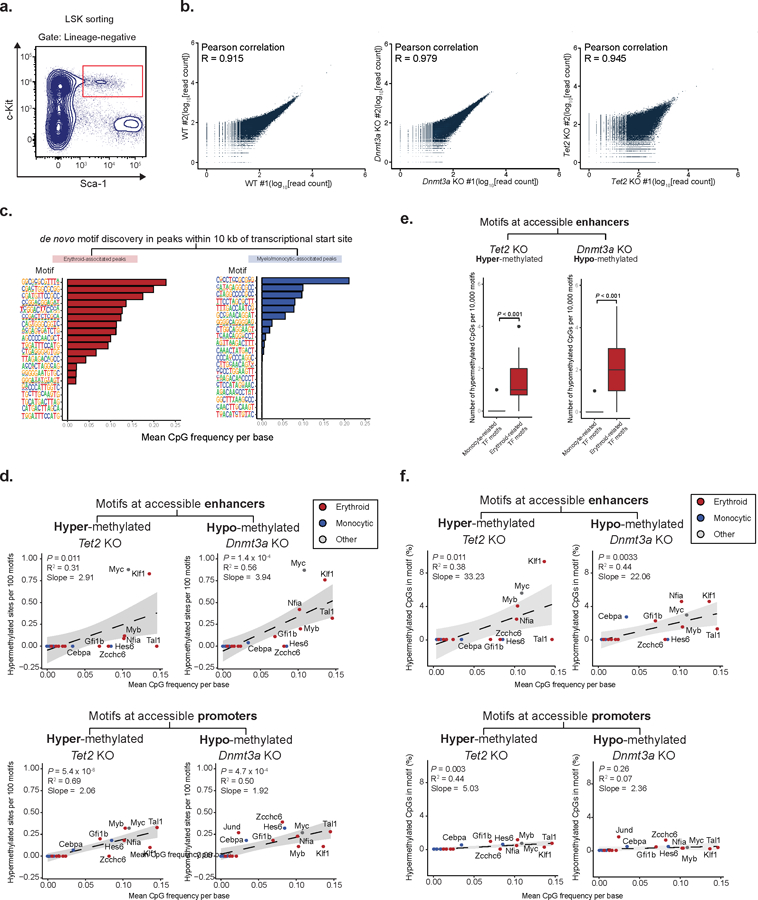
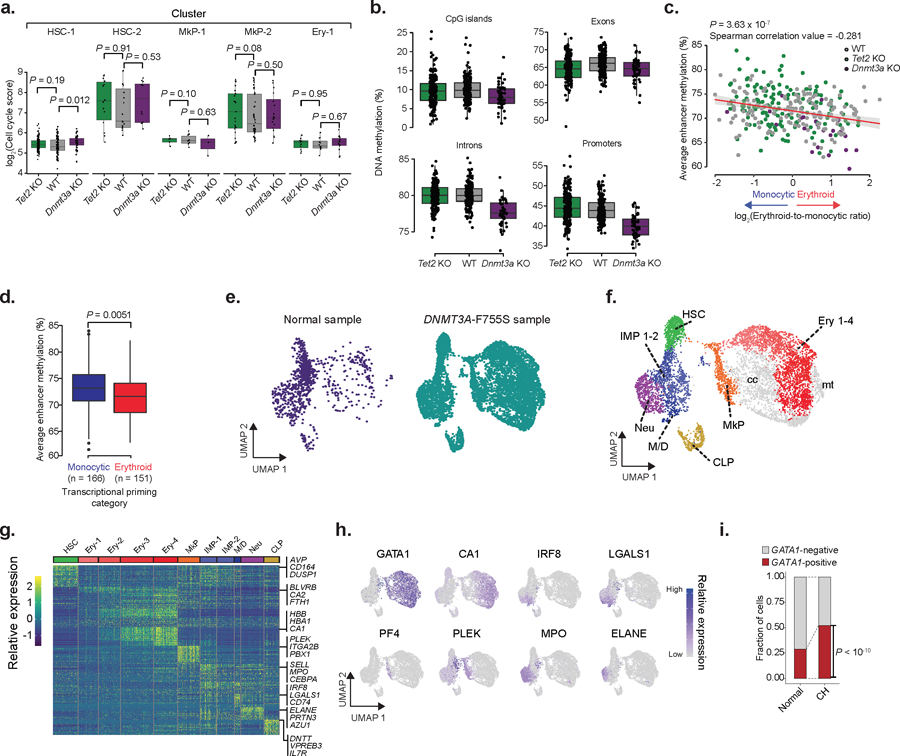
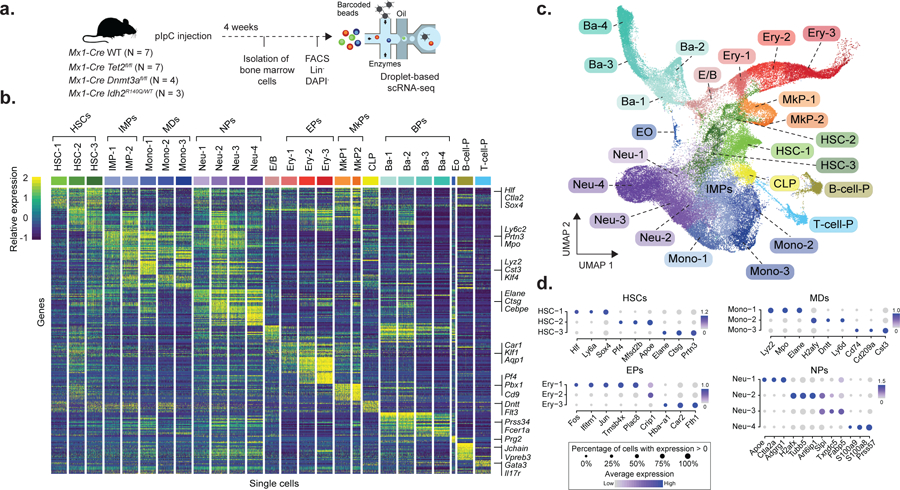
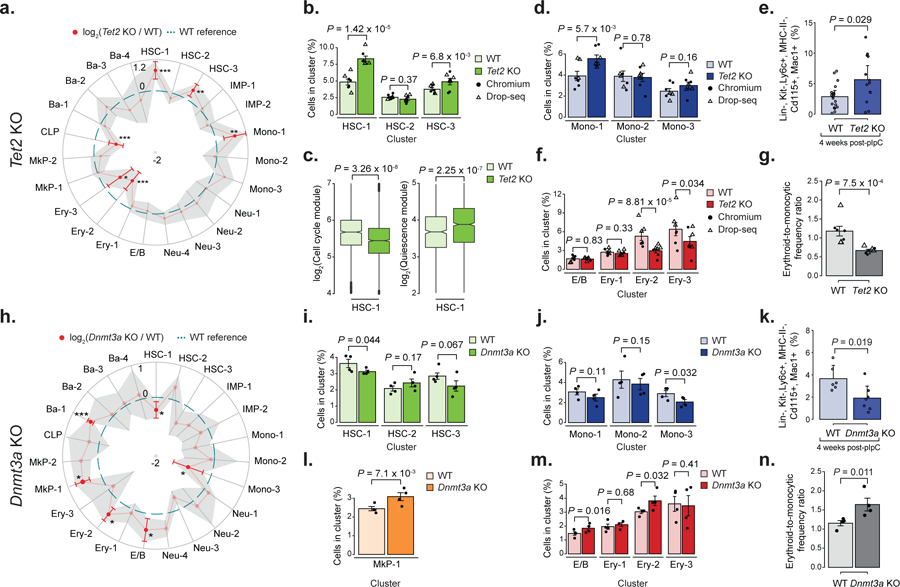
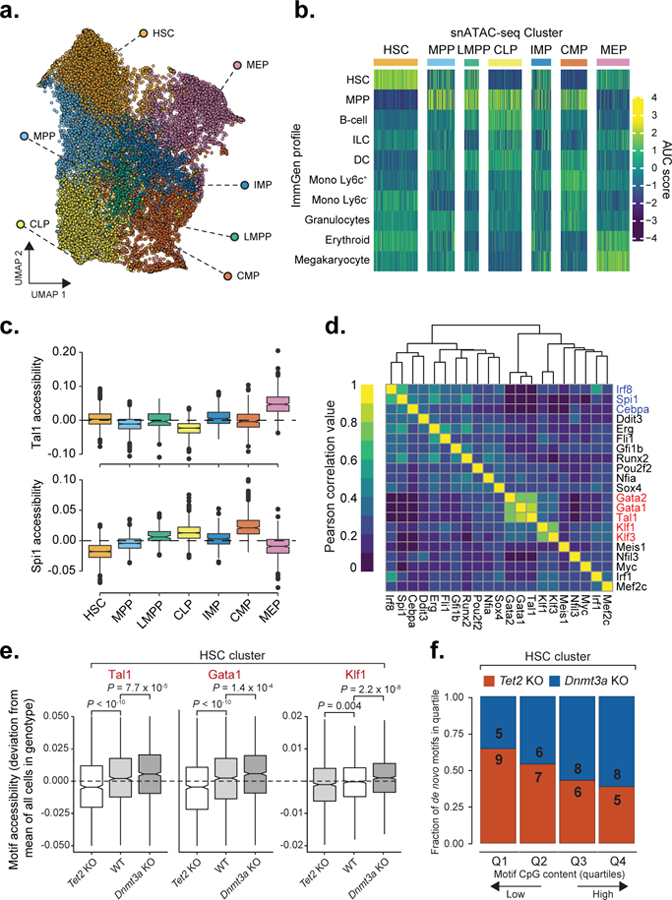
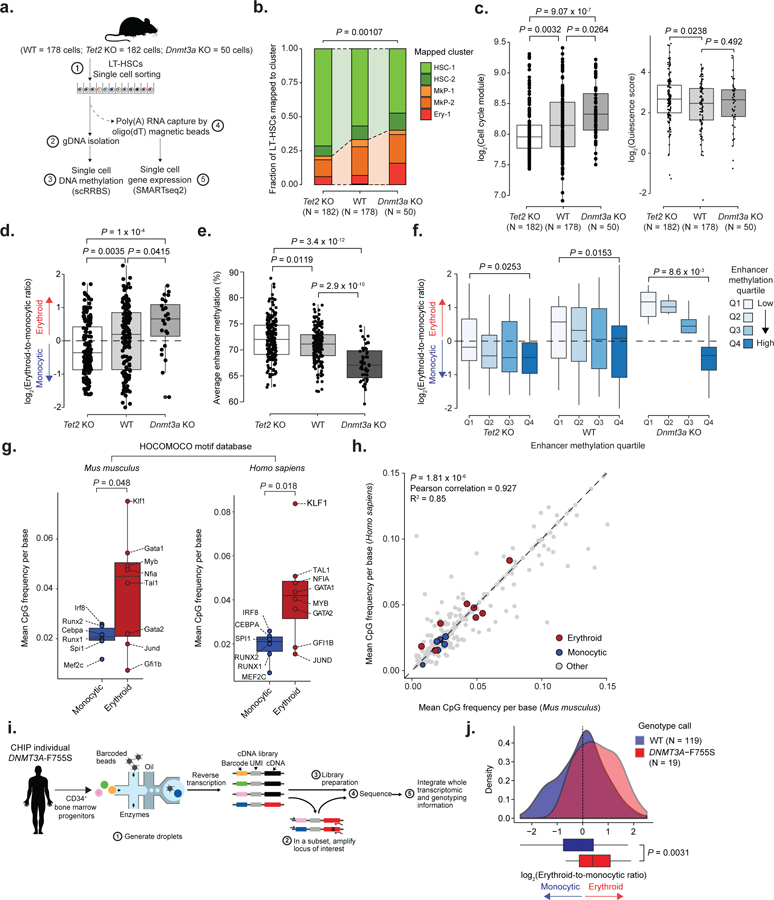
Mutations in genes involved in DNA methylation (DNAme; for example, TET2 and DNMT3A) are frequently observed in hematological malignancies1-3 and clonal hematopoiesis4,5. Applying single-cell sequencing to murine hematopoietic stem and progenitor cells, we observed that these mutations disrupt hematopoietic differentiation, causing opposite shifts in the frequencies of erythroid versus myelomonocytic progenitors following Tet2 or Dnmt3a loss. Notably, these shifts trace back to transcriptional priming skews in uncommitted hematopoietic stem cells. To reconcile genome-wide DNAme changes with specific erythroid versus myelomonocytic skews, we provide evidence in support of differential sensitivity of transcription factors due to biases in CpG enrichment in their binding motif. Single-cell transcriptomes with targeted genotyping showed similar skews in transcriptional priming of DNMT3A-mutated human clonal hematopoiesis bone marrow progenitors. These data show that DNAme shapes the topography of hematopoietic differentiation, and support a model in which genome-wide methylation changes are transduced to differentiation skews through biases in CpG enrichment of the transcription factor binding motif.


Conflict of interest statement

Competing interests

OA-W has served as a consultant for H3B Biomedicine, Foundation Medicine Inc, Merck, and Janssen, and is on the Scientific Advisory Board of Envisagenics Inc; OA-W has received prior research funding from H3B Biomedicine unrelated to the current manuscript. R.L.L. is on the supervisory board of Qiagen and is a scientific advisor to Loxo (until 2/2019), Imago, C4 Therapeutics and Isoplexis, which each include an equity interest. He receives research support from and consulted for Celgene and Roche, he has received research support from Prelude Therapeutics, and he has consulted for Lilly, Incyte, Novartis, Astellas, Morphosys and Janssen. He has received honoraria from Lilly and Amgen for invited lectures and from Gilead for grant reviews.

Figures

Extended Data Fig. 1
Extended Data Fig. 1. Chromium 10x data summary
a) Summary of Chromium 10x data (pIpC = polyinosinic-polycytadylic acid). b) Number of genes detected as a function of the number of unique molecular identifiers (UMIs) per cell barcode. Red dots = cell barcodes with mitochondrial content > 20%; blue dots = cell barcode with lower than expected complexity (lower than two standard deviations from linear fit); dashed red line = linear fit. c) Percentage of cell barcodes removed per sample after filtering low complexity barcodes and barcodes with mitochondrial UMIs > 20%. d) Quality control of scRNA-seq (n = 13 biological independent animals) after filtering. e) PCR validation of Tet2 exon 3 deletion 4 weeks after pIpC administration. Genomic DNA was isolated from Lin bone marrow cells and amplified using the primers Tet2-F1, Tet2-R1 or Tet2-R-Lox, (Supplementary Table 5). One representative example of n = 3 independent experiments is shown. f) PCR validation of Dnmt3a exon 17 and 18 deletion 4 weeks after pIpC administration. Genomic DNA was isolated from Lin bone marrow cells and amplified using the primers Dnmt3a-F1, Dnmt3a-R1 or Dnmt3a-R-Lox, shown in Supplementary Table 5. One representative example of n = 3 independent experiments is shown. g) Uniform Manifold Approximation and Projection (UMAP) dimensionality reduction showing joint embedding of WT (17,702 cells; n = 7 mice), Tet2 KO (18,651 cells; n = 7 mice), Dnmt3a KO (13,858 cells, n = 4 mice) and Idh2-R140Q (9,883 cells, n = 3 mice).
Extended Data Fig. 2
Extended Data Fig. 2. Drop-seq data summary
a) Summary of Drop-seq data showing PCR pool, genotype, sorting strategy, time after recombination (n = 14 biologically independent animals) and number of cells captured after filtering (pIpC = polyinosinic-polycytadylic acid). b) Number of unique molecular identifiers (UMIs) and genes detected per cell barcode per sample. c) Overview of number of genes detected as a function of the number of UMIs per cell barcode. Red dots = cell barcodes with mitochondrial content > 20%; blue dots = cell barcode with lower than expected complexity (lower than two standard deviations from linear fit); dashed red line = linear fit. d) Percentage of cell barcodes removed per sample (n = 14 biologically independent animals) after filtering out low complexity barcodes and barcodes with mitochondrial UMIs > 20%. e) Percentage of mitochondrial UMIs per cell per sample (n = 14 biologically independent animals) after filtering.
Extended Data Fig. 3
Extended Data Fig. 3. Quality control of joint embedding across single cell technologies
a) Left panel: Uniform Manifold Approximation and Projection (UMAP) dimensionality reduction showing joint embedding of WT (17,702 cells; n = 7 mice), Tet2 KO (18,651 cells; n = 7 mice), Dnmt3a KO (13,858 cells, n = 4 mice) and Idh2-R140Q (9,883 cells, n = 3 mice) lineage-negative hematopoietic progenitors. Right panels: UMAP embedding obtained for each scRNA-seq method is shown separately. b) Gene expression correlation between cells obtained by different scRNA-seq methods (Chromium v2, Chromium v3 and Drop-seq) that were mapped to the same cell cluster. The gene expression frequency was calculated as the number of unique molecular identifiers (UMIs) mapping to a given gene relative to the total number of UMIs detected for a given cluster, and multiplied by a factor of 105. The log2 of the pseudo-bulk gene expression is shown (R2 values were obtained from Pearson correlation; red dots highlight the top gene markers for each cluster). c) Gene expression correlation between WT cells and expression profiles from the Mouse Cell Atlas dataset, as obtained by scMCA (see online methods).
Extended Data Fig. 4
Extended Data Fig. 4. Cluster annotation, supporting evidence for HSC self-renewal and Lineage-negative, c-Kit+ cells validation in Tet2 KO
a) Differentially expressed genes for WT cluster HSC-1 (492 cells), HSC-2 (288 cells) or HSC-3 (384 cells), relative to the remaining HSC clusters from Chromium data (n = 4 mice; logistic regression with Bonferroni correction; FDR < 0.05). b) Drop-seq data for Lin, c-Kit positive cells for WT (2,986 cells, n = 2 mice) or Tet2 KO (1,425 cells, n = 2 mice) progenitors 4 weeks after recombination (HSCs = Hematopoietic stem cells; IMP = Immature myeloid progenitors; MD = Monocytic-dendritic progenitors; NP = Neutrophil progenitors; EP = Erythroid progenitors; MkP = Megakaryocyte progenitors; CLP = Common lymphoid progenitors; Ba = Basophil progenitors; Eo = Eosinophil progenitors; B-cellP = B-cell progenitors; T-cellP = T-cell progenitors). c) Frequency changes for HSCs, MDs and EPs 4 weeks after recombination (Permutation test on 1,425 randomly sampled cells from each genotype, with 105 iterations). d) Quiescence score per cell cycle category (above/below median) in WT HSCs (n = 1,982 cells; two-sided Wilcoxon rank sum test). e) Flow cytometry of cell cycle in LT-HSCs as measured by Mki67 expression for WT (n = 4 mice) or Tet2 KO (n = 3 mice) 4 weeks after recombination (two-sided Student t-test). f) Serial re-plating colony-formation assays for WT (n = 11) and Tet2 KO (n = 7) Lin, c-Kit+ bone marrow hematopoietic (CFU = colony formation unit; dots represent the mean; error bars represent standard deviation; two-sided Students t-test). g) Differentially expressed genes per WT cluster Mono-1 (n = 344 cells), Mono-2 (n = 345 cells) or Mono-3 (n = 284 cells), relative to the remaining monocyte clusters. Differentially expressed genes were defined from Chromium data (n = 4 mice; logistic regression with Bonferroni correction; FDR < 0.05). h) Expression of Ly6c2 and H2-Ab1 in WT Mono-1 (n = 344 cells), Mono-2 (n = 345 cells) and Mono-3 (n = 284 cells) clusters (logistic regression with Bonferroni correction).
Extended Data Fig. 5
Extended Data Fig. 5. Flow cytometry validation, peripheral blood counts, in vitro colony-forming assay and 20 weeks post pIpC validations of Tet2 KO frequency changes
a) Frequency changes for Lin Tet2 KO (18,651 cells, n = 7 mice) relative to WT (17,702 cells, n = 7 mice) 4 weeks after recombination. Red dots indicate significant frequency changes; red error bars represent standard deviation; dashed line indicates WT reference frequencies; grey shadow region indicates +/− standard deviation (LMM followed by ANOVA; * P < 0.05; ** P < 0.01; *** P < 0.001). b) Flow cytometry for WT (n = 15) and Tet2 KO (n = 23) mice 4 weeks after recombination (two-sided Students t-test; bars represent the mean value, error bars represent the standard deviation; LT-HSC = long-term hematopoietic stem cell; MPP = Multi-potent progenitor; HPC = Hematopoietic progenitor cell; CMP = common myeloid progenitor; GMP = Granulocyte-monocyte progenitor; MEP = megakaryocyte-erythrocyte progenitor). c) Peripheral blood cell counts from WT (n = 10) or Tet2 KO (n = 10) mice, either 4 or 20 weeks after Cre-mediated recombination (two-sided Students t-test; bars represent the mean and error bars represent the standard deviation. Each dot represents a mouse replicate; RBC = red blood cells; MCV = mean corpuscular volume). d) Erythroid colony-forming assay for WT (n = 4) or Tet2 KO (n = 4) mice, 4 weeks after recombination (two-sided Student t-test; bars represent the mean number of colonies for each genotype; error bars represent standard deviation). e) Drop-seq data showing 2,478 randomly sampled cells from Lin cells for WT (2,757 cells) or Tet2 KO (2,875 cells) 20 weeks after recombination (HSCs = Hematopoietic stem cells; IMP = Immature myeloid progenitors; MD = Monocytic-dendritic progenitors; NP = Neutrophil progenitors; EP = Erythroid progenitors; MkP = Megakaryocyte progenitors; CLP = Common lymphoid progenitors; Ba = Basophil progenitors; Eo = Eosinophil progenitors; B-cellP = B-cell progenitors; T-cellP = T-cell progenitors). f) Frequency changes for monocyte (Mono 1–3) and erythroid (Ery 1–3) progenitor clusters (permutation test).
Extended Data Fig. 6
Extended Data Fig. 6. Validation of cell cluster frequency changes in Idh2-R140Q mutant mice and Dnmt3a KO mice
a) Frequency changes for Lin Idh2-R140Q (n = 3) relative to WT (n = 6) mice 4 weeks post-recombination (linear mixed model (LMM) followed by ANOVA; *P < 0.05; ***P < 0.01). b) E/B and Ery 1–3 frequencies 4 weeks after recombination for WT (n = 6) and Idh2-R140Q (n = 3) mice. Error bars represent standard error of the mean (SEM; LMM followed by ANOVA). c) Ratio between erythroid (E/B, Ery-1 and ERy-2) and monocytic (IMP-1 and Mono-1) clusters for WT (n = 6) and Idh2-R140Q (n = 3) mice 4 weeks post-recombination. Error bars indicate SEM (LMM followed by ANOVA). d) Flow cytometry of hematopoietic progenitors from WT (n = 10) and Idh2-R140Q (n = 8) mice 4 weeks post-recombination (two-sided Students t-test; LT-HSC = long-term hematopoietic stem cell; MPP = Multi-potent progenitor; HPC = Hematopoietic progenitor cell; CMP = common myeloid progenitor; GMP = Granulocyte-monocyte progenitor; MEP = megakaryocyte-erythrocyte progenitor). e) Peripheral blood monocytes for WT (n = 22) or Idh2-R140Q (n = 8) mice 4 weeks post-recombination (two-sided Students t-test). f) Differential gene expression between WT (n = 2,150 cells) and Idh2-R140Q (n = 1,184 cells) HSC 1–3 clusters. Red dots represent differentially expressed genes (permutation test followed by Benjamini-Hochberg (BH) correction, P < 0.05 and absolute log2 fold change > 1). g) Frequencies for Lin Dnmt3a KO (n = 4) relative to WT (n = 4) mice, 4 weeks post-recombination (LMM followed by ANOVA; *P < 0.05; ***P < 0.001). h) Flow cytometry of WT (n = 5) and Dnmt3a KO (n = 8) mice 4 weeks post-recombination (two-sided Students t-test). i) Peripheral blood measurements for WT (n = 8) or Dnmt3a KO (n = 8) mice 4 weeks post-recombination (two-sided Students t-test; RBC = red blood cell; MCV = mean corpuscular volume). j) Frequency changes in HSCs (Hlf+), erythroid (Car1+) and monocyte (Ly6c2+; Irf8+) progenitors for WT (n = 6), Tet2 KO (n = 6) and Dnmt3a KO (n = 4) mice clustered independently for each technology. For bar plots, bars represent mean values, dots represent mouse replicates and error bars represent standard deviation unless indicated otherwise. For radar plots, red dots indicate significant frequency changes; red error bars represent standard deviation; dashed line indicates WT reference frequencies and shadow region indicates +/− standard deviation.
Extended Data Fig. 7
Extended Data Fig. 7. Gene module analysis
a) Schematic representation of the process for gene module identification. b) Correlation between gene module scores in HSC clusters (HSC 1–3), as calculated by the number of unique molecular identifiers (UMIs) mapping to the genes from each module per 10,000 total UMIs in the cell (Pearson correlation). c) Transcriptional priming values per biological replicate for Tet2 KO (n = 2,989 cells; n = 7 mice), WT (n = 2,150 cells; n = 7 mice) and Dnmt3a KO (n = 1,325 cells; n = 4 mice). Dots represent the mean value; error bars show the 95% confidence interval.
Extended Data Fig. 8
Extended Data Fig. 8. Mean CpG frequencies per base of erythroid and monocytic transcription factor binding motifs.
a) Schematic representation of the process for mean CpG frequency per base calculation for transcription factor binding motif position weight matrix. b) Scatter plot showing the correlation between the ratio of transcription factor regulon activity change between Tet2 KO (n = 7 mice) and WT (n = 7 mice), as calculated by the total number of molecules mapping to the genes comprising the regulons for the HSC 1–3 clusters per 10,000 UMIs in the cluster, and the product of the CpG frequency in the transcription factor motif and enrichment score as determined by SELEX (two-sided Students t-test). c) Mean CpG frequency per base differences between erythroid- and monocytic-associated transcription factors according to different thresholds used for expression change between clusters (n = 7 biologically independent animals; two-sided Wilcoxon rank sum test; FC = fold change). d) Examples of motif CpG content and methylation for Klf1 and Spi1 transcription factors as obtained from the MethMotif database.
Extended Data Fig. 9
Extended Data Fig. 9. Mean CpG frequency per base correlates with methylation of motifs at accessible enhancer regions
a) Gating for cell sorting for ATAC-Bseq experiments (LSK = lineage negative; Sca1 positive; c-Kit positive). b) Correlation between biological replicates for ATAC-Bseq experiments. Reads were downsampled to 30 x 106 reads per sample and the average read count per 10 kbp genomic windows was calculated (Pearson correlation). c) Examples of Homer output for de novo motif enrichment for either erythroid- or myelo-monocytic-associated accessible peaks within 10 kb of the closest transcriptional start site. d) Correlation between mean CpG frequency per base and the number of differentially (FDR<0.25, absolute methylation difference > 5%) hyper- or hypo-methylated CpGs between WT and Tet2 KO (n = 104,829 CpG sites) or Dnmt3a KO (250,353 CpG sites) respectively, per 100 motifs at accessible enhancers (upper panel) or accessible promoters (two-sided Students t-test; bottom panel; Spearman correlation). e) Number of hypermethylated CpGs per 10,000 motifs for erythroid- or monocyte-associated transcription factor motifs. 100 iterations of sampling without replacement were performed, sampling 10,000 motif sites each iteration, and measuring the number of differentially (FDR<0.25, absolute methylation difference > 5%) hypermethylated or hypomethylated sites captured in Tet2 KO (n = 2 mice) and Dnmt3a KO (n = 2 mice), respectively (two-sided Students t-test). f) Correlation between the percentage of hyper- or hypo-methylated CpGs between WT (n = 2 mice) and Tet2 KO (n = 2 mice) or Dnmt3a KO (n = 2 mice), respectively from total CpGs captured for each transcription factor DNA binding motif site and the mean CpG frequency per base, for motifs in accessible enhancers (middle panel) or accessible promoters (bottom panel; Spearman correlation; two-sided Students t-test).
Extended Data Fig. 10
Extended Data Fig. 10. Single cell RNA and methylation reveals increased heterogeneity and links enhancer methylation with transcriptional priming
a) LT-HSCs cell cycle scores for WT (n = 178 cells), Tet2 KO (n = 182 cells) and Dnmt3a KO (N =50 cells) as calculated by the number of UMIs mapping to the gene set per 10,000 total UMIs for each of the mapped clusters (two-sided Wilcoxon rank sum test). b) Single cell methylation percentage of CpG islands (CpGi), exon, intron and promoter regions for WT (n = 178 cells), Tet2 KO (n = 182 cells) or Dnmt3a KO (n = 50 cells) LT-HSCs. CpGi were robust to Tet2 deletion-induced hypermethylation, as previously reported,. c) Correlation between erythroid-to-monocytic transcriptional priming and mean enhancer methylation in WT (n = 178), Tet2 KO (n = 182) and Dnmt3a KO (n = 50) LT-HSCs (Spearman correlation; two-sided Students t-test). d) Average single cell enhancer methylation comparison between erythroid (n = 151 cells) or monocytic (n = 166 cells) primed LT-HSCs across genotypes (two-sided Wilcoxon rank sum test). e) CD34+ hematopoietic bone marrow progenitors from normal (n = 1,035 cells) or DNMT3A-F755S mutant affected (n = 7,338 cells) subjects. f) Clusters for the clonal hematopoiesis sample (HSC = hematopoietic stem cell; IMP = immature myeloid progenitor; Neu = neutrophil/granulocyte progenitor; Ery = erythroid progenitor; M/D = monocyte-dendritic progenitor; CLP = common lymphoid progenitor; MkP = megakaryocyte progenitor; cc = high cell cycle cluster; mt = high mitochondrial gene expression cluster). g) Differentially expressed genes per cluster (FDR < 0.05; logistic regression with Bonferroni correction; Supplementary Table 2) per cluster are shown. h) Gene marker expression from erythroid (GATA1, CA1), monocyte (IRF8, LGALS1), megakaryocyte (PF4, PLEK) and neutrophil (MPO, ELANE) cells. i) Frequency of GATA1+ cells for normal (n = 1,035 cells) and DNMT3A-F755S (n = 7,338 cells) clonal hematopoiesis subject. Cells were defined as positive when at least one UMI was detected for GATA1 (two-sided Fisher exact test).
Figure 1.
Figure 1.. Experimental design and single cell RNA sequencing data integration and clustering.
a) Experimental design for scRNA-seq experiments, showing the number of mice used for each genotype (pIpC = polyinosinic-polycytadylic acid; FACS = Fluorescence-assisted cell sorting, Lin = Lineage negative, DAPI = negative for DAPI staining). b) Single cell expression profiles from 200 randomly sampled cells from each of the cell clusters from WT mice (HSC = Hematopoietic stem cell; IMP = Immature myeloid progenitor, Mono = Monocyte progenitor, Neu = Neutrophil/granulocyte progenitor; E/B = Erythroid/basophil progenitor; Ery = Erythroid progenitor; MkP = Megakaryocyte progenitor; CLP = Common lymphoid progenitor; Ba = Basophil progenitor; Eo = Eosinophil progenitor; B-cell-P = B-cell progenitor; T-cell-P = T-cell progenitor). Examples of genes used for classification are shown. c) Uniform Manifold Approximation and Projection (UMAP) dimensionality reduction (n = 68,613 cells) d) Top three differentially expressed genes (FDR < 0.05, logistic regression with Bonferroni correction) when comparing each cell cluster with the remaining clusters corresponding to the same cell type in WT (N = 4 mice from Chromium technology). HSCs = Hematopoietic stem cells (n = 1,164 cells); MDs = Monocytic-dendritic progenitor, (n = 917 cells); EPs = Erythroid progenitors (n = 1,169 cells); NPs = Neutrophil progenitors (n = 2,421 cells). The dot size encodes the fraction of cells within the cluster that show detectable expression of the gene (UMIs > 0), while the color encodes the average expression level across all cells within a cluster.
Figure 2.
Figure 2.. Tet2 KO promotes HSC expansion and skews myelo-monocytic vs. erythroid progenitor frequencies.
a) Changes in cluster frequencies for lineage negative Tet2 KO (18,651 cells, n = 7 mice) relative to WT (17,702 cells, n = 7 mice). Red dots indicate significant frequency changes; red error bars represent standard deviation; dashed line indicates WT reference frequencies; shadow region indicates +/− standard deviation. Statistical comparison was performed by linear mixed model (LMM) followed by ANOVA; * P < 0.05; ** P < 0.01; *** P < 0.001). b) HSC 1–3 cluster frequencies for WT (n = 7 mice) and Tet2 KO (n = 7 mice; LMM followed by ANOVA. c) Left panel: comparison of cell cycle signature for WT (n = 1,136 cells, n = 7 mice) and Tet2 KO (n = 1,728 cells; n = 7 mice; two-sided Wilcoxon rank sum test). Right panel: quiescence score for each cell for WT (n = 1,136 cells, n = 7 mice) and Tet2 KO (n = 1,728 cells; n = 7 mice; two-sided Wilcoxon rank sum test). d) Mono 1–3 cluster frequencies for WT (n = 7 mice) and Tet2 KO (n = 7 mice; LMM followed by ANOVA). e) Bone marrow monocyte precursor cell frequency as measured by flow cytometry for WT (n = 18) and Tet2 KO (n = 13) mice (two-sided Student t-test; error bars represent standard deviation). f) E/B and Ery 1–3 cluster frequency for WT (n = 7 mice) and Tet2 KO (n = 7 mice; LMM followed by ANOVA) g) Ratio between WT (n = 7 mice) and Tet2 KO (n = 7 mice) early erythroid (E/B, Ery-1 and Ery-2) and monocytic (IMP-1 and Mono-1) cluster frequencies. (LMM followed by ANOVA). h) Overview of relative changes in cluster frequencies for lineage-negative Dnmt3a KO (n = 4 mice) relative to technology-matched WT (n = 4 mice) progenitors. Red dots indicate significant frequency changes; red error bars indicate standard deviation; dashed line indicates WT reference frequencies; shadow region indicates +/− standard deviation (LMM followed by ANOVA; * P < 0.05, *** P < 0.001). i) HSC 1–3 cluster frequency for WT (n = 4 mice) and Dnmt3a KO (n = 4 mice; LMM followed by ANOVA). j) Mono 1–3 cluster frequencies for WT (n = 4 mice) and Dnmt3a KO (n = 4 mice; LMM followed by ANOVA). k) Flow cytometry measurement of Ly6c+ monocyte precursors for WT (n = 6) and Dnmt3a KO (n = 7) mice (two-sided Students t-test; error bars represent standard deviation). l) MkP-1 cluster frequency for WT (n = 4 mice) and Dnmt3a KO (n = 4 mice; LMM followed by ANOVA). m) E/B and Ery 1–3 cluster frequency for WT (n = 4 mice) and Dnmt3a KO (n = 4 mice; LMM followed by ANOVA). n) Ratio between WT (n = 4 mice) and Dnmta3 KO (n = 4 mice) early erythroid (E/B, Ery-1 and Ery-2) and monocytic (IMP-1 and Mono-1) cluster frequencies (LMM followed by ANOVA). All experiments in this figure were performed 4 weeks after recombination. For all barplots, bars indicate the mean frequencies; dots indicate biological replicates and error bars represent standard error except indicated otherwise.
Figure 3.
Figure 3.. Erythroid-to-myeloid committed progenitor frequency changes are concordant with skewed HSC transcriptional priming.
a) UMAP highlighting the selected HSC clusters (HSC 1–3, left panel). Differential gene expression between WT (n = 2,150 cells) and Tet2 KO (n = 2,989 cells, central panel) or WT and Dnmt3a KO (n = 1,325 cells, right panel) HSC 1–3 clusters. Red dots represent differentially expressed genes (permutation test followed by Benjamini-Hochberg (BH) correction, FDR < 0.05, see online methods) with an absolute log2 fold change higher than 0.5. Pathway enrichment was performed with EnrichR. b) Top panel: heatmap showing single cells from HSC 1–3 clusters. Bottom panel: Generalized additive model fit for erythroid, myelo-monocytic and stem scores from WT (n = 7 mice) HSC 1–3 clusters (n = 7,648 cells). Grey areas represent the 95% confidence interval. c) For each genotype, 1,225 cells from the HSC 1–3 clusters were randomly sampled and density plots were generated. The percentage of cells with either erythroid or myelo-monocytic priming is shown. d) Transcriptional priming scores for HSC 1–3 cells for Tet2 KO (2,989 cells; n = 7 mice), WT (2,150 cells; n = 7 mice) and Dnmt3a KO (1,225 cells, n = 4 mice) progenitors (two-sided Wilcoxon rank sum test followed by Bonferroni correction). e) Posterior probabilities of Gaussian mixture model fit for myelo-monocytic transcriptional priming for 1,225 randomly sampled cells from the HSC 1–3 clusters for WT (n = 4), Tet2 KO (n = 3) or Dnmt3a KO (n = 4) from Chromium samples (Binomial test). f) In vitro colony-forming assay using purified LT-HSCs from WT (n = 282 colonies), Tet2 KO (n = 391 colonies) or Dnmt3a KO (n = 209 colonies; two-sided Fisher exact test; CFU-GM = colony-forming unit granulocytic/monocytic; BFU-E = burst-forming unit erythroid; CFU-GEMM = colony-forming unit granulocytic/erythroid/monocyte/megakaryocyte, see online methods). g) Schematic representation of the procedure for visualization of the differentiation topology. h) Differentiation topologies derived from scRNA-seq data.
Figure 4.
Figure 4.. Tet2 KO and Dnmt3a KO promote differential methylation of accessible transcription factor binding sites, favoring CpG rich erythroid motifs.
a) Schematic representation of modulation of transcription factor activity through mutation in Tet2 or Dnmt3a, as a function of the CpG enrichment of the binding motif. Filled circle = methylated CpGs, unfilled circles represent unmethylated CpGs. b) Fold change in transcription factor expression between Ery 1–3 and IMP 1–2 in WT (n = 7 mice) clusters. Erythroid and myelo-monocytic transcription factors with FDR < 0.05 and absolute log2 fold change > 0.3 are highlighted in red and blue, respectively (permutation test followed by Benjamini-Hochberg (BH) correction). Inset: examples of CpG frequency per motif position are shown as grey bars. Mean CpG frequency per base for the motifs are shown as black bars. c) Mean CpG frequency per base of the DNA binding motifs of myelo-monocytic- (n = 8) and erythroid-associated (n = 11) transcription factors (two-sided Students t-test). d) Schematic representation of ATAC-Bseq experimental protocol. e) Mean CpG frequency per base for de novo discovered transcription factor binding motifs in peaks associated with erythroid (n = 20 motifs) or myelo-monocytic (n = 20 motifs) genes (two-sided Students t-test). f) Differential ATAC-Bseq accessibility between WT (n = 2 mice) and Tet2 KO (n = 2 mice) or WT and Dnmt3a KO (n = 2 mice). g) Differential methylation (FDR < 0.05 and absolute methylation difference higher than 5%) at accessible regions for Tet2 KO and Dnmt3a KO mice, as calculated with MethylKit (Chi-squared with sliding linear model correction). h) Number of hyper-methylated CpGs (FDR < 0.25 and methylation difference > 5%) for Tet2 KO (n = 104,829 total CpG sites; left panel) or hypo-methylated CpGs (FDR < 0.25 and methylation difference < −5%) for Dnmt3a KO (250,353 total CpG sites; right panel) per 100 motifs in ATAC-Bseq peaks for erythroid, myelo-monocytic or other fates is shown in red, blue and grey, respectively (Pearson correlation; two-sided Students t-test; grey area represents the 95% confidence interval of the linear fit). i) Methylation values of accessible sites containing the DNA binding motif for Tal1 were divided into quartiles, and the distribution for WT (n = 1,669 motifs; n = 2 biologically independent mice), Tet2 KO (n = 880 motifs; n = 2 mice) and Dnmt3a KO (n = 1,226 motifs; n = 2 mice) is shown (two-sided Fisher exact test between first and fourth quartiles).
Figure 5.
Figure 5.. Single-cell ATAC-seq reveals shifts in motif accessibility
a) Uniform Manifold Approximation and Projection (UMAP) for snATAC-seq data (n = 20,029 cells). HSC = hematopoietic stem cell; MEP = megakaryocyte-erythrocyte progenitor; MPP = multi-potent progenitor; IMP = immature myeloid progenitor; CLP = common lymphoid progenitor; LMPP = lymphoid-primed multi-potent progenitor; CMP = common myeloid progenitor. b) Single cell scores for available bulk ATAC-seq profiles from the ImmGen Database of FACS-sorted hematopoietic progenitors (see online methods). c) Single cell motif accessibility deviation scores as a proxy of transcription factor binding activity for Tal1 and Spi1 transcription factors for WT (n = 5,810 cells), for each of the defined clusters as calculated by chromVar for the DNA binding motifs available from the HOCOMOCO v11 database. d) Motif accessibility correlation between single cells. Mean accessibility for each transcription factor was calculated using chromVar, followed by cell-to-cell Pearson correlation of motif accessibility calculated for WT cells from the HSC cluster (n = 1,410 cells) e) Motif accessibility deviation scores comparison between WT (n = 1,410 cells), Tet2 KO (n = 1,173) and Dnmt3a KO (n = 1,305 cells) cells mapped to the HSC cluster (two-sided Wilcoxon rank sum test). f) Mean CpG frequency per base of de novo motifs divided into quartiles based on the CpG content for Tet2 KO (n = 27 motifs) or Dnmt3a KO (n = 27 motifs).
Figure 6.
Figure 6.. Single-cell multi-omics links enhancer methylation and transcriptional priming, and identifies transcriptional priming skews within a human clonal hematopoiesis sample.
a) Schematic representation of the scRRBS+RNA protocol. b) Frequency of WT (n = 178 cells), Tet2 KO (n = 182 cells) and Dnmt3a KO (n = 50 cells) LT-HSCs mapped by maximum likelihood to the clusters shown in Figure 1b (two-sided Fisher exact test). c) Left panel: Cell cycle analysis of scRNA-seq data for LT-HSCs, comparing WT (n = 178 cells), Tet2 KO (n = 182 cells) and Dnmt3a KO (n = 50 cells) progenitors (two-sided Wilcoxon rank sum test). Right panel: Quiescence score for WT, Tet2 KO and Dnmt3a KO LT-HSCs (two-sided Wilcoxon rank sum test). d) Transcriptional priming scores for WT (n = 178 cells), Tet2 KO (n = 182 cells) and Dnmt3a KO (n =50 cells) LT-HSCs (two-sided Wilcoxon rank sum test). e) Single cell average enhancer methylation for WT (n = 178 cells), Tet2 KO (n = 182 cells) and Dnmt3a KO (N =50 cells) LT-HSCs (two-sided Wilcoxon rank sum test). f) Transcriptional priming scores per average enhancer methylation quartile for WT (n = 178 cells), Tet2 KO (n = 182 cells) and Dnmt3a KO (N =50 cells) progenitors (first quartile vs. fourth quartile; two-sided Wilcoxon rank sum test). g) Mean CpG frequency per base for either Mus musculus or Homo sapiens transcription factor binding motifs (n = 335 motifs) extracted from the HOCOMOCO v11 database (two-sided Students t-test). h) Mean CpG frequency per base correlation between Mus musculus and Homo sapiens transcription factor binding motifs (Pearson correlation). i) Schematic representation of the procedure to link single cell genotypes to scRNA-seq profiles. j) Intra-sample transcriptional priming for the clonal hematopoiesis sample, comparing WT and DNMT3A-F755S CD34+ bone marrow progenitor cells (two-sided Students t-test).

Comment in

References

    1. Ley TJ et al. DNMT3A mutations in acute myeloid leukemia. N Engl J Med 363, 2424–2433, doi:10.1056/NEJMoa1005143 (2010). - DOI - PMC - PubMed
    1. Delhommeau F et al. Mutation in TET2 in myeloid cancers. N Engl J Med 360, 2289–2301, doi:10.1056/NEJMoa0810069 (2009). - DOI - PubMed
    1. Gross S et al. Cancer-associated metabolite 2-hydroxyglutarate accumulates in acute myelogenous leukemia with isocitrate dehydrogenase 1 and 2 mutations. J Exp Med 207, 339–344, doi:10.1084/jem.20092506 (2010). - DOI - PMC - PubMed
    1. Busque L et al. Recurrent somatic TET2 mutations in normal elderly individuals with clonal hematopoiesis. Nat Genet 44, 1179–1181, doi:10.1038/ng.2413 (2012). - DOI - PMC - PubMed
    1. Abelson S et al. Prediction of acute myeloid leukaemia risk in healthy individuals. Nature 559, 400–404, doi:10.1038/s41586-018-0317-6 (2018). - DOI - PMC - PubMed

Methods-only references

    1. Kuleshov MV et al. Enrichr: a comprehensive gene set enrichment analysis web server 2016 update. Nucleic Acids Res 44, W90–97, doi:10.1093/nar/gkw377 (2016). - DOI - PMC - PubMed
    1. Liu T Use model-based Analysis of ChIP-Seq (MACS) to analyze short reads generated by sequencing protein-DNA interactions in embryonic stem cells. Methods Mol Biol 1150, 81–95, doi:10.1007/978-1-4939-0512-6_4 (2014). - DOI - PubMed
    1. Love MI, Huber W & Anders S Moderated estimation of fold change and dispersion for RNA-seq data with DESeq2. Genome Biol 15, 550, doi:10.1186/s13059-014-0550-8 (2014). - DOI - PMC - PubMed
    1. Akalin A et al. methylKit: a comprehensive R package for the analysis of genome-wide DNA methylation profiles. Genome Biol 13, R87, doi:10.1186/gb-2012-13-10-r87 (2012). - DOI - PMC - PubMed
    1. Yoshida H et al. The cis-Regulatory Atlas of the Mouse Immune System. Cell 176, 897–912 e820, doi:10.1016/j.cell.2018.12.036 (2019). - DOI - PMC - PubMed

Publication types

Substances